ENERGY TRANSFER
     Investor Presentation

            January 2020
←
→
Page content transcription
If your browser does not render page correctly, please read the page content below

ENERGY TRANSFER
Investor Presentation
January 2020
FORWARD-LOOKING STATEMENTS / LEGAL DISCLAIMER

Management of Energy Transfer LP (ET) will provide this presentation to analysts and/or investors at meetings to be held throughout January 2020. At the meetings, members of
management may make statements about future events, outlook and expectations related to Panhandle Eastern Pipe Line Company, LP (PEPL), Sunoco LP (SUN), USA
Compression Partners, LP (USAC), Energy Transfer Operating, L.P. (ETO) and ET (collectively, the Partnerships), and their subsidiaries and this presentation may contain
statements about future events, outlook and expectations related to the Partnerships and their subsidiaries all of which statements are forward-looking statements. Any statement
made by a member of management of the Partnerships at these meetings and any statement in this presentation that is not a historical fact will be deemed to be a forward-
looking statement. These forward-looking statements rely on a number of assumptions concerning future events that members of management of the Partnerships believe to be
reasonable, but these statements are subject to a number of risks, uncertainties and other factors, many of which are outside the control of the Partnerships. While the
Partnerships believe that the assumptions concerning these future events are reasonable, we caution that there are inherent risks and uncertainties in predicting these future
events that could cause the actual results, performance or achievements of the Partnerships and their subsidiaries to be materially different. These risks and uncertainties are
discussed in more detail in the filings made by the Partnerships with the Securities and Exchange Commission, copies of which are available to the public. The Partnerships
expressly disclaim any intention or obligation to revise or publicly update any forward-looking statements, whether as a result of new information, future events, or otherwise.
This presentation includes certain forward looking non-GAAP financial measures as defined under SEC Regulation G, including estimated adjusted EBITDA. Due to the forward-
looking nature of the aforementioned non-GAAP financial measures, management cannot reliably or reasonably predict certain of the necessary components of the most directly
comparable forward-looking GAAP measures without unreasonable effort. Accordingly, we are unable to present a quantitative reconciliation of such forward-looking non-GAAP
financial measures to their most directly comparable forward-looking GAAP financial measures.
All references in this presentation to capacity of a pipeline, processing plant or storage facility relate to maximum capacity under normal operating conditions and with respect to
pipeline transportation capacity, is subject to multiple factors (including natural gas injections and withdrawals at various delivery points along the pipeline and the utilization of
compression) which may reduce the throughput capacity from specified capacity levels.

                                                                                                                                                                                  2
ET KEY INVESTMENT HIGHLIGHTS
Growth From Organic
Well Positioned Assets Solid Financials
Investments
Fully integrated platform Completing multi-year Stable cash flow profile
spanning entire midstream capex program with minimal contract roll-
value chain Seeing strong EBITDA offs
Assets well positioned in growth from recently Healthy and improving
most active basins completed major growth balance sheet
projects Increased retained cash
Integrated assets allow
solid commercial synergies Expect additional EBITDA flow with ~$2.5 – $3.0
including gas, crude and growth from remainder of billion per year of
NGLs projects coming online distribution coverage
through 2020 expected
Well positioned for sustainable organic growth
and improved financial strength
3
WHAT’S NEW
Consistent Growth
Recent Developments
With Strong Financial/Operational Performance
Increased ESG-related content on corporate website
Successful Sr. Notes and Preferred Units offering in Jan. 2020 Adj. EBITDA1
$12
Commissioned Panther II processing plant in Dec. ‘19
Reduced 2020 growth capital outlook Midpoint of
2019
$10
Closed SEMG acquisition in Dec. ’19 Guidance
Range
PE4 placed in full service in Oct. ’19
Executed SEMG finance synergies by calling/redeeming high $8
yield notes and HFOTCO Term Loan (over $50mm in annual
interest savings)
$ in billions
$6
Improved Financial Position
Q3’19
$4 YTD
Transforming key financial metrics
Moody’s revised Energy Transfer Operating, L.P. (“ETO”)
credit rating to stable
$2
Baa3 (investment grade)
~$2.5 – $3.0 billion per year distribution coverage expected
$0
As of Sept. 30, 2019, YTD ’19 excess distributable cash
2015 2016 2017 2018 2019
flow after distributions of $2.4 billion
~1.7x – 1.9x expected long-term coverage ratio
As of Sept. 30, 2019, YTD ’19 coverage was 1.98x2
1. See Appendix for Reconciliation of Non-GAAP financial measures 4
2. Distribution coverage ratio for a period is calculated as Distributable Cash Flow attributable to partners, as adjusted, divided by net distributions expected to be paid to the partners of ET in respect of such period
DELIVERING ON ALL FRONTS
Operational Q3 2019 Financials Strategic
All segments delivered strong Adjusted EBITDA - $2.8 billion Successfully completed
results acquisition of SEMG
− Up 8% from Q3’18
Reported record NGL SEMG transaction adds
transportation throughput, NGL DCF - $1.5 billion
strategic growth platform in
fractionation volumes, deep-water port on the Houston
− Up 10% from Q3’18
midstream gathered volumes,
Ship Channel
crude volumes Distribution coverage ratio –
1.9x Transaction immediately
Red Bluff Express Phase II
completed in August 2019 accretive and balance sheet
YTD Growth Capital - $3.1
friendly
billion, with incremental value
J.C. Nolan Pipeline went into
from organic growth projects Expands connectivity and
service in August 2019
increases reach into currently
Permian Express 4 went into full underserved regions
service October 1, 2019
Commissioned Panther II
Processing Plant in December
2019
5
Integrated franchise provides advantages through energy market cycles
UPDATED CAPEX OUTLOOK – A DISCIPLINED, QUICKER CASH
GENERATION CYCLE
2019E Growth Capital: ~$4 billion1
Reduced CAPEX guidance from previous estimate by $600-800 million
2019E Adjusted EBITDA now $11.0 billion to $11.1 billion (increased from $10.8-$11.0 billion in Nov. 2019)
Excess cash flow, as well as the Series E preferred units issued in April 2019, allowed year-to-date growth
capital to be funded without issuance of common equity or debt
2020E Growth Capital: ~$3.6-$3.8 billion1
Retained cash flow and proceeds from the Series F and G Preferreds are expected to cover all 2020 CAPEX
spending
• Lone Star Express Expansion
• Mariner East system completion (ME2, ME2X)
• Nederland LPG facilities
NGL & Refined Products
• Fractionation plants (VII, VIII)
• Orbit export facilities (Nederland and Mt. Belvieu)
• Multiple projects < $50mm
• Gathering and processing projects (primarily in West Texas) that deliver volumes to
Midstream ET’s downstream systems, the majority of which are with integrated, investment grade
counterparties
• Bakken pipeline optimization
Crude Oil • Ted Collins Pipeline
• Multiple projects < $50mm
2021E+ Backlog of Approved Growth Capital Projects: ~$1.5 billion1 6
1. Capital expenditures exclude expenditures related to recently completed SEMG acquisition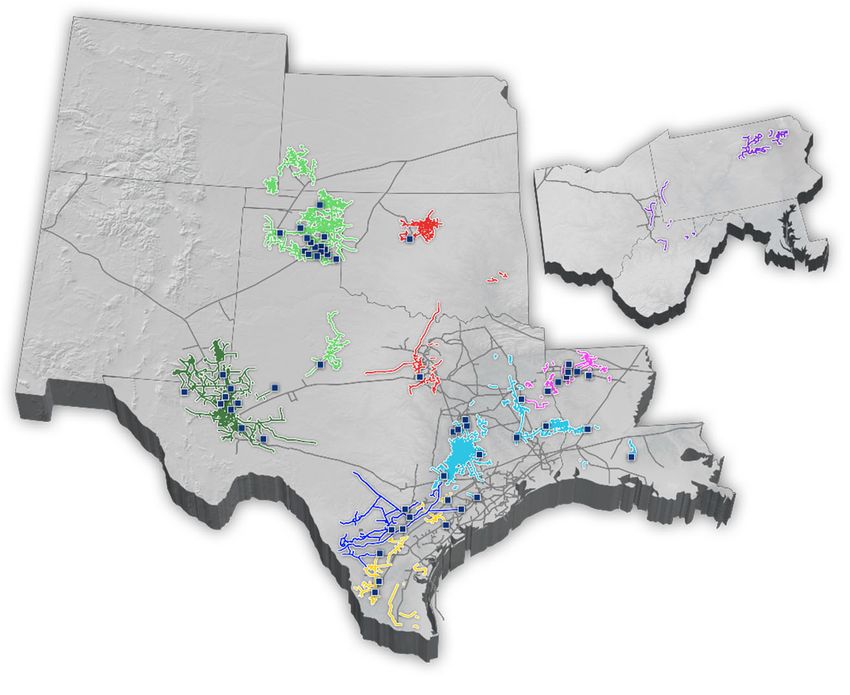
SEMG ACQUISITION HIGHLIGHTS

   Immediately Accretive                                 Premier U.S. Gulf Coast
Transaction With No Material                            Terminal With Stable, Take-
       Credit Impact                                        or-Pay Cash Flows
Generates an Aggregate $500MM of DCF                    18.2 MMBbl Crude Storage Capacity &
         Coverage 2020-2022                                     Export Capabilities

Complementary Assets That                                    Liquids-Focused
    Drive Commercial,                                  Infrastructure With No Direct
 Operational, Financial and                             Commodity Price Exposure
     Cost Synergies
                                                        Primary Assets are Terminals & Long-
      $170MM+ Annual Run-rate                                      Haul Pipelines

               Acquisition is consistent with plans to improve financial position
                                                                                               7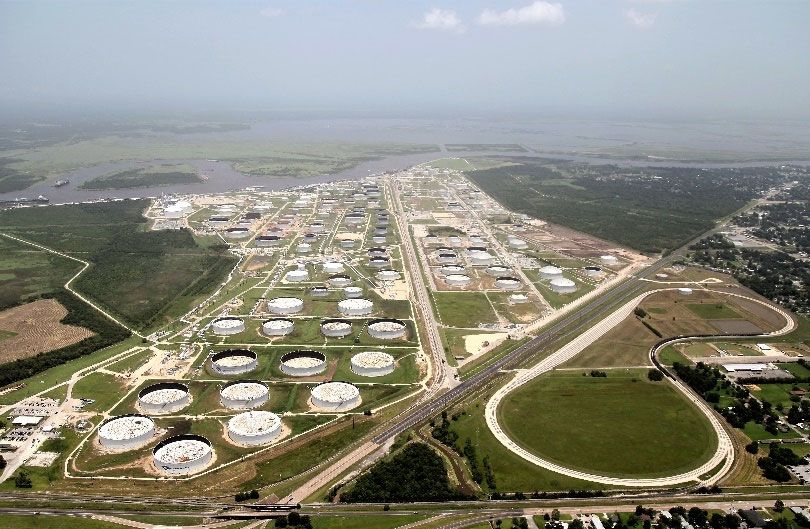
SEMG ASSET OVERVIEW

                                                                           USA
                                                                                                                     Canada                  Canada: SemCAMS
                                                                                                                                                Midstream
    U.S. Liquids: Rockies/MidCon                                                                                                   Unique platform in liquids-rich Montney
                                                                 MT                             ND                                 and Duvernay
  DJ Basin and Cushing                                                                                                              •   6 natural gas processing plants
  • 1,700 miles crude pipelines                                                                                                     •     ~700 miles natural gas gathering
  • 8.8 million barrels crude oil storage capacity                                         SD                                             pipelines
  • 99 crude oil trucks                                                                                                             •     ~60 miles of liquids pipelines
                                                                 WY
                                                                                                                                    •     60 mmcf/d Smoke Lake plant under
                                                                                                                                          construction
                                                                                               NE                                   •     200 mmcf/d Patterson Creek plant phase
                                                                                                                                          III under construction
             U.S. Gas: MidCon
                                                                                                                                    •     1.3 bcf/d total operating capacity(1) with
 STACK and Mississippi Lime                                       CO                                 KS                                   significant sulphur recovery

 • 1,100 miles gas gathering pipelines
 • 3 gas processing plants (565 mmcf/d
   total)
                                                                                                               AR                       U.S. Liquids: Gulf Coast
 • 680,000 dedicated gas gathering acres                          NM                                      OK
   from key producers                                                                                                         Strategic position in North America’s largest
                                                                                                                              energy complex
                                                                                                                               •    330 acres on Houston Ship Channel
                                                                                                                LA
                                                                                          TX                                  •    18.2 million barrels of storage
 Legend
                                                                                                                              •    Connectivity to Gulf Coast refining complex
     Crude Oil
     Natural Gas
                                                                                                                              •    Pipeline connectivity to all major basins
     Refined Products                                                                                                         •    Deepwater marine access
     Terminals                                                                                                                •    Rail and truck loading and unloading
     Pipelines                                                                                                                •    Maurepas Pipeline serving refineries
     3rd party pipeline*
                                                                                                                                                                                 8
* Long-term contract on 3rd-party pipeline transfers NGLs from DJ Basin to Mont Belvieu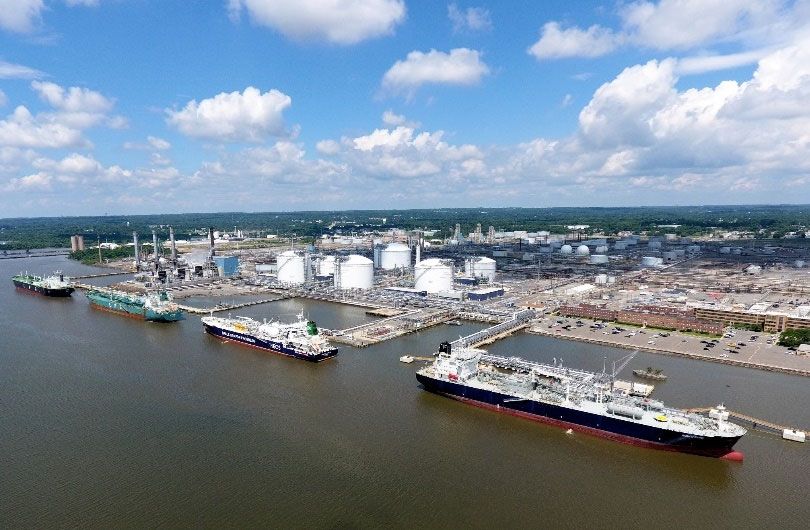
ET & SEMG COMPLEMENTARY ASSETS
Expands Crude Oil Asset Footprint
Strategic franchise-quality position on the Houston
Ship Channel
Will provide connectivity along the U.S. Gulf Coast
and throughout ET’s system
Increases reach into the DJ basin where ET does
not have a presence
Expands Logistical Optionality
Provides additional outlets for Permian, Rockies
and Mid-Continent producers
Offers deep-water marine access
DJ Basin infrastructure optionality
SemGroup
Crude Oil Expected Synergies
Natural Gas
Refined Products
Rose Valley II Plant Utilization rates on existing assets (i.e. Houston
Pipelines Fuel Oil Terminal (“HFOTCO”) docks closer to full
White Cliffs Pipeline
capacity)
Maurepas Pipeline
Energy Transfer
Presence in new markets generating opportunities
Terminals
for other aspects of portfolio (i.e. Houston Ship
Pipelines Channel, DJ Basin)
Lake Charles LNG
Mariner East 2X
Integrates assets with ET’s Nederland terminal
Revolution and U.S. Gulf Coast assets
ETCO Pipeline
Dakota Access Pipeline Cost efficiencies with combined operations
Trans Pecos Pipeline
Comanche Trail Pipeline $170MM+ annual run-rate synergies including
commercial, operational, financial and cost
Note: Includes growth projects under construction. synergies
Fully-integrated midstream platform enhances ability to offer wide range of services to both domestic and international markets 9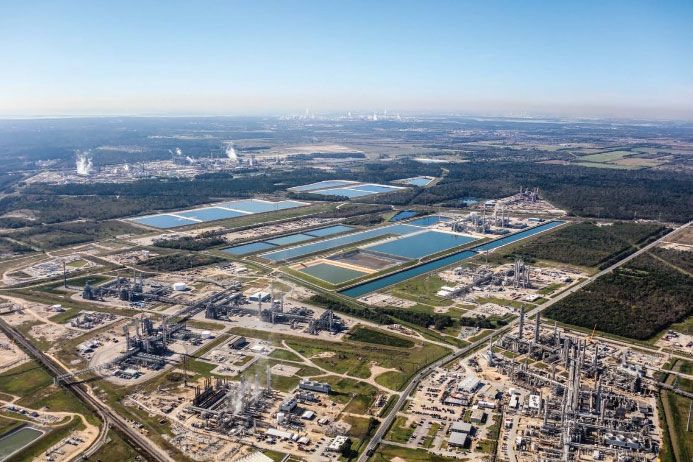
TRANSFORMING UNDERUTILIZED ASSETS
                              Mont Belvieu – 2011¹                                      Mont Belvieu – 2019

                                                                                                               Fracs       Frac VI
                                                                                                               IV & V                Frac VIII2
                                                                                           Frac VII2

                                                                               Frac I
                                                                                                  Frac II

                                                                                                            Export De-C2

                                                     Proposed
                                                       Frac I

                                                                            Frac III

                                                                ET

     •   Fractionators: 0                                            •   Fractionators: 6
     •   Fractionation capacity: 0 bbls/d                            •   Fractionation capacity: Up to 790,000 bbls/d
     •   Proposed 100,000 bbls/d Frac 1; in-service 2013             •   Frac VII under construction; expected in-service Q1 2020
     •   Potential for incremental 100,000 bbls/d Frac 2             •   Frac VIII under construction; expected in-service Q2 2021

                       Upon completion of Frac VIII in Q2 2021, ET will be capable of fractionating over
                                         1 million barrels per day at Mont Belvieu
                                                                                                                                                  10
1.   Source: Management Presentation 2011
2.   Under construction
TED COLLINS PIPELINE - A STRATEGIC CONNECTION ON THE
U.S. GULF COAST
~75-mile pipeline to connect the
Houston Ship Channel and ET’s
Nederland Terminal
Will provide best-in-class access
to multiple markets
Houston
Beaumont/Port Arthur
St. James
Initial capacity of 500 MBbl/d+
Will provide immediate access to
1,000 MBbl/d+ of export capacity
with plans to double
Expected to be in service in 2021
Strategic new pipeline provides increased optionality and enhances
value of the Nederland Terminal and Houston Ship Channel assets
11
Note: Pipeline route shown is for illustrative purposes.SUCCESSFUL ACQUISITION TRACK RECORD
HPL
TUFCO Houston Pipeline Co.
2004 2005 2006 2011 2012 2012
2012 2014 2015 2016 2017 2019
ET Management has a proven track record of successfully integrating acquisitions
Knowledge of respective assets and businesses facilitates integrations of:
Operations
Commercial
Risk Management
Finance / Accounting
Information Technology
Successfully completed acquisition of SEMG on December 5, 2019
12CAPITAL ALLOCATION – INCREASED FOCUS ON RETURNS
Organic Unit Buy- Distribution Debt
Projects backs Increases Retirements
• Maintain strong investment grade balance sheet Leverage target: 4.0 –
– Continued improvement in debt metrics 4.5x debt/EBITDA
• Efficiently fund organic growth capital projects
– High-grade investment options with higher return thresholds
– Majority funded with retained cash flow
• Multiple options available after achieving debt targets
– Options not mutually exclusive
– Unit buy-backs > favorable return at current ET trading price
– Distribution increases > goal to have sustainable long-term growth 13DIVERSIFIED EARNINGS MIX
WITH PRIMARILY FEE-BASED BUSINESS
Segment1 Contract Structure Strength Q3 2019 Adjusted EBITDA by Segment1
More than 9,500 miles
connecting Permian,
Fees from transporting SUN, USAC
Crude Oil Bakken and Midcon Basins
and terminalling & Other Midstream
to U.S. markets, including
12% 15%
Nederland terminal
Intrastate
Fees from dedicated 8%
~60 facilities connected to
capacity and take-or-
ET’s NGL pipelines, and
pay contracts, storage
new frac expansions will
NGL & Refined fees and throughput
bring total fractionation NGL & Refined
Products fees, and fractionation Interstate
Products
capacity at the Mont Belvieu 16%
fees, which are 24%
complex to more than 1
primarily frac-or-pay
million bpd
structures
Crude Oil
25%
Interstate Fees based on Connected to all major U.S.
Transport & reserved capacity, supply basins and demand
Storage regardless of usage markets, including exports
Minimum volume 2018 Breakout
Significant acreage
commitment (MVC),
dedications, including
acreage dedication, Fee-Based Margin 85-90%
Midstream assets in Permian, Eagle
utilization-based fees
Ford, and Marcellus/Utica
and percent of Commodity Margin 5-7%
Basins
proceeds (POP)
Largest intrastate pipeline Spread Margin² 5-7%
system in the U.S. with
Intrastate Reservation charges
interconnects to TX
Transport & and transport fees
markets, as well as major Diversified customer base includes producers,
Storage based on utilization
consumption areas midstream providers and major integrated
throughout the US global oil companies 14
1 Energy Transfer Operating Segments
2 Spread margin is pipeline basis, cross commodity and time spreadsFULLY INTEGRATED PLATFORM SPANNING THE ENTIRE
MIDSTREAM VALUE CHAIN
Involvement in Major Midstream Themes Across the Best Basins and Logistics Hubs
Franchise Strengths Opportunities
• Access to multiple shale plays, storage facilities and markets • Marcellus natural gas takeaway to the Midwest, Gulf Coast, and
Interstate Natural Canada
• Approximately 95% of revenue from reservation fee contracts
Gas T&S • Well positioned to capitalize on changing market dynamics • Backhaul to LNG exports and new petrochemical demand on Gulf
• Key assets: Rover, PEPL, FGT, Transwestern, Trunkline, Tiger Coast
• Well positioned to capture additional revenues from anticipated
changes in natural gas supply and demand
• Natural gas exports to Mexico
Intrastate Natural • Largest intrastate natural gas pipeline and storage system on the
Gas T&S Gulf Coast • Additional demand from LNG and petrochemical development on
• Key assets: ET Fuel Pipeline, Oasis Pipeline, Houston Pipeline Gulf Coast
System, ETC Katy Pipeline
• More than 40,000 miles of gathering pipelines with 8.2+ Bcf/d of • Gathering and processing build out in Texas and Marcellus/Utica
processing capacity • Synergies with ET downstream assets
Midstream • Majority of projects placed in-service underpinned by long-term, • Significant growth projects ramping up to full capacity over the next
fee-based contracts two years
• World-class integrated platform for processing, transporting,
fractionating, storing and exporting NGLs
• Fastest growing NGLs business in Mont Belvieu • Increased volumes from transporting and fractionating volumes from
• Liquids volumes from our midstream segment culminate at ET’s Permian/Delaware and Midcontinent basins
NGL & Refined
Mont Belvieu / Mariner South / Nederland Gulf Coast Complex • Permian NGL takeaway
Products • Mariner East provides significant Appalachian liquids takeaway • New ethane export opportunities from Gulf Coast
capacity connecting NGL volumes to local, regional and
international markets via Marcus Hook
• Bakken Crude Oil pipeline supported by long-term, fee-based
contracts; expandable with pump station modifications • Permian Express 4 provides Midland & Delaware Basin crude oil
• Significant Permian takeaway abilities takeaway to various markets, including Nederland, TX
Crude Oil • 28 million barrel Nederland crude oil terminal on the Gulf Coast • Permian Express Partners joint venture with ExxonMobil
• HFOTCO provides strategic position on the Houston Ship channel • Ted Collins pipeline expected to enhance access to multiple markets 15
• Bakken crude takeaway to Gulf Coast refineriesSIGNIFICANT MANAGEMENT OWNERSHIP
InsiderInsider Ownership
Ownership vsIndices
vs Major Peers ETWarren
Kelcy CEO Unit Purchases
Unit Purchases
16% 16,000
> 13.5mm units in last 12 months
14.4%
14,000 13,473
14%
12% 12,000
3,969
Insider Ownership %
10% 10,000
Units (000s)
8% 8,000 3,464
6% 6,000
3,040
4% 4,000
1.8% 1,000
2% 2,000
1.1% 500
1,500
0% 0
1
ET S&P 500 S&P 500 Energy
On November 14, 2019 ET’s CFO purchased 18,000 units, valued at ~$201,000
On November 15, 2019 ET’s President & CCO purchased 25,000 units, valued at ~$290,000
On November 20, 2019 ET’s CEO purchased 3,969,224 units, valued at ~$45mm
16
Source: Bloomberg/Company FilingsFORESEE SIGNIFICANT EBITDA GROWTH IN 2019 FROM
COMPLETION OF PROJECT BACKLOG
PROJECT SCOPE IN-SERVICE TIMING
NGL & Refined Products
Mont Belvieu’s Frac VI 150 Mbpd fractionator at Mont Belvieu complex In service Q1 2019
Mont Belvieu’s Frac VII 150 Mbpd fractionator at Mont Belvieu complex Q1 2020
Mont Belvieu’s Frac VIII 150 Mbpd fractionator at Mont Belvieu complex Q2 2021
24-inch, 352 mile expansion to LS Express Pipeline adding 400,000 bbls/d
Lone Star Express Expansion Q4 2020
from Wink, TX to Fort Worth, TX
Mariner East 2 NGLs from Marcellus Shale to MHIC with 275Mbpd capacity upon full completion In service Q4 2018
Mariner East 2X Increase NGL takeaway from the Marcellus to the East Coast w/ storage at Marcus Hook complex Mid-2020
J.C. Nolan Diesel Pipeline(1) 30,000 bbls/d diesel pipeline from Hebert, TX to newly-constructed terminal in Midland, TX In service Q3 2019
Orbit Ethane Export 800,000 bbl refrigerated ethane storage tank and 175,000 bbl/d ethane refrigeration facility and 20-inch
Q4 2020
Terminal(1) ethane pipeline to connect Mont Belvieu to export terminal
Midstream
Plant complete; awaiting
Revolution 110 miles of gas gathering pipeline, cryogenic processing plant, NGL pipelines, and frac facility in PA
pipeline restart
Arrowhead III 200 MMcf/d cryogenic processing plant in Delaware Basin In service Q3 2019
Panther II 200 MMcf/d cryogenic processing plant in Midland Basin Commissioned Dec. 2019
Crude Oil
Bayou Bridge(1) 212 mile crude pipeline connecting Nederland to Lake Charles / St. James, LA In service Q1 2019
Permian Express 4(1) Provides incremental Permian takeaway capacity, with total capacity of 120Mbpd Fully in service Oct. 1, 2019
Ted Collins Pipeline 75 mile, 500 MBbls/d pipeline connecting Nederland Terminal to Houston Ship Channel 2021
Interstate Transport & Storage
Rover Pipeline(1) 712 mile pipeline from Ohio / West Virginia border to Defiance, OH and Dawn, Ontario Fully in service Q4 2018
Intrastate Transport & Storage
Red Bluff Express Pipeline(1) 80-mile pipeline with capacity of at least 1.4 Bcf/d; extension will add an incremental 25 miles of pipeline Fully in service Q3 2019
36-inch natural gas pipeline expansion, providing 160,000 Mmbtu/d of additional capacity from WTX for
NTP Pipeline Expansion(1) In service January 2019
deliveries into Old Ocean
(1) Joint Venture 17CRUDE OIL SEGMENT – BAKKEN PIPELINE PROJECT
Bakken Pipeline System1
• 1,915 mile system connecting Bakken production to ET’s
Nederland terminal on the Gulf Coast
• Placed into service June, 2017
• Recently completed successful open season to bring
current system capacity to 570,000 barrels per day
• Currently conducting an open season to further optimize
system capacity to serve growing demand for additional
takeaway
• Upon completion of the permitting phase, expect to
provide up to ~30,000 barrels per day of early service
capacity by mid-2020, utilizing current system
configuration
Delivery Points
Origin Sites
Bakken Pipeline
Nederland Terminal 18
(1) Ownership is ET: 36.37%, MarEn: 36.75%, PSXP: 25%, XOM: ~2%CRUDE OIL SEGMENT – PERMIAN EXPRESS PIPELINES
Permian Express 1 Permian Express 2
• 16-inch, ~380-mile pipeline
• 20- & 24-inch, ~400-mile pipeline
• 150,000 barrels per day of capacity
• 230,000 barrels per day of capacity
• Provides transportation from Wichita Falls, TX to Nederland,
• Provides transportation from Midland, TX to Nederland, TX
TX
• Contracted under long-term agreements
• Contracted under long-term agreements
Wichita Falls
Ringgold
Colorado City
Lea Station
Corsicana
Loving Station Permian Express Terminal
Permian Express 4
• 24-inch, ~400-mile pipeline
• 120,000 barrels per day of capacity
ET Nederland Terminal
• Provides transportation from Colorado City, TX to Nederland, TX
• Contracted under long-term agreements
Permian Express 3 • Fully in service October 1, 2019
• 20- & 24-inch, ~400-mile pipeline
• 140,000 barrels a day of capacity
• Provides transportation from Midland, TX to Nederland, TX
• Contracted under long-term agreements
1 million+ barrels per day of Permian
crude take-away capacity with the
- Delaware Basin Pipeline addition of Permian Express 4¹
- Permian Express 1
- Permian Express 2, 3, & 4 19
- Nederland Access Pipeline
(1) Includes West Texas Gulf and Amdel pipelinesNGL & REFINED PRODUCTS SEGMENT
– MARINER EAST SYSTEM
Comprehensive Marcellus/Utica Shale solution reaching local,
regional and international markets
Provides NGL transportation from OH / Western PA to the Marcus Hook
Industrial Complex on the East Coast
Supported by long-term, fee-based contracts
Diversified customer base includes producers, midstream providers and
major integrated energy companies
System easily expandable to meet future demand
Mariner East 1 Mariner East 2 Mariner East 2X
• 12-inch / 8-inch pipeline • 20-inch pipeline • 16-inch pipeline
• Currently providing transportation, storage & • Placed into initial service December 2018 • Expected to be in-service mid-2020
terminalling services • NGL transportation, storage & terminalling • Transportation, storage and terminalling
• Approximate capacity of 70,000 barrels per services services for ethane, propane, butane, C3+,
day • Capacity of 275,000 barrels per day upon full natural gasoline, condensate and refined
completion, with ability to expand as needed products
ME2 Pipeline
Existing Third Party Pipeline
ME1 Pipeline
ET Terminal Facilities
Third Party Facility
Pennsylvania Propane Delivery
Marcellus Shale Formation
20NGL & REFINED PRODUCTS SEGMENT
– ORBIT ETHANE EXPORT PROJECT
Orbit Export Pipeline and Facility Orbit Pipeline JV
Orbit Joint Venture with Satellite Petrochemical USA Corp
includes construction of a new ethane export terminal on the
U.S. Gulf Coast to provide ethane to Satellite
At the terminal, Orbit is constructing
• 800,000 barrel refrigerated ethane storage tank
• 175,000 barrel per day ethane refrigeration facility
• 20-inch ethane pipeline originating at our Mont Belvieu
facilities, that will make deliveries to the export terminal,
as well as domestic markets in the region
ET will be the operator of the Orbit assets, provide storage
and marketing services for Satellite, and provide Satellite
with approximately 150,000 barrels per day of ethane under
a long-term, demand-based agreement
Construction of Satellite’s Ethane Receiving Terminal In addition, ET is constructing and will wholly-own the
infrastructure required to supply ethane to the pipeline and to
load ethane onto carriers destined for Satellite’s newly-
constructed ethane crackers in China
Subject to Chinese Government approval, expect all facilities
in the U.S. and China to be ready for commercial service in
the 4th quarter of 2020
21NGL & REFINED PRODUCTS SEGMENT – PIPELINE AND
FRACTIONATION EXPANSION
Lone Star Express Expansion Mont Belvieu Fractionation Expansions
• Total of 6 fractionators at Mont Belvieu
• 24-inch, 352-mile expansion
• 150,000 bbls/d Frac VI went into service in February 2019
• Will add 400 thousand bbls/d of NGL pipeline capacity from
Lone Star’s pipeline system near Wink, Texas to the Lone Star • Frac VII will have a capacity of 150 thousand bbls/d and is expected
Express 30-inch pipeline south of Fort Worth, Texas in-service in Q1 2020
• Expected in-service in Q4 2020 • Announced plans to construct 8th fractionator at Mont Belvieu in
August 2019
• Upon completion of Frac VIII in Q2 2021, ET will be capable of
Ft. Worth, TX fractionating over 1 million barrels per day at Mont Belvieu
Godley
Baden
Hattiesburg
Mont Belvieu Geismar
Fractionation Sea Robin Chalmette
& Storage Sorrento
LaGrange/Chisholm
Plant Complex
Jackson
Kenedy
Fracs Frac VI
IV & V Frac VIII
Frac VII
Existing Lone Star Mariner South Frac I
Frac II
ETP Justice ETP Freedom
ETP-Copano Liberty JV Mont Belvieu Fractionation and Storage
Export De-C2
Lone Star Express Nederland Terminal
Lone Star Express Expansion Plant
Lone Star West Texas Gateway Fractionator Frac III
ETP Spirit Processing Plant
Storage
22GROWING UNIQUE EXPORT CAPABILITIES
HFOTCO Terminal
• ~1,200 acre site on USGC
• 330 acres on Houston Ship Channel
• 18.2 million barrels of storage
• 5 ship docks, 7 barge docks
• Connectivity to Gulf Coast refining
complex
• Pipeline connectivity to all major
basins
• Deepwater marine access
• Rail and truck loading and unloading
Marcus Hook Industrial Complex
• ~800 acre site: inbound and outbound pipeline
along with truck, rail and marine capabilities
• >325 thousand bbls/d of combined NGL and
ethane export capacity, approaching 400 thousand
bbls/d in 2020
Nederland Terminal • ~2 million bbls underground NGL storage; 3 million
bbls above-ground NGL storage; ~1 million bbls
• ~1,200 acre site on USGC crude storage capacity
• ~28 million bbls crude storage capacity; 1.2 million • 4 export docks accommodate VLGC sized vessels
bbls refrigerated propane/butane storage capacity
• Rover, Revolution and Mariner East systems
• 5 ship docks and 4 barge docks accommodate Suez provide long-term growth potential
Max sized ships
• Positioned for further expansion and development
• Rail and truck unloading capabilities of exports, processing, storage and manufacturing
• 800 thousand bbls refrigerated ethane storage under
construction as part of Orbit export project
• Permian and Mont Belvieu expansions provide future
growth opportunities
• Started loading first barge with natural gasoline in July
2019
• Moving forward with 200,000 bbls/d LPG expansion
• Space available for further dock and tank expansion
23MIDSTREAM SEGMENT – PERMIAN BASIN
INFRASTRUCTURE BUILDOUT
ET is nearing capacity in both the Delaware and Midland Basins due to continued producer demand and strong growth
outlook in the Permian
As a result of this demand, ET has continued to build out its Permian infrastructure, and recently completed another
processing plant
Processing Expansions
• 600 MMcf/d of processing capacity online in
Rebel I & II
2016 and 2017
Jal
• 200 MMcf/d Arrowhead II processing plant
Keystone went into service at end of October 2018200
MMcf/d Arrowhead III in the Delaware Basin
Red Bluff/Orla
went into service July 2019 and is expected
Mi Vida Halley Panther to be full by year-end 2020
Bone Springs • 200 MMcf/d Panther II processing plant
Waha commissioned December 2019
Arrowhead
Tippet
Coyanosa Red Bluff Express Pipeline
Pinion
• 1.4 Bcf/d natural gas pipeline through heart of
Mitchell the Delaware Basin
• Connects Orla plant, as well as 3rd party
plants, to Waha/Oasis header
• Went into service May 2018
• 25-mile expansion completed early August
2019
Permian Gathering
Midcon/Panhandle Gathering
Processing Plants
With completion of recent processing expansion, now have ~2.7 Bcf/d of
processing capacity in the Permian Basin 24RENEWED COMMITMENT TO DEVELOP LAKE CHARLES
LNG EXPORT TERMINAL
Export Project
• Executed Project Framework Agreement in
March 2019
• Issued comprehensive commercial tender
package to U.S. and international consortia
to bid for Engineering, Procurement and
Construction contract in December 2019
– Expect to receive commercial bids in
Q2 2020
• Final investment decision (FID) to be
mutually determined
• 50/50 partnership
– Energy Transfer
– Shell US LNG, LLC
Current Terminal Assets • Convert existing LNG import facility to
export terminal
• 152-acre site • Fully permitted
• Two existing deep-water docks to accommodate ships – Utilizes existing infrastructure
up to 215,000 m3 capacity • Strategically located
• Four LNG storage tanks with capacity of 425,000 m3 – Abundant natural gas supply
– Proximity to major pipelines
• Estimated export capacity of ~16.5 million 25
tonnes per yearCORPORATE RESPONSIBILITY
ENVIRONMENTAL, SOCIAL & GOVERNANCE (ESG)
Energy Transfer is dedicated to responsibly
and safely delivering America’s energy
Program Highlights Program Accomplishments
• Committed to pursuing a zero incident culture • 2018 EHSQ Alliance Award for Environmental Stewardship for outstanding
• Overall year-to-year incident rate improvements leadership in environmental management and performance
• Significant use of renewable energy in operations • Achieved TRIR safety incidents and PHMSA incident rate better than industry
benchmark
Environmental, • Comprehensive investigation and risk reduction for reported EHS incidents
• 20% of electrical energy purchased by ET originates from solar or wind sources
Health, and • Compliance tracking and trending through a comprehensive Environmental
• Ducks Unlimited partnership provided $5 MM donation for wetlands restoration in Louisiana
Management System
Safety • Methane reduction program
and Ohio
• Reduced emissions with ET patented Dual-drive compressors used in ozone
• Support pipeline safety and environmental research through membership in non-attainment areas
the Pipeline Research Council International (PRCI) and the Intelligent Pipeline
Integrity Program (iPIPE) • Landfill gas renewable electric power generation via Energy Transfer-owned PEI Power
• $39 MM donated to charitable organizations between 2017 and 2018 • 2018 Forbes America’s Best Large Employers
• 4,000+ volunteer hours by ET employees • 70+ nonprofit organizations served in 2018 – local to our assets
• Comprehensive Stakeholder Engagement Program that promotes proactive • 2019 National Excellence in Construction® Eagle Award in the Mega Projects category
Social outreach and respect for all people • Texas Gulf Coast Blood Center 2019 Corporation of the Year
Responsibility • Committed to an inclusive and diverse workforce • $4.5 MM donated to MD Anderson for cancer research
• Adopted America’s Natural Gas Transporters’ Commitment to Landowners • $2.1 MM in grants to Philabundance, Delaware Valley’s largest hunger relief organization
• On-going emergency response and public awareness outreach programs • $1.2 MM in support provided to American Red Cross
• EHS Compliance and ESG issues oversight by Independent BOD • 2018 Risk Clarity Compliance Survey
Audit Committee • Increased transparency with redesigned and updated website
• Compensation aligned with business strategies – performance based with • Mandatory inclusion and diversity leadership training
retention focus
Corporate • Strong enforcement of integrity and compliance standards
• Annual Senior Management compliance review
• Added resources to oversee and manage compliance
Governance • ET General Council serves as Chief Compliance Officer
• CEO/Executive Team own > 14% of units
• Quarterly compliance certifications from senior management
• Alignment of management/unitholders
Annual Engagement Report now available at www.energytransfer.com
26APPENDIX
CRUDE OIL SEGMENT
Crude Oil Pipelines Crude Oil Acquisition & Marketing
~9,524 miles of crude oil trunk and gathering lines located in the Southwest and Crude truck fleet of approximately 370 trucks
Midwest United States
Purchase crude at the wellhead from ~3,000 producers
Controlling interest in 3 crude oil pipeline systems in bulk from aggregators at major pipeline
• Bakken Pipeline (36.4%) interconnections and trading locations
• Bayou Bridge Pipeline (60%) Marketing crude oil to major pipeline interconnections
• Permian Express Partners (87.7%) and trading locations
Marketing crude oil to major, integrated oil companies,
independent refiners and resellers through various types
of sale and exchange transactions
Storing inventory during contango market conditions
Crude Oil Terminals
Nederland, TX Crude Terminal - ~28 million barrel
capacity
Northeast Crude Terminals - ~3 million barrel capacity
Midland, TX Crude Terminal - ~2 million barrel capacity
ET Opportunities
Delaware Basin Pipeline has ability to expand by 100
mbpd
• Permian Express 4 went into full service October 1, 2019
Midland
Nederland
28NGL & REFINED PRODUCTS SEGMENT
NGL Storage NGL Pipeline Transportation Fractionation
TET Mont Belvieu Storage Hub ~50 million ~4,750 miles of NGL Pipelines 6 Mont Belvieu fractionators (up to 790 Mbpd)
barrels NGL storage throughout Texas and Northeast 40 Mbpd King Ranch, 25 Mbpd Geismar
~7 million barrels of NGL storage at Marcus Announced Lone Star Express 50 Mbpd Houston DeEthanizer and 30 to 50 Mbpd
Hook, Nederland and Inkster expansion Marcus Hook C3+ Frac in service Q4 2017
Hattiesburg Butane Storage ~3 million 352 mile, 24-inch NGL pipeline 150 Mbpd Frac VI placed in-service Q1 2019
barrels In-service Q4 2020 150 Mbpd Frac VII in-service Q1 2020
150 Mbpd Frac VIII in-service Q2 2021
ET NGL & Refined Products Assets Mariner Franchise
~200 Mbpd Mariner South LPG from Mont Belvieu to
Nederland
50 Mbpd Mariner West ethane to Canada
70 Mbpd ME1 ethane and propane to Marcus Hook
275 Mbpd(1) ME2 NGLs to Marcus Hook (Placed into
initial service Q4 2018)
Marcus Total NGL volumes moved through Marcus Hook
Hook
reached as much as ~300 Mbpd for during Q3 2019
ME2X expected in-service mid-2020
Refined Products
~2,200 miles of refined products pipelines in the
northeast, Midwest and southwest US markets
35 refined products marketing terminals with 8 million
barrels storage capacity
Mont Belvieu
Nederland
29
(1) Upon full completionMIDSTREAM SEGMENT
Midstream Asset Map Midstream Highlights
Volume growth in key regions:
• Q3 2019 gathered volumes reach a record 14 million
mmbtu/d, and NGLs produced were ~574,000 bbls/d
Permian Capacity Additions:
• 200 MMcf/d Rebel II processing plant came online in April
2018
PA
• 200 MMcf/d Arrowhead II processing plant came online in
OH MD October 2018
WV • 200 MMcf/d Arrowhead III processing plant came online in
July 2019
• 200 MMcf/d Panther II processing plant in the Midland
Basin commissioned December 2019
Current Processing Capacity
Bcf/d Basins Served
Permian 2.7 Permian, Midland, Delaware
Midcontinent/Panhandle 0.9 Granite Wash, Cleveland
North Texas 0.7 Barnett, Woodford
South Texas 1.9 Eagle Ford
North Louisiana 1.4 Haynesville, Cotton Valley
Southeast Texas 0.4 Eagle Ford, Eagle Bine
Eastern 0.2 Marcellus Utica
30
More than 40,000 miles of gathering pipelines with more than 8.2 Bcf/d of processing capacityINTERSTATE PIPELINE SEGMENT
Interstate Asset Map Interstate Highlights
Our interstate pipelines provide:
Stability
• Approximately 95% of revenue is derived
from fixed reservation fees
Diversity
Rover • Access to multiple shale plays, storage
facilities and markets
Trunkline
Transwestern
Growth Opportunities
Fayetteville Express
• Well positioned to capitalize on changing
supply and demand dynamics
Gulf States Florida Gas Transmission
Tiger • Expect earnings to benefit from placing
Rover in full service
Sea Robin • In addition, expect to receive significant
revenues from backhaul capabilities on
Panhandle and Trunkline
Gulf
PEPL TGC TW FGT SR FEP Tiger MEP States Rover Total
Miles of Pipeline 6,402 2,231 2,614 5,344 785 185 197 512 10 713 18,993
Capacity (Bcf/d) 2.8 0.9 2.1 3.4 2.0 2.0 2.4 1.8 0.1 3.25 20.75
Owned Storage (Bcf) 73.4 13 -- -- -- -- -- -- -- -- 86.4
Ownership 100% 100% 100% 50% 100% 50% 100% 50% 100% 32.6%
~18,990 miles of interstate pipelines with ~21Bcf/d of throughput capacity 31INTRASTATE PIPELINE SEGMENT
Intrastate Asset Map Intrastate Highlights
Continue to expect volumes to Mexico to grow, particularly on
Trans-Pecos and Comanche Trail pipelines
Have seen an increase in 3rd party activity on both of
these pipes, mostly via backhaul services being
provided to the Trans-Pecos header
Well-positioned to capture additional revenues from anticipated
changes in natural gas supply and demand in the next five
years
Red Bluff Express Pipeline connects the Orla Plant, as well as
3rd party plants, to the Waha Oasis Header
Phase I went into service in Q2 2018 and Phase II went
into service in August 2019
In Service
Capacity Pipeline Storage Bi‐Directional Major Connect
(Bcf/d) (Miles) Capacity (Bcf) Capabilities Hubs
• ~ 9,400 miles of intrastate pipelines Trans Pecos & Comanche
Trail Pipelines
2.5 338 NA No
Waha Header,
Mexico Border
Waha, Katy,
• ~21 Bcf/d of throughput capacity ET Fuel Pipeline 5.2 3,150 11.2 Yes
Carthage
Oasis Pipeline 2 750 NA Yes Waha, Katy
HSC, Katy,
Houston Pipeline System 5.3 3,920 52.5 No
Aqua Dulce
ETC Katy Pipeline 2.4 460 NA No Katy
Union Power,
RIGS 2.1 450 NA No
LA Tech
Red Bluff Express 1.4 100 NA No Waha
32NON-GAAP RECONCILIATION
Pro Forma for Mergers
Full Year 2018 2019
2017 Q1 Q2 Q3 Q4 YTD Q1 Q2 Q3 YTD
Net income $ 2,366 $ 489 $ 633 $ 1,391 $ 852 $ 3,365 $ 1,180 $ 1,208 $ 1,161 $ 3,549
(Income) loss from discontinued operations 177 237 26 2 - 265 - - - -
Interest expense, net 1,922 466 510 535 544 2,055 590 578 579 1,747
Impairment losses 1,039 - - - 431 431 50 - 12 62
Income tax expense (benefit) from continuing operations (1,833) (10) 68 (52) (2) 4 126 34 54 214
Depreciation, depletion and amortization 2,554 665 694 750 750 2,859 774 785 784 2,343
Non-cash compensation expense 99 23 32 27 23 105 29 29 27 85
(Gains) losses on interest rate derivatives 37 (52) (20) (45) 70 (47) 74 122 175 371
Unrealized (gains) losses on commodity risk management activities (59) 87 265 (97) (244) 11 (49) 23 (65) (91)
Losses on extinguishments of debt 89 106 - - 6 112 18 - - 18
Inventory valuation adjustments (24) (25) (32) 7 135 85 (93) (4) 26 (71)
Impairment of investment in unconsolidated affiliates 313 - - - - - - - - -
Equity in (earnings) losses of unconsolidated affiliates (144) (79) (92) (87) (86) (344) (65) (77) (82) (224)
Adjusted EBITDA related to unconsolidated affiliates 716 156 168 179 152 655 146 163 161 470
Adjusted EBITDA from discontinued operations 223 (20) (5) - - (25) - - - -
Other, net (155) (41) 15 (33) 38 (21) 17 (37) (46) (66)
Adjusted EBITDA (consolidated) 7,320 2,002 2,262 2,577 2,669 9,510 2,797 2,824 2,786 8,407
Adjusted EBITDA related to unconsolidated affiliates (716) (156) (168) (179) (152) (655) (146) (163) (161) (470)
Distributable Cash Flow from unconsolidated affiliates 431 104 99 109 95 407 93 107 107 307
Interest expense, net (1,958) (468) (510) (535) (544) (2,057) (590) (578) (579) (1,747)
Preferred unitholders' distributions (12) (24) (41) (51) (54) (170) (53) (64) (68) (185)
Current income tax (expense) benefit (39) (468) 27 (24) (7) (472) (28) 7 (2) (23)
Transaction-related income taxes - 480 (10) - - 470 - - - -
Maintenance capital expenditures (479) (91) (126) (156) (137) (510) (92) (170) (178) (440)
Other, net 67 7 7 16 19 49 18 19 19 56
Distributable Cash Flow (consolidated) 4,614 1,386 1,540 1,757 1,889 6,572 1,999 1,982 1,924 5,905
Distributable Cash Flow attributable to Sunoco LP (100%) (449) (84) (99) (147) (115) (445) (97) (101) (133) (331)
Distributions from Sunoco LP 259 41 41 41 43 166 41 41 41 123
Distributable Cash Flow attributable to USAC (100%) - - (46) (47) (55) (148) (55) (54) (55) (164)
Distributions from USAC - - 31 21 21 73 21 21 24 66
Distributable Cash Flow attributable to PennTex Midstream Partners, LP (100%) (19) - - - - - - - - -
Distributions from PennTex Midstream Partners, LP 8 - - - - - - - - -
Distributable Cash Flow attributable to noncontrolling interests in other non-wholly-owned subsidiaries (350) (147) (181) (253) (294) (875) (251) (293) (283) (827)
Distributable Cash Flow attributable to the partners of ET - pro forma for ETO and Sunoco Logistics mergers 4,063 1,196 1,286 1,372 1,489 5,343 1,658 1,596 1,518 4,772
Transaction-related adjustments 57 (1) 14 12 27 52 (2) 5 3 6
Distributable Cash Flow attributable to the partners of ET, as adjusted - pro forma for ETO and Sunoco Logistics mergers $ 4,120 $ 1,195 $ 1,300 $ 1,384 $ 1,516 $ 5,395 $ 1,656 $ 1,601 $ 1,521 $ 4,778
Notes
The closing of the ETO Merger has impacted the Partnership’s calculation of Distributable Cash Flow attributable to partners, as well as the number of ET Common Units outstanding and the amount of distributions to be paid to partners. In order to provide information on a comparable basis for pre-ETO Merger and post-ETO Merger
periods, the Partnership has included certain pro forma information. Pro forma Distributable Cash Flow attributable to partners reflects the following ETO Merger related impacts:
• ETO is reflected as a wholly-owned subsidiary and pro forma Distributable Cash Flow attributable to partners reflects ETO’s consolidated Distributable Cash Flow (less certain other adjustments, as follows).
• Distributions from Sunoco LP and USAC include distributions to both ET and ETO.
• Distributions from PennTex are separately included in Distributable Cash Flow attributable to partners.
• Distributable Cash Flow attributable to noncontrolling interest in our other non-wholly-owned subsidiaries is subtracted from consolidated Distributable Cash Flow to calculate Distributable Cash Flow attributable to partners.
Pro forma distributions to partners include actual distributions to legacy ET partners, as well as pro forma distributions to legacy ETO partners. Pro forma distributions to ETO partners are calculated assuming (i) historical ETO common units converted under the terms of the ETO Merger and (ii) distributions on such converted common
units were paid at the historical rate paid on ET Common Units. Pro forma Common Units outstanding include actual Common Units outstanding, in addition to Common Units assumed to be issued in the ETO Merger, which are based on historical ETO common units converted under the terms of the ETO Merger. For the year ended
December 31, 2017, the calculation of Distributable Cash Flow and the amounts reflected for distributions to partners and common units outstanding also reflect the pro forma impacts of the Sunoco Logistics Merger as though the merger had occurred on January 1, 2017.
Definitions
Adjusted EBITDA, Distributable Cash Flow and distribution coverage ratio are non-GAAP financial measures used by industry analysts, investors, lenders and rating agencies to assess the financial performance and the operating results of ET's fundamental business activities and should not be considered in isolation or as a substitute
for net income, income from operations, cash flows from operating activities, or other GAAP measures. There are material limitations to using measures such as Adjusted EBITDA, Distributable Cash Flow and distribution coverage ratio, including the difficulty associated with using either as the sole measure to compare the results of
one company to another, and the inability to analyze certain significant items that directly affect a company’s net income or loss or cash flows. In addition, our calculations of Adjusted EBITDA, Distributable Cash Flow and distribution coverage ratio may not be consistent with similarly titled measures of other companies and should be
viewed in conjunction with measurements that are computed in accordance with GAAP, such as segment margin, operating income, net income and cash flow from operating activities.
We define Adjusted EBITDA as total partnership earnings before interest, taxes, depreciation, depletion, amortization and other non-cash items, such as non-cash compensation expense, gains and losses on disposals of assets, the allowance for equity funds used during construction, unrealized gains and losses on commodity risk
management activities, inventory valuation adjustments, non-cash impairment charges, losses on extinguishments of debt and other non-operating income or expense items. Adjusted EBITDA reflects amounts for less than wholly-owned subsidiaries based on 100% of the subsidiaries’ results of operations. Adjusted EBITDA reflects
amounts for unconsolidated affiliates based on the same recognition and measurement methods used to record equity in earnings of unconsolidated affiliates. Adjusted EBITDA related to unconsolidated affiliates excludes the same items with respect to the unconsolidated affiliate as those excluded from the calculation of Adjusted
EBITDA, such as interest, taxes, depreciation, depletion, amortization and other non-cash items. Although these amounts are excluded from Adjusted EBITDA related to unconsolidated affiliates, such exclusion should not be understood to imply that we have control over the operations and resulting revenues and expenses of such
affiliates. We do not control our unconsolidated affiliates; therefore, we do not control the earnings or cash flows of such affiliates.
Distributable Cash Flow is used by management to evaluate our overall performance. Our partnership agreement requires us to distribute all available cash, and Distributable Cash Flow is calculated to evaluate our ability to fund distributions through cash generated by our operations. We define Distributable Cash Flow as net income,
adjusted for certain non-cash items, less distributions to preferred unitholders and maintenance capital expenditures. Non-cash items include depreciation, depletion and amortization, non-cash compensation expense, amortization included in interest expense, gains and losses on disposals of assets, the allowance for equity funds
used during construction, unrealized gains and losses on commodity risk management activities, inventory valuation adjustments, non-cash impairment charges, losses on extinguishments of debt and deferred income taxes. For unconsolidated affiliates, Distributable Cash Flow reflects the Partnership’s proportionate share of the
investee’s distributable cash flow.
On a consolidated basis, Distributable Cash Flow includes 100% of the Distributable Cash Flow of ET's consolidated subsidiaries. However, to the extent that noncontrolling interests exist among the Partnership’s subsidiaries, the Distributable Cash Flow generated by our subsidiaries may not be available to be distributed to our
partners. In order to reflect the cash flows available for distributions to the partners of ET, the Partnership has reported Distributable Cash Flow attributable to the partners of ET, which is calculated by adjusting Distributable Cash Flow (consolidated), as follows:
• For subsidiaries with publicly traded equity interests, other than ETO, Distributable Cash Flow (consolidated) includes 100% of Distributable Cash Flow attributable to such subsidiary, and Distributable Cash Flow attributable to the
our partners includes distributions to be received by the parent company with respect to the periods presented.
• For consolidated joint ventures or similar entities, where the noncontrolling interest is not publicly traded, Distributable Cash Flow (consolidated) includes 100% of Distributable Cash Flow attributable to such subsidiaries, but
Distributable Cash Flow attributable to the partners reflects only the amount of Distributable Cash Flow of such subsidiaries that is attributable to our ownership interest.
For Distributable Cash Flow attributable to partners, as adjusted, certain transaction-related and non-recurring expenses that are included in net income are excluded.
33
Distribution coverage ratio for the three months ended September 30, 2019 is calculated as Distributable Cash Flow attributable to partners, as adjusted, divided by distributions expected to be paid to the partners of ET in respect of the third quarter of
2019, which expected distributions total $809 million.ENERGY TRANSFER
U.S. Capital Advisors Midstream Corporate Access Day
January 28, 2020You can also read