New Gold Corporate Presentation - BofA Global Metals, Mining & Steel Virtual Conference
←
→
Page content transcription
If your browser does not render page correctly, please read the page content below
New Gold Corporate Presentation
BofA Global Metals, Mining & Steel Virtual Conference
                    May 18 - 20, 2021
Cautionary Statements
ALL AMOUNTS IN U.S. DOLLARS UNLESS OTHERWISE STATED

CAUTIONARY NOTE REGARDING FORWARD-LOOKING STATEMENTS
Certain information contained in this presentation, including any information relating to New Gold’s future financial or operating performance are “forward-looking”. All statements in
this presentation, other than statements of historical fact, which address events, results, outcomes or developments that New Gold expects to occur are “forward-looking
statements”. Forward-looking statements are statements that are not historical facts and are generally, but not always, identified by the use of forward-looking terminology such as
“plans”, “expects”, “is expected”, “budget”, “scheduled”, “targeted”, “estimates”, “forecasts”, “intends”, “anticipates”, “projects”, “potential”, “believes” or variations of such words and
phrases or statements that certain actions, events or results “may”, “could”, “would”, “should”, “might” or “will be taken”, “occur” or “be achieved” or the negative connotation of
such terms. Forward-looking statements in this presentation include, among others, statements with respect to: the Company’s planned increases in grade at the Rainy River Mine
and New Afton Mine; plans to generate free cash flow; anticipated operational and financial results during the remainder of 2021; the strengthening in the Company’s financial
position in future periods; the Company’s plans regarding diesel based GHG emission reductions; the anticipated effect of the construction of the TAT plant; the Company’s return
to the Phase 2 area of the pit at the Rainy River Mine; the Company’s strip ratio at the Rainy River Mine; and the commencement and ramping up of B3 zone production at the
New Afton Mine.

All forward-looking statements in this presentation are based on the opinions and estimates of management that, while considered reasonable as at the date of this press release
in light of management’s experience and perception of current conditions and expected developments, are inherently subject to important risk factors and uncertainties, many of
which are beyond New Gold’s ability to control or predict. Certain material assumptions regarding such forward-looking statements are discussed in this presentation, New Gold’s
latest annual MD&A, its most recent annual information form and technical reports on the Rainy River Mine and New Afton Mine filed at www.sedar.com and on EDGAR at
www.sec.gov. In addition to, and subject to, such assumptions discussed in more detail elsewhere, the forward-looking statements in this presentation are also subject to the
following assumptions: (1) there being no significant disruptions affecting New Gold’s operations other than as set out herein; (2) political and legal developments in jurisdictions
where New Gold operates, or may in the future operate, being consistent with New Gold’s current expectations; (3) the accuracy of New Gold’s current mineral reserve and
mineral resource estimates; (4) the exchange rate between the Canadian dollar and U.S. dollar, and to a lesser extent, the Mexican Peso, being approximately consistent with
current levels; (5) prices for diesel, natural gas, fuel oil, electricity and other key supplies being approximately consistent with current levels; (6) equipment, labour and materials
costs increasing on a basis consistent with New Gold’s current expectations; (7) arrangements with First Nations and other Aboriginal groups in respect of the New Afton Mine and
Rainy River Mine being consistent with New Gold’s current expectations; (8) all required permits, licenses and authorizations being obtained from the relevant governments and
other relevant stakeholders within the expected timelines; (9) there being no significant disruptions to the Company’s workforce at either the Rainy River or New Afton Mine due to
cases of COVID-19 or any required self-isolation requirements (due, among other things, to cross-border travel to the United States or any other country); (10) the responses of
the relevant governments to the COVID-19 outbreak being sufficient to contain the impact of the COVID-19 outbreak; (11) there being no material disruption to the Company’s
supply chains and workforce that would interfere with the Company’s anticipated course of action at the Rainy River Mine and the systematic ramp-up of operations; (12) the long-
term economic effects of the COVID-19 outbreak not having a material adverse impact on the Company’s operations or liquidity position; and (13) Artemis Gold Inc. being able to
complete the remaining C$50 million cash payment due on August 24, 2021 for the acquisition of the Blackwater project.

                                                                                                                                                                                                2
Cautionary Statements
ALL AMOUNTS IN U.S. DOLLARS UNLESS OTHERWISE STATED

CAUTIONARY NOTE REGARDING FORWARD-LOOKING STATEMENTS
Forward-looking statements are necessarily based on estimates and assumptions that are inherently subject to known and unknown risks, uncertainties and other factors that
may cause actual results, level of activity, performance or achievements to be materially different from those expressed or implied by such forward-looking statements. Such
factors include, without limitation: significant capital requirements and the availability and management of capital resources; additional funding requirements; price volatility in the
spot and forward markets for metals and other commodities; fluctuations in the international currency markets and in the rates of exchange of the currencies of Canada, the
United States and, to a lesser extent, Mexico; volatility in the market price of the Company’s securities; hedging and investment related risks; dependence on the Rainy River
Mine and New Afton Mine; discrepancies between actual and estimated production, between actual and estimated mineral reserves and mineral resources and between actual
and estimated metallurgical recoveries; risks related to early production at the Rainy River Mine, including failure of equipment, machinery, the process circuit or other processes
to perform as designed or intended; risks related to construction, including changing costs and timelines; adequate infrastructure; fluctuation in treatment and refining charges;
changes in national and local government legislation in Canada, the United States and, to a lesser extent, Mexico or any other country in which New Gold currently or may in the
future carry on business; global economic and financial conditions; risks relating to New Gold’s debt and liquidity; the adequacy of internal and disclosure controls; taxation;
impairment; conflicts of interest; risks relating to climate change; controls, regulations and political or economic developments in the countries in which New Gold does or may
carry on business; the speculative nature of mineral exploration and development, including the risks of obtaining and maintaining the validity and enforceability of the necessary
licenses and permits and complying with the permitting requirements of each jurisdiction in which New Gold operates; the lack of certainty with respect to foreign legal systems,
which may not be immune from the influence of political pressure, corruption or other factors that are inconsistent with the rule of law; the uncertainties inherent to current and
future legal challenges New Gold is or may become a party to; risks relating to proposed acquisitions and the integration thereof; information systems security threats; diminishing
quantities or grades of mineral reserves and mineral resources; competition; loss of, or inability to attract, key employees; rising costs of labour, supplies, fuel and equipment;
actual results of current exploration or reclamation activities; uncertainties inherent to mining economic studies; changes in project parameters as plans continue to be refined;
accidents; labour disputes; defective title to mineral claims or property or contests over claims to mineral properties; unexpected delays and costs inherent to consulting and
accommodating rights of Indigenous groups; risks, uncertainties and unanticipated delays associated with obtaining and maintaining necessary licenses, permits and
authorizations and complying with permitting requirements; disruptions to the Company’s workforce at either the Rainy River Mine or the New Afton Mine, or both, due to cases of
COVID-19 or any required self-isolation (due to cross-border travel, exposure to a case of COVID-19 or otherwise); the responses of the relevant governments to the COVID-19
outbreak not being sufficient to contain the impact of the COVID-19 outbreak; disruptions to the Company’s supply chain and workforce due to the COVID-19 outbreak; an
economic recession or downturn as a result of the COVID-19 outbreak that materially adversely affects the Company’s operations or liquidity position; there being further
shutdowns at the Rainy River or New Afton Mines; the Company not being able to complete its construction projects at the Rainy River Mine or the New Afton Mines on the
anticipated timeline or at all; the Company not being able to complete the exploration drilling program to be launched at the Rainy River Mine and Cherry Creek on the anticipated
timeline or at all; Artemis Gold Inc. not being able to make the remaining C$50 million cash payment due in connection with its acquisition of the Blackwater Project on August 24,
2021. In addition, there are risks and hazards associated with the business of mineral exploration, development and mining, including environmental events and hazards,
industrial accidents, unusual or unexpected formations, pressures, cave-ins, flooding and gold bullion losses (and the risk of inadequate insurance or inability to obtain insurance
to cover these risks) as well as “Risk Factors” included in New Gold’s most recent annual information form, MD&A and other disclosure documents filed on and available at
www.sedar.com and on EDGAR at www.sec.gov. Forward looking statements are not guarantees of future performance, and actual results and future events could materially
differ from those anticipated in such statements. All forward-looking statements contained in this presentation are qualified by these cautionary statements. New Gold expressly
disclaims any intention or obligation to update or revise any forward-looking statements whether as a result of new information, events or otherwise, except in accordance with
applicable securities laws.

For further information on the Company’s response to COVID-19, please refer to: https://www.newgold.com/covid-19/

                                                                                                                                                                                           3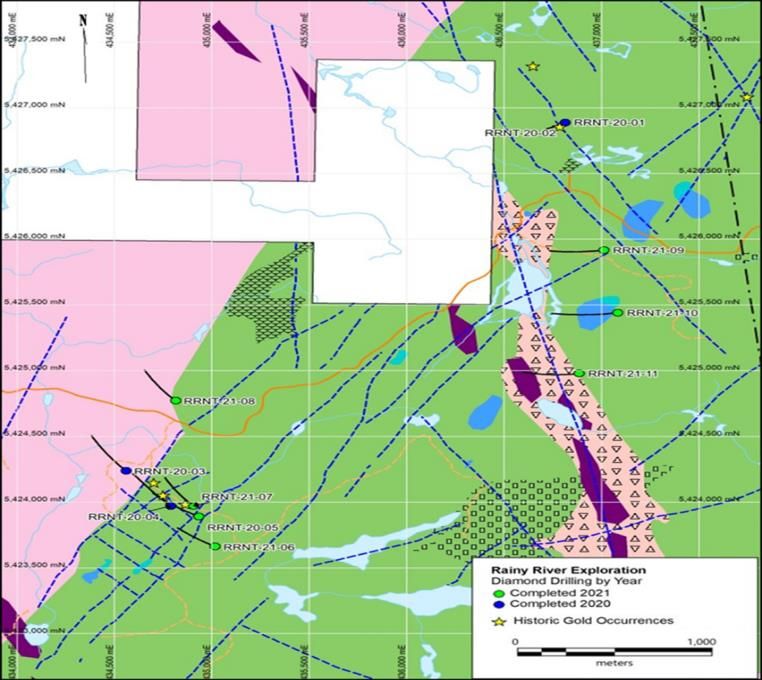
Committed to Sustainability and ESG
        Environment                               Social                          Governance
        Environment
Water Management                      Indigenous Relations                • Board committee oversees
                                                                            technical operations and
• Operations are focused on           • New Gold works with
                                                                            sustainability
  strengthening water standards         community members to identify
  and processes and our                 opportunities for economic        • CEO accountable for
  approach to water stewardship         benefit through training,           sustainability
                                        business development and
Tailings Management                                                       • Director of Sustainability
                                        procurement opportunities           responsible for strategy
• New Gold supports and
                                      Community Investment                  development and working with
  adheres to the Mining
                                                                            sites
  Association of Canada’s Toward      • Actively support Indigenous
  Sustainable Mining Tailings           education programs for K-12       • Site GMs, Community & Enviro
  Management Protocol and is a          and post secondary                  Managers responsible for site-
  member of the Canadian Dam            opportunities for Indigenous        based activities, regulators and
  Association                           communities                         priorities
Climate Action                        Community Engagement                • Community and enviro teams
                                                                            implement plans
• Reducing our carbon footprint       • Operations seek to identify and
  by focusing on energy                 review community of interest on
  efficiency, reducing fossil fuel      an annual basis to ensure
  consumption, and reducing             engagement is happening with
  electricity generated from fossil     all relevant stakeholders
  fuels

New Gold is committed to minimizing environmental impacts, creating long term value
  for stakeholders, and prioritizing the health, safety and well-being of our people
                                                                                                               4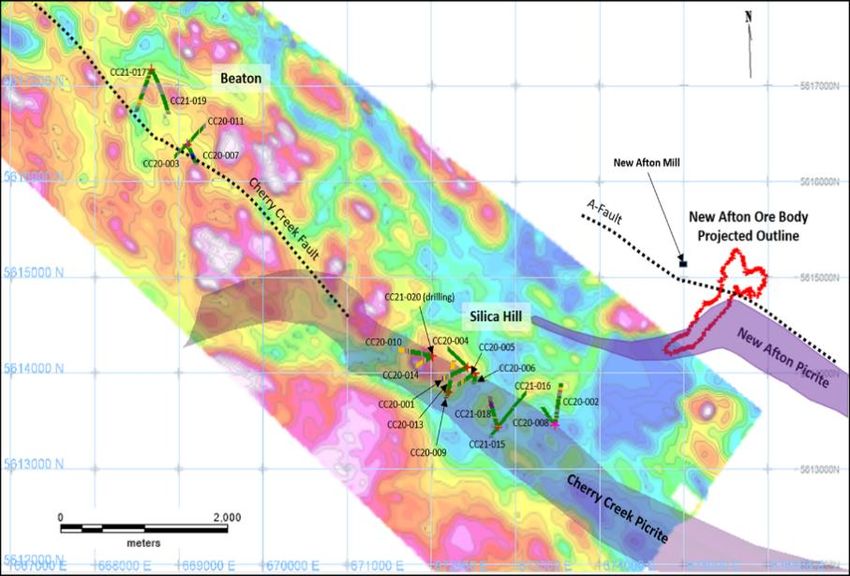
Building a Canadian-Focused Multi-Asset Company
Average Annual Production of ~400 koz gold and 66 Mlbs copper (2021 - 2025)
                                                                                                                     Rainy River Mine: Ontario, Canada
                                                                                                                     • Transitioned to sustainable FCF for 2021 and over LoM;
                                                                                                                       Life of Mine FCF of ~$1.1B1
                                                                   Rainy River Gold Mine                             • Enhanced underground mine scenarios
 Blackwater Gold Stream                                                                                                 • Intrepid Zone: ~120koz in current mine life
                                                                           Open pit &
          8% Gold Stream                                                underground mine                                • Ongoing potential expansion of mine life beyond
                                                                                                                            2028
                                                                                                                     • Exploration drilling launched in Q4, follow-up drilling
                                                                                                                       program to continue in H2 focused on gold bearing
                                                                                                                       mineralization within defined shear zones, along strike
                                                                                                                       and at depth
                                                                                                                     New Afton Mine: B.C., Canada
                                                                                                                     • Integrated B3/C-Zone optimization; mine life to 2030
                                                                                                                     • B3/C-Zone self-funded approach; B3 permit expected
                                                                                                                       in Q2 2021, production to commence and ramp-up
                                                                                                                       over the year
          New Afton
       Copper/Gold Mine                                                                                              • Life of Mine FCF of ~$1.2B1,2; highly leveraged to
                                                                                                                       copper price
       Underground block
          cave mine                                                                                                  • Completed first pass reconnaissance drilling within
                                                                                                                       Cherry Creek trend, underground drilling program has
                                                                                                                       commenced focused on three priority targets
                                                                                                                     Blackwater (Artemis Gold): 8% Gold Stream
        Cerro San Pedro                                                                                              • 8% stream on first 280,000 gold oz. declining to 4%
                                                                                                                       on remaining production and 6% equity position
           In Reclamation
                                                                                                                     • PFS released Aug/20: Total gold production of
                                                                                                                       ~8moz. with ~450koz delivered to New Gold
1.   Assuming $1,550/oz. gold, $3.00/lb copper and $17.50/oz. silver USD/CAD exchange rate of C$1.30 to US$1.00.
2.   Excludes Ontario Teachers’ Pension Plan’s New Afton free cash flow interest (refer to Feb. 25, 2020 press release).                                                         5
2021 Consolidated Guidance

                                                                        2021 Operational and Cost Guidance

 Operational Estimates                                                                       Rainy River                               New Afton                     Consolidated Guidance

 Gold Produced (ounces)                                                                  270,000 – 290,000                         52,000 – 62,000                        322,000 – 352,000

 Copper Produced (Mlbs)                                                                              -                                   56 - 66                                  56 - 66

 Gold Eq. Produced (ounces)1                                                             275,000 – 295,000                       165,000 – 195,000                        440,000 – 490,000

 Cash Costs per gold eq. ounce1,2                                                             $715 - $795                            $930 - $1,010                            $810 - $890

 Corporate G&A per gold eq. ounce1                                                                    -                                       -                                 $45 - $55

 All-in Sustaining Costs per gold eq. ounce1,2                                             $1,125 - $1,225                         $1,225 - $1,325                          $1,230 - $1,330

 Capital Investment & Exploration Expense Estimates                                           Rainy River                              New Afton                     Consolidated Guidance

 Sustaining capital & sustaining leases ($M)2                                                 $95 - $125                                $40 - $60                             $135 - $185

 Growth capital ($M)2                                                                          $10 - $15                               $80 - $110                              $90 - $125

 Exploration expense ($M)                                                                          ~$5                                     ~$12                                    ~$17

New Gold Consolidated Operational Estimates
In 2021, the Company will continue to report production on a gold eq. basis as well as on a per-metal basis. Cash costs and AISC will be reported on a per gold eq.
ounce basis. Guidance has been prepared assuming $1,800 per gold ounce, $3.50 per pound of copper and $25 per silver ounce and a foreign exchange rate of
1.28 Canadian dollars to the US dollar.

1.   Gold eq. ounces includes approximately 538,000 to 568,000 ounces of silver at Rainy River and approximately 250,000 to 270,000 ounces of silver at New Afton.
2.   These are non-GAAP financial performance measures with no standardized meaning under IFRS and therefore may not be comparable to similar measures provided by other issuers. For more information on   6
     these non-GAAP financial performance measures, refer to the “Non-GAAP Financial Performance Measures” section of this presentation.
Reinvesting In Our Future

       Legend

Producer                                           Harte Gold
Developer / Explorer
Greenfield                                 Stage:        Producer
                                           Investment:   14.9% (equity)
                                           Market cap:   C$155mm
                                           Location:     Ontario
        Artemis Gold
                                                   Angus Gold
Stage:            Developer
Investment:       6% (equity)              Stage:        Greenfield
                  8% (gold stream)         Investment:   9.9% (equity)
Market cap:       C$700mm                  Market cap:   C$20mm
Location:         British Columbia         Location:     Ontario

                                                    Burin Gold
                                           Stage:        Greenfield
                                           Investment:   9.9% (equity)
                                           Market cap:   Private
                                           Location:     Newfoundland

    Talisker Resources                         Northern Superior
Stage:             Explorer                Stage:        Greenfield
Investment:        14.9% (equity)          Investment:   9.9% (equity)
Market cap:        C$75mm                  Market cap:   C$75mm
Location:          British Columbia        Location:     Ontario/Quebec

       Broadening Our Canadian Exploration Platform
                                                                          7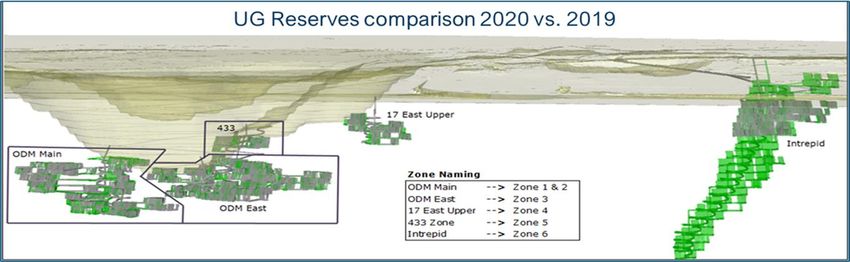
Capital Resources and Strong Liquidity Position

$131M                                                                                                                                                      New Gold Debt Structure

Cash and cash                                                                                                                                              Face Value
                                                                                                                                                                         Maturity     Interest Rate
equivalents                                                                                                                                                   ($M)

                                                                                                                                        Revolving Credit                             LIBOR + 2.75% -
                                                                                                                                                              $3501      Oct. 2023

                                                         $435M
                                                                                                                                        Facility                                         4.25%

                                                                                                                                        Senior Unsecured
                                                                                                                                                              $100       May 2025       6.375%
                                                                                                                                        Notes

                                                                                                                                        Senior Unsecured
                                                           Liquidity                                                                    Notes
                                                                                                                                                              $400       July 2027       7.50%

                                                           Position                                                                                        2021 Copper Put Option

$304M                                                                                                                                          Term               Quantity              Floor

Undrawn credit
                                                                                                                                        April 2021 -
facility(1)                                                                                                                             September 2021
                                                                                                                                                               1,700 t/month           $3.10/lb

     C$50 million in additional liquidity from the Blackwater sale due in
                                 August 2021
1.   $46 million of $350 million facility is currently used for Letters of Credit related to mine closure costs as of March 31, 2021.                                                                  8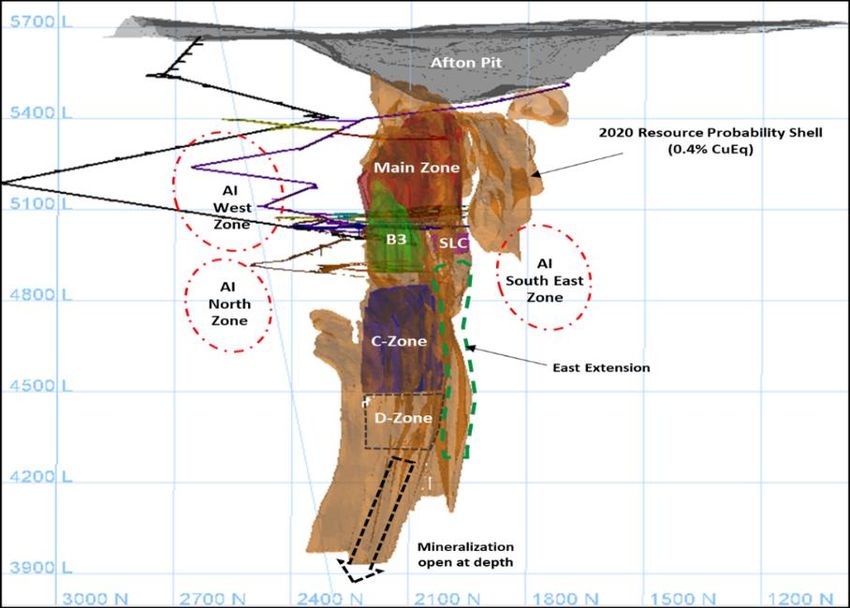
Five Year Financial and Operating Outlook (2021-2025)
30% increase in production; significant decrease to AISC

Operational Improvements                                                                                                            Financial Outlook
• Diligent focus on operational and cost optimization to drive                                                                      • Balance sheet restructured
  production growth and improved margins                                                                                            • ~$1.5B1,2 in FCF3 generated over the next
• ~30% increase in production (2021 – 2025) to ~575k gold                                                                             five years
  eq. oz. – ramp-up of Rainy River and production from the                                                                          • Ample liquidity and FCF generation to
  New Afton C-Zone                                                                                                                    redeem the 2025 and 2027 Senior Notes
• Major capital programs at Rainy River complete; New Afton                                                                           at maturity
  C-Zone development based on a self-funded approach                                                                                • Highly leveraged to the copper price; +/-
• Consistent year-over-year reduction in consolidated AISC3                                                                           $0.15/lb generates additional estimated
  to ~$800 per gold eq. oz. by 2025                                                                                                   FCF of +/- ~$40M1,2

1. Based on the March 2020 NI 43-101 technical report filed on SEDAR and assuming (US$1,800/oz Au, US$3.25/lb Cu, US$20/oz Ag and a USD/CAD rate of 1.30).
2. Free cash flow defined as operating cash flow, less capital expenditures, lease payments, streaming and royalty costs, including the Ontario Teachers’ Pension Plan free cash flow interest.   9
3. Refer to the “Non-GAAP Performance Measures” section of this presentation.
Rainy River: Q1 2021 Highlights
First quarter delivered to plan – Planned increases in grade through the year
      Open pit and underground operation located in                                                         Production                                                  Q1 2021                Q1 2020
                    northern Ontario                                                                        Gold production (oz)                                          54,656                 50,381
                                                                                                                                         1
                                                                                                            Gold eq. production (oz)                                      56,513                 51,106
                                                                                                            Operating Costs                                             Q1 2021                Q1 2020
                                                                                                            Total cash costs per gold eq. oz2                              1,006                 1,060
                                                                                                            AISC per gold eq. oz2                                          1,586                 1,755
                                                                                                            Capital & Exploration ($M)                                  Q1 2021                Q1 2020
                                                                                                                                                          2
                                                                                                            Sustaining capital & sustaining leases                         29.3                   35.7
                                                                                                                             2
                                                                                                            Growth capital                                                  1.3                    0.1
                                                                                                            Exploration                                                     0.4                    0.2

 • Open pit mine achieved 150,767 tpd, in-line with                                                        • Intrepid zone decline development advanced
   2021 target ~151,000 tpd                                                                                  650m – production planned for late-2022
 • Mill averaged 26,301 tpd                                                                                • Exploration program on North-East Trend
 • Waste stripping strategically prioritized during                                                            • Completed 11 diamond core holes totaling
   winter months                                                                                                 4,023 metres
 • Average gold grade of 0.80 g/t – planned                                                                    • Follow-up drilling program to continue in H2
   increases in second half of year                                                                              focused on gold bearing mineralization within
 • Gold recovery of 89%                                                                                          defined shear zones, along strike and at depth

    Focus remains on further operational and cost optimizations and the continued
conversion of underground reserves for inclusion in an optimized underground mine plan
1.   Gold eq. ounces for Rainy River in Q1 2021 includes 133,730 ounces of silver converted to a gold eq. based on a ratio of $1,800 per gold ounce and $25.00 per silver ounce used for 2021 guidance estimates.
2.   Refer to the "Non-GAAP Financial Performance Measures" section of this presentation.                                                                                                                           10
Rainy River: Underground Mine
Focused on Optimizing the Underground Plan and Extending the Mine Life
Legend
2019 Reserves
2020 Reserves
• Almost all areas of Intrepid Zone now in
Reserves; Intrepid Zone production expected to
begin in late 2022
• Underground delineation/exploration program
planned at Intrepid in Q4 2021
• Potential to convert significant M&I Resources*
to Reserves
• Economic study underway to potentially consider
a standalone underground mine plan that would
unlock additional value and extend the life of
mine beyond 2028
*See the 2020 Mineral Reserves and Mineral Resources at the end of this presentation. 11Rainy River Exploration Program
North East Trend Target
• Reconnaissance drilling program completed on two
broader geochemical and geophysical anomalous areas
within the ~15km structural corridor
• Launched in December 2020, have completed 11
diamond core holes totalling 4,023m
• Narrow intervals of low-grade gold mineralization has
been intercepted; complete assay results received for 7
holes with the best intercepts to date in:
• Hole RRNT-20-02: 0.42 g/t gold over 3.0 metres
• Hole RRNT-20-04: 0.61 g/t gold over 3.8
metres, including 1.79 g/t gold over 0.7 metres
• Additional exploration activities planned in 2021 to
support follow-up program, inclusive of soil geochemical
survey, geological mapping and trenching to validate
initial interpretation
12New Afton: Q1 2021 Highlights
The mine continues to safely and sequentially ramp-up operations
Production Q1 2021 Q1 2020
Copper/gold block cave operation located in B.C.
Gold production (oz) 11,994 16,409
Copper production (Mlbs) 13.8 18.5
Gold eq. production (oz)1 39,512 52,329
Operating Costs Q1 2021 Q1 2020
Operating expense per gold eq. oz 1,046 655
Total cash costs per gold eq. oz2 1,153 762
AISC per gold eq. oz2 1,388 1,033
Capital & Exploration ($M) Q1 2021 Q1 2020
Sustaining capital & sustaining leases2 8.5 13.3
Growth capital2 17.2 10.8
Exploration 1.4 1.5
• Underground mine averaged 11,395 tpd, • Completed first pass reconnaissance drilling
~16,200 tpd in March, near pre-incident rates within Cherry Creek trend including 20 diamond
• Mill averaged 13,564 tpd – current surface core holes totaling 10,518 metres, preliminary
stockpiles supplementing tonnes mined interpretation defines patterns similar to New
Afton deposit, follow-up program to focus on
• Gold – average grade of 0.39 at 79% recovery
deeper targets within the trend
• Copper – average grade at 0.64% at 80%
recovery • Underground drilling program has commenced
focused on three priority targets
• C-Zone development advanced ~820 metres –
project remains on track for H2 2023 start-up
Focus remains on launching B3 production, advancing C-Zone development,
and following up on key exploration targets
1. Gold eq. ounces for New Afton in Q1 2021 includes 13.8 million pounds of copper and 53,494 ounces of silver converted to a gold eq. based on a ratio of $1,800 per gold ounce, $3.50 per copper pound and
$25.00 per silver ounce used for 2021 guidance estimates.
2. Refer to the "Non-GAAP Financial Performance Measures" section of this presentation. 13New Afton Exploration Program
• Completed first pass reconnaissance drilling
program within the 12 km Cherry Creek trend,
characterized by coincidental geochemical and
geophysical anomalies and located at ~3 km from
the New Afton mill
• The program launched in late October 2020 has
been completed with a total 10,518 m in 20
diamond core holes
• Preliminary geological, mineralization and
alteration interpretation defines patterns that halo
gold-copper mineralized porphyry systems similar
to the New Afton deposit
• Follow-up drilling program to focus on deeper
targets within the interpreted alteration domains
• Soil geochemical surveys and IP surveys are also
planned on the broader New Afton claims block to
define additional targets for drill testing
• Underground drilling program commenced in
March 2021 to explore for additional mineralization
within the New Afton deposit footprint
14Key Catalysts
Continued ramp-up of New Afton Mine
B3 permit expected in Q2
B3 production commences and ramps-up
Rainy River transitions to free cash flow
Optimized Rainy River underground plan
15New Gold: A Profitable Path Forward
Optimized balance sheet Rainy River Optimizing C-Zone
repositions New Gold for positioned for development to
growth profitable operations support a self-funded
with underground approach
upside
Growing production and Organic growth potential
expanded margins through strategic
to maximize free cash exploration programs
flow
16Appendix
Rainy River Annual Operational Outlook
                  Rainy River Mine 2021 Operational and Cost Guidance                         The Rainy River Mine begins 2021 with both the open pit
 2021 Operational Estimates                                             2021 Guidance         mine and mill operating at productivity levels that are in-
 Gold Produced (ounces)                                               270,000 - 290,000       line with the estimates in the Rainy River NI 43-101, with
 Gold Eq. Produced      (ounces)1                                     275,000 - 295,000
                                                                                              the objective of potentially outperforming those estimates.
 Cash Costs per gold eq. ounce       1,2                                  $715 - $795
 All-in Sustaining Costs per gold eq. ounce1,2                          $1,125 - $1,225       Open Pit Mining
 2021 Capital Investment & Exploration Expense                          2021 Guidance         •   H1: lower grades/higher strip ratio with Phase 3
 Sustaining Capital & Sustaining Leases ($M)2                               $95 - $125
                                                                                                  stripping
 Growth Capital ($M)2                                                       $10 - $15         •   H2: higher grades/lower strip ratio as mining returns to
 Exploration Expense ($M)                                                      ~$5                Phase 2 HS, 433 and ODM zones
 1.
 2.
       Gold eq. ounces includes approximately 538,000 to 568,000 ounces of silver.
       Refer to the “Non-GAAP Measures” section of this presentation.
                                                                                              •   Annual avg. mining rate of ~ 151,000 tpd
                                                                                              Mill Facility
                        2021 Rainy River Key Performance Indicators                           •   Mill expected to average 26,300 tpd; near permit limit
Key Performance Indicators                                           2021   Estimates1
                                                                                              •   Higher recovery rate of 90-92%
Open pit tonnes mined per day (ore and waste)                      150,000 - 152,000
Strip ratio (waste:ore)                                                     ~2.70             Underground Mining – Intrepid Zone
Tonnes milled per calendar day                                       26,200 - 26,400
                                                                                              •   Decline development accessed the first ore level in Q1
Gold grade milled (g/t)                                                 0.98 - 1.02           •   Focus on refinement of the long-hole mining
Gold recovery (%)                                                         90 - 92                 methodology and block model
1.    These estimates are based on assumptions that, while considered reasonable by the
      Company as at the date of this presentation in light of management’s experience and     Capital Projects
      perception of current conditions and expected developments, are inherently subject to
      significant business, economic and competitive uncertainties and contingencies. See     •   Sustaining capital reduced as all deferred construction
      Cautionary Note Regarding Forward-Looking Statements for more details.                      projects have been completed
Guidance has been prepared assuming $1,800 per gold ounce and $25 per                         •   Growth capital increased as Intrepid Zone
silver ounce and a foreign exchange rate of 1.28 Canadian dollars to the US                       development brought forward
dollar.

                                                                                                                                                             18
Rainy River Mine – KPI Dashboard
Tonnes mined per day Tonnes milled per Gold Grade milled (g/t) Gold Recovery (%)
(ore and waste) calendar day
2019 2020 Q1 2021 2021 2019 2020 Q1 2021 2021 2019 2020 Q1 2021 2021 2019 2020 Q1 2021 2021
Target Target Target Target
Open Pit Mining Costs2 2020 Unit Costs ($/t)1,2
($/tonne) mined Mill & G&A
2019 2020 Q1 2021 2021 2019 2020 Q1 2021 2021
Target 3 Target 3
1. 2020 unit costs are inclusive of the Canada Emergency Wage Subsidy.
2. Open pit mine unit costs presented on a per tonne mined basis, mill and G&A unit costs presented on per tonne processed basis.
3. Based on the March 2020 NI 43-101 technical report filed on SEDAR and assuming (US$1,800/oz Au, US$3.25/lb Cu, US$20/oz Ag and a USD/CAD rate of 1.30). 19New Afton Annual Operational Outlook
New Afton Mine Annual Operational and Cost Guidance The New Afton mine plan for the year was adjusted following the
tragic mud-rush event that occurred on February 2, 2021.
2021 Operational Estimates 2021 Guidance Underground mining activities are safely and sequentially
Gold Produced (ounces) 52,000 - 62,000 ramping-up as we continue to maintain our focus on the health,
Copper Produced (Mlbs) 56 - 66 safety and wellbeing of our people.
Gold Eq. Produced (ounces)1 165,000 -195,000
2021 Mine Plan
Cash Costs per gold eq. ounce 1,2 $930 - $1,010
All-in Sustaining Costs per gold eq. ounce1,2 $1,225 - $1,325 Recovery Level: Limited to remote mucking activities; ~10-15% of
total tonnes mined for the year; expected to be fully exhausted in
Capital & Exploration Expense Estimates 2021 Guidance
2
2022
Sustaining Capital & Sustaining Leases ($M) $40 - $60
Growth Capital ($M) 2 $80 - $110 Lift 1: Mining will ramp-up during the first quarter and return to pre-
Exploration Expense ($M) ~$12 incident mining rates in the second quarter and maintained over
1. Gold eq. ounces includes approximately 250,000 to 270,000 ounces of silver. the balance of the year; ~60-65% of the total tonnes mined for the
2. For more information on these non-GAAP financial performance measures, refer to the “Non-GAAP year
Financial Performance Measures” section of this presentation.
B3: Upon receipt of the Mines Act Permit, ore extraction will ramp-
New Afton Annual Key Performance Indicators up over the year as more draw points are accessible; ~20-25% of
Key Performance Indicators 2021 Estimates1 the total tonnes mined for the year
Tonnes mined per day 12,250 - 13,000
Tonnes milled per day 14,250 - 14,550
Mill Facility
Gold grade milled (g/t) 0.40 - 0.45 • As a result of lower tonnes mined during the year, a portion of
Gold recovery (%) 78 - 80 current surface stockpiles will be processed to supplement mill
Copper grade milled (%) 0.65 - 0.70
feed
Copper recovery (%) 75 - 80 Capital Projects
B3 Development ~1,350
C-Zone Development ~4,000
• Sustaining capital focused on advancing B3 development
1 These estimates are based on assumptions that, while considered reasonable by the Company as at
the date of this presentation in light of management’s experience and perception of current conditions
• Growth capital primarily related to C-Zone development, TAT
and expected developments, are inherently subject to significant business, economic and competitive construction and stabilization of the historic and current tailings
uncertainties and contingencies. See Cautionary Note Regarding Forward-Looking Statements for facilities
more details.
Guidance has been prepared assuming $1,800 per gold ounce, $3.50 per
pound of copper and $25 per silver ounce and a foreign exchange rate of
1.28 Canadian dollars to the US dollar. 20New Afton Mine – KPI Dashboard
Tonnes mined per day Tonnes milled per Gold Grade milled (g/t) Gold Recovery (%)
(ore and waste) calendar day
2019 2020 Q1 2021 2021 2019 2020 Q1 2021 2021 2019 2020 Q1 2021 2021 2019 2020 Q1 2021 2021
Target Target Target Target
Copper grade milled (%) Copper recovery (%) UG Mine Unit Costs1 Unit Cost1 Performance
($/t mined) Mill & G&A ($/t)
2019 2020 Q1 2021 2021 2019 2020 Q1 2021 2021 2019 2020 Q1 2021 2021 3 2019 2020 Q1 2021 2021
3
Target Target Target Target
1. 2020 unit costs are inclusive of the Canada Emergency Wage Subsidy.
2. Underground mine unit costs presented on a per tonne mined basis, mill and G&A unit costs presented on per tonne processed basis.
3. Based on the March 2020 NI 43-101 technical report filed on SEDAR and assuming (US$1,800/oz Au, US$3.25/lb Cu, US$20/oz Ag and a USD/CAD rate of 1.30). 21New Afton Mud-Rush Incident
• Mud-rush was localized underneath the
Lift 1 cave in the isolated recovery area
• No interaction with B3 and C-Zone
• Surface operations not impacted
Lift 1
• Underground operations currently
ramping-up
• B3 and C-Zone development advancing B3
as planned
• Mill facility is currently processing mined
ore and surface stockpiles
C-Zone
• Annual operational estimates were
released on Feb. 18, 2021
Underground mining activities continue to safely and sequentially ramp-up as focus
remains on the health, safety and well-being of our people and the people in the
communities in which we operate
22Life of Mine Highlights
Rainy River NI 43-101 Technical Report – 2021 LOM
LoM1 Sensitivity2
Total gold eq. production (k oz) 2,130 2,129
Avg. annual gold eq. production (k oz) 294 294
Cash costs per gold eq. oz. ($/oz) $639 $656
AISC per gold eq. oz. ($/oz) $907 $923
Sustaining capital ($M) 3 $467 $467
3
Growth capital ($M) $52 $52
Cumulative total cash flow ($M)4 $1,099 $1,536
5%
After-tax NPV $906 $1,275
1.Assuming $1,550 per gold oz, $17.50 per silver oz and a foreign exchange rate of 1.30 C$ to 1 US$.
2.Assumes US$1,800/oz Au, US$20/oz Ag and a USD/CAD rate of 1.30.
3.Sustaining and Growth Capital spend excludes working capital movements.
4.LOM value includes a negative cash flow of $68 million post 2028 primarily for closure activities.
Totals may not compute exactly due to rounding.
New Afton NI 43-101 Technical Report – 2021 LOM
LoM1 Sensitivity2
Avg. annual gold eq. production (k oz)* 232 223
Cash costs per gold eq. oz. ($/oz)* $697 $731
AISC per gold eq. oz. ($/oz)* $757 $792
Sustaining capital ($M) 3
$114 $114
Growth capital ($M) 3
$365 $365
Cumulative total cash flow ($M)4,5 $1,174 $1,387
After-tax NPV 5% $864 $1,040
1. Assuming $1,550/oz gold, $17.50/oz silver, $3.00/lb copper and a USD/CAD rate of 1.30 C$ to 1 US$.
2. US$1,800/oz gold, US$3.25/lb copper, US$20/oz silver and a USD/CAD rate of 1.30.
3. Sustaining and Growth Capital spend excludes working capital movement.
4. LOM value includes a negative cash flow of $9M primarily for closure activities offset by salvage values.
5. Life of Mine free cash flow estimates are exclusive of Ontario Teachers’ Pension Plan free cash flow interest (refer to Feb. 25, 2020 press release).
23COVID-19 Business Plan
Employee and community health and safety
• The health and safety of our employees and communities remains number one priority
• Full compliance with government and health agency recommendations
• Restricted access to sites; travel restrictions; enhanced sanitization practices; self-isolation;
community-based consultations; optimized plans for transport and employee accommodation; social
distancing; work from home options (see www.newgold.com/covid-19/ for further details)
Supply chain continuity
• Supply chain secure for key items; no disruptions to supply anticipated
• Standard inventory items on hand; required quantities being maintained
• Long-lead items remain on schedule
Business continuity plans and Rapid Response Team fully mobilized
• Scenario-based business continuity plans developed
• COVID-19 rapid testing devices procured for use at Rainy River and daily testing is underway
• Rainy River operations restarted on April 3, 2020 utilizing the local workforce; gradual and safe
reintroduction of non-local workforce nearing completion and operations returned to full capacity in
early Q3 2020
• New Afton implemented wearable contact tracing technology and is in the process of implementing
rapid testing as outlined by the Government of British Columbia
24Ontario Teachers' Pension Plan Transaction Terms
Completed $300M strategic partnership with Ontario Teachers’ Pension Plan
• New Gold has entered into a strategic partnership with Ontario Teachers’ Pension Plan (“Ontario
Teachers’”) with the following terms (the “Transaction”):
• First 4 years – 46% Free Cash Flow Interest (“FCF Interest”) in New Afton
Transaction
• After 4 years – Ontario Teachers’ has an option (“Conversion Option”) to convert into a 46% joint
venture in New Afton (“JV Interest”); if Ontario Teachers’ does not convert into the JV Interest, the FCF
Interest in New Afton will be reduced to 42.5% (“Reduced FCF Interest”)
• During the exercise period of the Conversion Option, New Gold holds an overriding buyback option to
Buyback Option repurchase 100% of Ontario Teachers’ interest in New Afton at the greater of an agreed upon IRR or the
fair market value at that time
• New Gold has retained 100% of the exploration claims outside of the New Afton mining permit. Ontario
Exploration Claims Teachers’ has an option to acquire its proportionate share of these claims upon conversion into the JV
Interest
Key Transfer • New Gold and Ontario Teachers' hold a mutual right of first offer for the life of the agreements
Rights
• As a strategic partner, Ontario Teachers’ has certain governance rights
Governance • Upon conversion into the JV Interest, Ontario Teachers’ will receive customary joint venture
governance rights
25Divestment of Blackwater
Key Transaction Terms Transaction Highlights
⚫ Definitive agreement to sell New Gold’s 100% interest in • Marks another milestone in the re-positioning
Transaction
Blackwater to Artemis Gold Inc. of New Gold to create a Canadian-focused,
diversified intermediate gold producer
⚫ C$190 million in cash, comprised of C$140 million in
cash upon closing of the Transaction and C$50 million • Further enhances balance sheet with upfront
in cash payable twelve months following closing of the cash payment, providing additional flexibility
Transaction
Consideration
⚫ C$20 million in Artemis shares (6.6%) terms and price • Retains exposure to Blackwater project via an
consistent with Artemis’ Transaction Financing equity position and gold stream on production
⚫ Gold stream on 8% gold produced from Blackwater,
reducing to 4% of gold production once approximately • Blackwater becomes a core focus of a
280,000 ounces of gold have been delivered, with a dedicated management team with a proven
transfer price equal to 35% of the spot gold price
track record that can unlock its potential
⚫ Artemis funded the initial cash payment through a • Surfacing value for Blackwater now positions
Transaction
combination of cash on hand and an equity financing New Gold to transition to the next phase of the
Financing
that is fully backstopped by Artemis insiders Company’s growth plan
Closing ⚫ Closed August 24, 2020
26Mineral Reserves and Resources
Mineral Reserves Statement as at December 31, 2020
Proven & Probable Metal grade Contained metal
Tonnes Gold Silver Copper Gold Silver Copper
000s g/t g/t % koz koz Mlbs
RAINY RIVER
Direct processing Reserves
Open Pit
Proven 14,333 1.22 2.5 - 563 1,137 -
Probable 27,273 1.18 2.7 - 1,036 2,381 -
Open Pit P&P (direct proc.) 41,606 1.20 2.6 - 1,599 3,518 -
Stockpile DPO
Proven 599 0.73 3.2 - 14 62 -
Probable - - - - - - -
Total Stockpile 599 0.73 3.2 - 14 62 -
Low grade reserves
Open Pit
Proven 5,401 0.35 2.0 - 61 346 -
Probable 12,924 0.35 2.3 - 144 967 -
Open Pit P&P (low grade) 18,325 0.35 2.2 - 205 1,313 -
Stockpile
Proven 7,987 0.42 1.8 - 108 464 -
Probable - - - - - - -
Open Pit P&P (stockpile) 7,987 0.42 1.8 - 108 464
Open Pit P&P (Direct proc. & Low grade) 68,517 0.87 2.4 - 1,926 5,357 -
Underground
Proven - - - - - - -
Probable 5,399 3.87 10.3 - 672 1,795 -
Underground P&P (direct proc.) 5,399 3.87 10.3 - 672 1,795 -
Combined Direct proc. & Low grade
Proven 28,320 0.82 2.2 - 746 2,009 -
Probable 45,596 1.26 3.5 - 1,852 5,143 -
Total Rainy River P&P 73,916 1.09 3.0 - 2,598 7,152 -
27Mineral Reserves and Resources (Cont’d)
Mineral Reserves Statement as at December 31, 2020
Proven & Probable Metal grade Contained metal
Tonnes Gold Silver Copper Gold Silver Copper
000s g/t g/t % koz koz Mlbs
NEW AFTON
A&B Zones
Proven - - - - - - -
Probable 8,047 0.49 2.3 0.69 126 593 122
B3 Zone
Proven - - - - - - -
Probable 9,325 0.63 1.4 0.74 189 418 152
C-Zone
Proven - - - - - - -
Probable 29,252 0.68 1.8 0.75 643 1,659 484
Total New Afton P&P 46,624 0.64 1.8 0.74 958 2,670 758
TOTAL PROVEN & PROBABLE RESERVES 3,556 9,822 758
Notes to the Mineral Reserve and Mineral Resource estimates are provided below.
28Mineral Reserves and Resources (Cont’d)
Mineral Reserves Statement as at December 31, 2020
Measured & Indicated (Exclusive of Metal grade Contained metal
Reserves)
Tonnes Gold Silver Copper Gold Silver Copper
000s g/t g/t % koz. koz. Mlbs
RAINY RIVER
Direct processing resources
Open Pit
Measured 592 1.51 2.4 - 29 46 -
Indicated 3,696 1.11 3.1 - 132 370 -
Open Pit M&I (direct proc.) 4,288 1.17 3.0 - 161 416 -
Underground
Measured - - - - - - -
Indicated 18,494 3.06 7.7 - 1,818 4,563 -
Underground M&I (direct proc.) 18,494 3.06 7.7 - 1,818 4,563 -
Low grade MineralResources
Open Pit
Measured 236 0.34 1.9 - 3 15 -
Indicated 2,054 0.35 2.0 - 23 131 -
Open Pit M&I (low grade) 2,290 0.35 2.0 - 26 146 -
Combined M&I
Measured 828 1.20 2.3 - 32 61 -
Indicated 24,244 2.53 6.5 - 1,973 5,064 -
Total Rainy River M&I 25,072 2.49 6.4 - 2,005 5,125 -
29Mineral Reserves and Resources (Cont’d)
Mineral Reserves Statement as at December 31, 2020
Measured & Indicated (Exclusive ofReserves) Metal grade Contained metal
Tonnes Gold Silver Copper Gold Silver Copper
000s g/t g/t % koz. koz. Mlbs
NEW AFTON
A&B Zones
Measured 19,920 0.52 1.4 0.72 335 867 314
Indicated 11,691 0.36 2.5 0.56 135 933 145
A&B Zone M&I 31,612 0.46 1.8 0.66 470 1,800 460
C-Zone
Measured 6,156 0.82 2.1 0.99 163 417 135
Indicated 16,398 0.68 2.4 0.82 356 1,261 295
C-Zone M&I 22,554 0.72 2.3 0.86 519 1,678 430
HW Lens
Measured - - - - - - -
Indicated 12,333 0.49 1.9 0.42 194 769 114
HW Lens M&I 12,333 0.49 1.9 0.42 194 769 114
Combined M&I
Measured 26,076 0.59 1.5 0.78 497 1,281 449
Indicated 40,422 0.53 2.3 0.62 684 2,965 554
Total New Afton M&I 66,498 0.55 2.0 0.68 1,182 4,246 1,003
TOTAL M&I RESOURCES 3,187 9,371 1,003
Notes to the Mineral Reserve and Mineral Resource estimates are provided below.
30Mineral Reserves and Resources (Cont’d)
Mineral Reserves Statement as at December 31, 2020
Inferred Metal grade Contained metal
Tonnes Gold Silver Copper Gold Silver Copper
000s g/t g/t % koz. koz. Mlbs
RAINY RIVER
Direct processing
Open Pit 797 0.97 2.4 - 25 82 -
Underground 1,599 3.30 2.8 - 170 146 -
Total Direct Processing 2,396 2.52 2.7 - 195 228 -
Low grade Resources
Open Pit 681 0.35 1.4 - 8 30 -
Rainy River Inferred 3,077 2.05 2.6 - 203 258 -
NEW AFTON
A&B Zones 7,671 0.34 1.3 0.33 83 311 56
C-Zone 10,640 0.37 1.0 0.37 126 349 87
HW Lens 3 0.49 0.6 0.19 - - -
New Afton Inferred 18,313 0.36 1.1 0.36 209 659 143
TOTAL INFERRED 412 917 143
Notes to the Mineral Reserve and Mineral Resource estimates are provided below.
31Notes to Mineral Reserve and Resource Estimates
1. New Gold’s Mineral Reserves and Mineral Resources have been estimated in accordance with the CIM standards, which are incorporated by reference in NI 43-101.
2. All Mineral Reserve and Mineral Resource estimates for New Gold’s properties and projects are effective December 31, 2020 and do not reflect any events
subsequent to that date.
3. New Gold’s year-end 2020 Mineral Reserves and Mineral Resources have been estimated based on the following metal prices and foreign exchange (FX) rate criteria:
Gold ($/ounce) Silver ($/ounce) Copper ($/pound) FX (CAD:USD)
Mineral Reserves $1,400 $18.00 $2.75 1.30
Mineral Resources $1,500 $20.00 $3.00 1.30
4. Lower cut-offs for the Company’s Mineral Reserves and Mineral Resources are outlined in the following table:
Mineral Reserves Mineral Resources
Mineral Property
Lower Cut-off Lower Cut-off
O/P direct processing: 0.46 – 0.49 g/t AuEq 0.44 – 0.45 g/t AuEq
Rainy River O/P low grade material: 0.30 g/t AuEq 0.30 g/t AuEq
U/G direct processing: 1.93 g/t AuEq 1.70 g/t AuEq
Main Zone – B1 & B2 Blocks: USD$ 21.00/t
New Afton All Resources 0.40% CuEq
B3 Block & C-Zone USD$ 24.00/t
5. New Gold reports its measured and indicated mineral resources exclusive of mineral reserves. Measured and indicated mineral resources that are not mineral reserves do
not have demonstrated economic viability. Inferred mineral resources have a greater amount of uncertainty as to their existence and technical feasibility, do not have
demonstrated economic viability, and are likewise exclusive of mineral reserves. Numbers may not add due to rounding.
6. Mineral resources are classified as measured, indicated and inferred based on relative levels of confidence in their estimation and on technical and economic parameters
consistent with the methods considered to be most suitable to their potential commercial extraction. The designators ‘open pit’ and ‘underground’ may be used to indicate
the envisioned mining method for different portions of a resource. Similarly, the designators ‘direct processing’ and ‘lower grade material’ may be applied to differentiate
material envisioned to be mined and processed directly from material to be mined and stored separately for future processing. Mineral reserves and mineral resources
may be materially affected by environmental, permitting, legal, title, taxation, sociopolitical, marketing and other risks and relevant issues. Additional details regarding
mineral reserve and mineral resource estimation, classification, reporting parameters, key assumptions and associated risks for each of New Gold’s material properties
are provided in the respective NI 43-101 Technical Reports, which are available at www.sedar.com.
7. The preparation of New Gold's consolidated statement and estimation of mineral reserves has been completed under the oversight and review of Mr. Andrew Croal, Director of
Technical Services for the Company. Mr. Croal is a Professional Engineer and member of the Association of Professional Engineers Ontario. Preparation of New Gold’s
consolidated statement and estimation of mineral resources has been completed under the oversight and review of Mr. Michele Della Libera, Director, Exploration for the
Company. Mr. Della Libera is a Professional Geoscientist and member of the Association of Professional Geoscientist of Ontario and of the Engineers and Geoscientist of British
Columbia. Mr. Croal and Mr. Della Libera are "Qualified Persons" as defined by NI 43-101.
32Endnotes
CAUTIONARY NOTE TO U.S. READERS CONCERNING ESTIMATES OF MINERAL RESERVES
AND MINERAL RESOURCES
Disclosure regarding Mineral Reserve and Mineral Resource estimates included in this PRESENTATION was prepared in accordance with Canadian National Instrument 43-101
Standards of Disclosure for Mineral Projects (“NI 43-101”). NI 43-101 is a rule developed by the Canadian Securities Administrators that establishes standards for all public disclosure
an issuer makes of scientific and technical information concerning mineral projects. NI 43-101 differs significantly from the disclosure requirements of the United States Securities and
Exchange Commission (“SEC”) generally applicable to U.S. companies. For example, the terms “mineral reserve”, “proven mineral reserve”, “probable mineral reserve”, “mineral
resource”, “measured mineral resource”, “indicated mineral resource” and “inferred mineral resource” are defined in NI 43-101. These definitions differ from the definitions in the
disclosure requirements promulgated by the SEC. Accordingly, information contained in this Presentation will not be comparable to similar information made public by U.S. companies
reporting pursuant to SEC disclosure requirements.
TECHNICAL INFORMATION
The scientific and technical information in this presentation under the heading “Exploration” and the tables and figures has been reviewed and approved by Mr. Michele Della Libera,
Director Exploration of New Gold. All other scientific and technical information contained in this presentation has been reviewed and approved by Eric Vinet, Senior Vice President,
Operations of New Gold. Mr. Della Libera is a Professional Geoscientist (P.Geo.) and Practicing Member of the Association of Professional Geoscientists of Ontario and the Engineers
and Geoscientist of British Columbia. Mr. Vinet is a Professional Engineer and member of the Ordre des ingénieurs du Québec. Mr. Della Libera and Mr. Vinet are "Qualified Persons"
for the purposes of National Instrument 43-101 – Standards of Disclosure for Mineral Projects.With respect to the scientific and technical information in this presentation under the
heading “Exploration Update” and the tables and figures below, Mr. Della Libera has verified the data disclosed, including the exploration, analytical and testing data underlying the
information. His verification included a review of the applicable assay databases and reviews of the assay certificates. No limitations were imposed on Mr. Della Libera’s verification
process. New Gold maintains a Quality Assurance / Quality Control (“QA/QC”) program at its New Afton mine operation using industry best practices and is consistent with the QA/QC
protocols in use at all of the company’s exploration and development projects. Key elements of New Gold’s QA/QC program include chain of custody of samples, regular insertion of
certified reference standards and blanks, and duplicate check assays. Drill core at New Afton is sampled commonly at 2 metres intervals or less than 2 metres upon geological
changes, halved and shipped in sealed bags to Actlabs Laboratories in Kamloops, British Columbia. Drill core at Rainy River is sampled at a regular 1.5 metres interval or less than 1.5
metres upon geological changes, halved and shipped in sealed bags to Actlabs Laboratories in Thunder Bay, Ontario. Additional information regarding the company’s quality
assurance processes is set out in the New Afton and Rainy River NI 43-101 Technical Reports available at www.sedar.com.
For additional technical information on New Gold’s material properties, including a detailed breakdown of Mineral Reserves and Mineral Resources by category, as well as key
assumptions, parameters and risks, refer to New Gold’s Annual Information Form for the year ended December 31, 2020.
33Non-GAAP Measures
NON-GAAP FINANCIAL PERFORMANCE MEASURES
(1) CASH COSTS AND TOTAL CASH COSTS PER GOLD EQ. OUNCE
“Total cash costs per gold equivalent ounce” is a non-GAAP financial performance measure that is a common financial performance measure in the gold mining industry but does not have
any standardized meaning under IFRS and therefore may not be comparable to similar measures presented by other issuers. New Gold reports total cash costs on a sales basis and not on
a production basis. The Company believes that, in addition to conventional measures prepared in accordance with IFRS, certain investors use this information to evaluate the Company’s
performance and ability to generate liquidity through operating cash flow to fund future capital expenditures and working capital needs. New Gold believes that this measure, along with
sales, is a key indicator of the Company’s ability to generate operating earnings and cash flow from its mining operations.
This measure is intended to provide additional information only and should not be considered in isolation or as a substitute for measures of performance prepared in accordance with IFRS.
This measure is not necessarily indicative of cash generated from operations under IFRS or operating costs presented under IFRS.
Total cash cost figures are calculated in accordance with a standard developed by The Gold Institute, a worldwide association of suppliers of gold and gold products that ceased operations
in 2002. Adoption of the standard is voluntary and the cost measures presented may not be comparable to other similarly titled measures of other companies. Total cash costs include mine
site operating costs such as mining, processing and administration costs, royalties, production taxes, but are exclusive of amortization, reclamation, capital and exploration costs. Total cash
costs are then divided by gold equivalent ounces sold to arrive at the total cash costs per equivalent ounce sold.
In addition to gold the Company produces copper and silver. Gold equivalent ounces of copper and silver produced or sold in a quarter are computed using a consistent ratio of copper and
silver prices to the gold price and multiplying this ratio by the pounds of copper and silver ounces produced or sold during that quarter.
Notwithstanding the impact of copper and silver sales, as the Company is focused on gold production, New Gold aims to assess the economic results of its operations in relation to gold,
which is the primary driver of New Gold’s business. New Gold believes this metric is of interest to its investors, who invest in the Company primarily as a gold mining business. To determine
the relevant costs associated with gold equivalent ounces, New Gold believes it is appropriate to reflect all operating costs incurred in its operations.
(2) ALL-IN SUSTAINING COSTS PER GOLD EQ. OUNCE
“All-in sustaining costs per gold equivalent ounce” is a non-GAAP financial performance measure that does not have any standardized meaning under IFRS and therefore may not be
comparable to similar measures presented by other issuers. New Gold calculates "all-in sustaining costs per gold equivalent ounce" based on guidance announced by the World Gold
Council (“WGC”) in September 2013. The WGC is a non-profit association of the world’s leading gold mining companies established in 1987 to promote the use of gold to industry,
consumers and investors. The WGC is not a regulatory body and does not have the authority to develop accounting standards or disclosure requirements. The WGC has worked with its
member companies to develop a measure that expands on IFRS measures to provide visibility into the economics of a gold mining company. Current IFRS measures used in the gold
industry, such as operating expenses, do not capture all of the expenditures incurred to discover, develop and sustain gold production. New Gold believes that "all-in sustaining costs per
gold equivalent ounce" provides further transparency into costs associated with producing gold and will assist analysts, investors, and other stakeholders of the Company in assessing its
operating performance, its ability to generate free cash flow from current operations and its overall value. In addition, the Compensation Committee of the Board of Directors uses "all-in
sustaining costs", together with other measures, in its Company scorecard to set incentive compensation goals and assess performance.
"All-in sustaining costs per gold equivalent ounce" is intended to provide additional information only and does not have any standardized meaning under IFRS and may not be comparable
to similar measures presented by other mining companies. It should not be considered in isolation or as a substitute for measures of performance prepared in accordance with IFRS. The
measure is not necessarily indicative of cash flow from operations under IFRS or operating costs presented under IFRS.
New Gold defines "all-in sustaining costs per gold equivalent ounce" as the sum of total cash costs, net capital expenditures that are sustaining in nature, corporate general and
administrative costs, capitalized and expensed exploration that is sustaining in nature, lease payments that are sustaining in nature, and environmental reclamation costs, all divided by the
total gold equivalent ounces sold to arrive at a per ounce figure. The “Sustaining Capital Expenditure Reconciliation” table below reconciles New Gold’s sustaining capital to its cash flow
statement. The definition of sustaining versus non-sustaining is similarly applied to capitalized and expensed exploration costs and lease payments. Exploration costs and lease payments
to develop new operations or that relate to major projects at existing operations where these projects are expected to materially increase production are classified as non-sustaining and are
excluded. Gold equivalent ounces of copper and silver produced or sold in a quarter are computed using a consistent ratio of copper and silver prices to the gold price and multiplying this
ratio by the pounds of copper and silver ounces produced or sold during that quarter.
34You can also read