Population Dynamics and the Demographic Dividend Potential of Eastern and Southern Africa: A Primer - November 2019 - Unicef
←
→
Page content transcription
If your browser does not render page correctly, please read the page content below
Population Dynamics and the
Demographic Dividend Potential of
  Eastern and Southern Africa:
            A Primer

              November 2019

UNICEF Eastern and Southern Africa Regional
    Office Social Policy Working Paper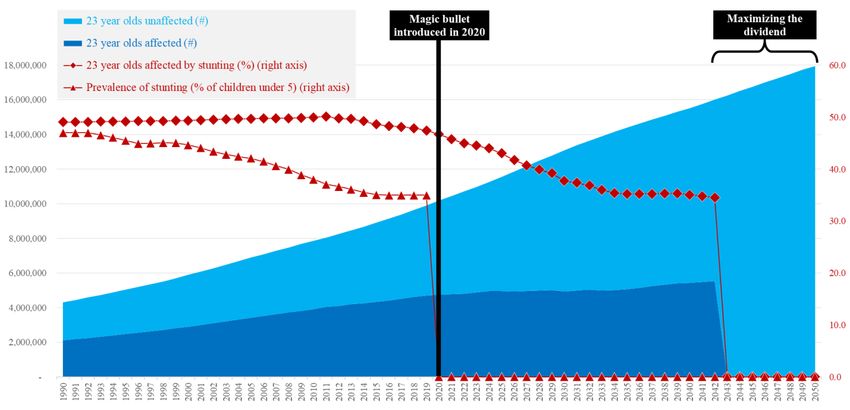
Population Dynamics and the Demographic Dividend Potential of Eastern and Southern Africa: A
Primer

© United Nations Children’s Fund (UNICEF), Eastern and Southern Africa Regional Office (ESARO)
United Nations Complex, Gigiri, PO Box 44145 – 00100, Nairobi, Kenya
November 2019

This is a working document. It has been prepared to facilitate the exchange of knowledge and to stimulate
discussion.

The findings, interpretations and conclusions expressed in this document are those of the author and do
not necessarily reflect the policies or views of UNICEF or the United Nations.

The text has not been edited to official publication standards, and UNICEF accepts no responsibility for
errors.

The designations in this document do not imply an opinion on the legal status of any country or territory, or
of its authorities, or the delimitation of frontiers.
Acknowledgements

This working paper was written by Matthew Cummins (Social Policy Regional Adviser, UNICEF
ESARO). The author would like to thank Debora Camaione (Public Finance Fellow, UNICEF
ESARO) for the outstanding research support and assistance and also for leading the
development of the accompanying Africa Population Dynamics Tool. The author is also grateful
to the following persons for their comments on earlier drafts: Bo Viktor Nylund (Deputy Regional
Director, UNICEF ESARO), Bob Muchabaiwa (Public Finance Specialist, UNICEF ESARO) and
Natalie Fol (Regional Adviser Communication for Development, UNICEF ESARO).
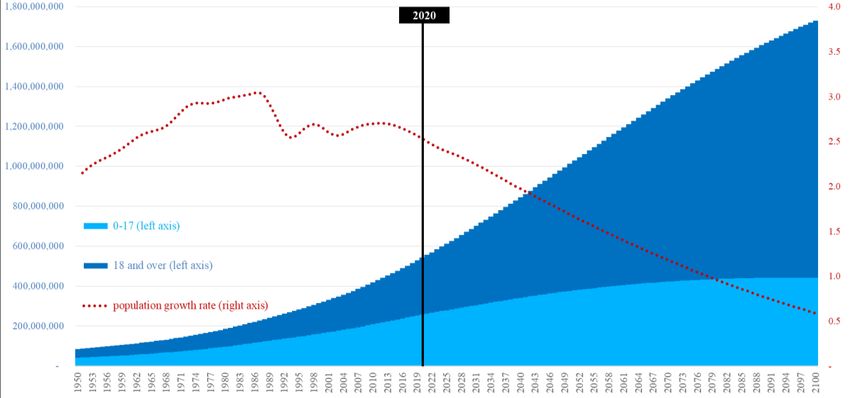
Table of Contents

Executive Summary ................................................................................................................... 3

1.    Introduction ......................................................................................................................... 5
2.    The demographic transition and population boom ............................................................... 6
3.    Increasing labour supply: The foundation of the dividend ...................................................11
4.    Savings and investment: Driving the dividend ....................................................................15
5.    Human capital: Maximizing the dividend ............................................................................16
6.    Public investment decisions: The future of the dividend .....................................................20
7.    Concluding thoughts ..........................................................................................................23

References ...............................................................................................................................25

Annex 1. Classical demographic transition model: Snapshot of ESA ........................................26
Annex 2. Demographic fast facts about ESA .............................................................................27
Annex 3. Demographic fast facts about Africa ...........................................................................28

                                                                     1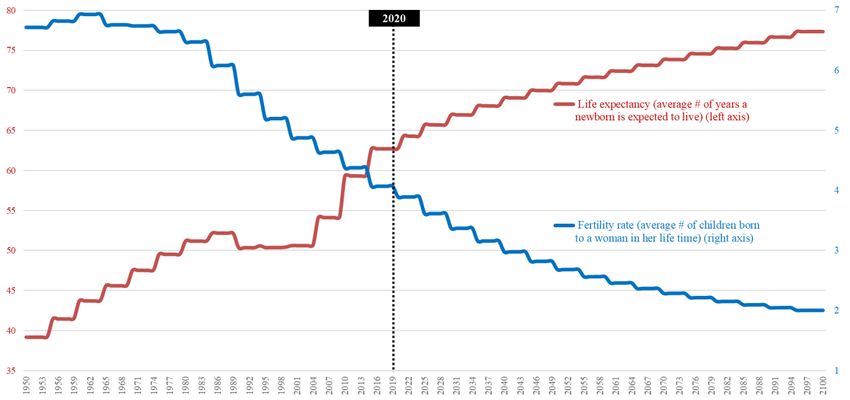
List of Figures

Figure 1. Birth and death rate projections in ESA, 1950-2100 .................................................... 6

Figure 2. Fertility rate and life expectancy projections in ESA, 1950-2100 ................................. 7

Figure 3. Population and growth rate projections in ESA, 1950-2100 ......................................... 7

Figure 4. Birth projections in ESA, 1950-2100 ............................................................................ 8

Figure 5. Population pyramid projections in ESA, in 1990, 2020 and 2050................................. 8

Figure 6. Rural and urban population projections in ESA in 1990, 2020 and 2050 ..................... 9

Figure 7. Population projections in select cities in ESA, 2005, 2020 and 2035 ........................... 9

Figure 8. New working age population projections in ESA, 1950-2100 ......................................11

Figure 9. Dependent and working age population projections in ESA, 1950-2100.....................12

Figure 10. Young and old dependency ratio projections in ESA, 1950-2100 .............................13

Figure 11. New working and non-working age population projections in ESA, 1950-2100.........13

Figure 12. Working and dependent age population projections in ESA, 1950-2100 ..................14

Figure 13. Savings rates and dependency ratios by income groups, 1970-2018 .......................15

Figure 14. Human capital outcomes of 23 year olds in ESA, 2020 ............................................17

Figure 15. Human capital outcomes of 23 year olds in ESA, 1990-2050 ...................................17

Figure 16. Education completion rates under a magic bullet scenario in ESA, 1990-2050 ........19

Figure 17. Stunting affects under a magic bullet scenario in ESA, 1990-2050...........................19

Figure 18. Human capital expenditure in select ESA countries, 2015........................................21

Figure 19. Per capita human capital expenditure in select ESA countries, 2015 .......................21

Figure 20. Government expenditure by level of education in select ESA countries, 2017..........22

Figure 21. Economic classification of human capital expenditure in ESA, 2017 ........................22

Figure 22. Human capital budget credibility rates in ESA, 2017 ................................................22

                                                             2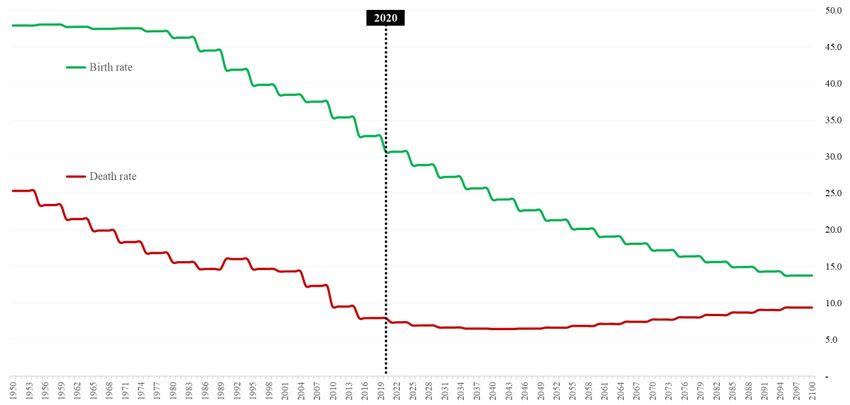
Executive Summary

This working paper provides an overview of demographic trends in the Eastern and
Southern Africa (ESA) region and the potential to capitalize on the demographic dividend.
The demographic dividend is the time-bound opportunity to catalyze economic growth and poverty
reduction as the working age population expands due to falling birth and death rates. Using a
variety of variables, the paper describes the ongoing population boom in ESA alongside the move
toward higher levels of savings and investment that can propel the production of more goods and
services and hence greater income and poverty reduction opportunities. It then assesses the
recent and likely trajectory of human capital in the region – a key determinant of the dividend –
while also modelling an alternative policy path whereby governments immediately ensure that
each newborn reaches her or his full physical and cognitive development while also completing
secondary school. The paper concludes by highlighting the importance of greater and better
investment in human capital sectors, which will determine how much of the remaining dividend
can be salvaged, while also discussing how UNICEF and development partners can help. The
paper is accompanied by an Excel tool that replicates the analyses presented at country, regional
and continental levels.

Driven by shrinking family sizes and longer lives, ESA is in the midst of a demographic
transition. This ongoing structural change is dramatically increasing the total population. Home
to just 85 million persons in the 1950s, the region will boast more than 1 billion people by 2050
and 1.5 billion in 2080 – more than China and India today. One of the immediate consequences
of the fast population growth is many more children. While around 17 million babies will be born
in 2020 – up from 12 million in 2000 – this number will surpass 22 million in the 2040s and plateau
at 25 million per year toward the end of the century. Urbanization is also moving at lightning
speed. From around one in three at present, the region will be predominately urban by 2050. In
the process, many capital and secondary cities will see their populations more than double in just
15 years, with places like Addis Ababa, Dar es Salaam and Luanda housing more than 1,000 new
residents every day between 2020 and 2035.

The demographic transition also means that the labour supply is quickly expanding, which
presents an opportunity for accelerated economic growth and poverty reduction. The
working age population (15-64 year olds) doubled between 1995 and 2020 in ESA, growing from
150 to more than 300 million. It further is projected to double again by 2047 – reaching more than
600 million persons – and to surpass the one billion mark in the 2080s. Enhanced economic
growth can occur when the workforce outpaces the dependent age population (children and
elderly), which is the foundation of the demographic dividend. This process is measured by the
dependency ratio, which divides the total number of dependents by potential workers in the
population. In ESA, the ratio currently stands at 78% (i.e. there are about 10 workers for every 8
dependents). This is expected to decline to 54% in the 2060s (i.e. about 10 workers for every 5
dependents) after which it will reverse course propelled by the increasing number of elderly
persons. However, given that the rate of change will slow substantially in the 2050s, the region
has about 30 years to benefit from demographic tailwinds. During this period, historical evidence
shows a strong relationship between falling dependency ratios and rising savings rates, which
facilitate greater investment and hence economic growth potential.

                                                3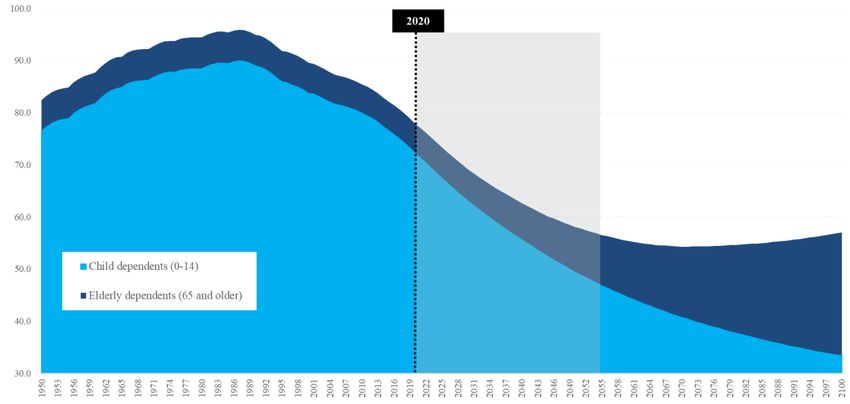
Human capital is the basis for maximizing the demographic dividend yet remains elusive
in ESA. More workers and physical capital will not suffice. The quality and productive capacity of
the workforce will ultimately dictate how much additional economic output can be achieved.
However, applying human capital proxies to a cross-section of the young labour force reveals an
unsettling situation. In 2020, for instance, only one out of every three young workers (as measured
by a cross-section of the workforce – a cohort of 23 year olds) have completed some form of
secondary education, while close to half were affected by stunting during childhood. The lack of
basic literacy and numeracy skills combined with under-developed bodies and brains indicates
that most workers remain far from reaching their productive or innovative potential.

Human capital trends will likely improve over time, but the pace of change will not be fast
enough to fully exploit the demographic dividend. Based on projections, more than half of 23
year olds (53%) will possess no more than a primary education in the year 2050, while one-third
will have suffered from stunting. Even under a completely unrealistic scenario whereby, starting
in 2020, governments ensure that every new student completes secondary school and every
newborn enjoys adequate nutrition throughout childhood, this new generation of fully empowered
workers would not enter the labour market until the early 2040s, by which time the demographic
window is getting ready to close.

Quickly and radically boosting investment in human capital is the only hope for ESA to
salvage the remnants of the demographic dividend. Unfortunately, recent expenditure trends
reveal the scale of the task at hand. In particular, few governments are meeting their financial
commitments to core human capital sectors, while the low revenue base makes it impossible to
achieve minimum investment levels in most places. The use of available resources is also
problematic. In addition to favoring tertiary services and recurrent items at the expense of basic
services and capital items – in contrast to demographic dividend investment needs – low budget
credibility and execution trends indicate that many human capital resources simply go unspent.

UNICEF and development partners can play a strategic role. Plenty of evidence on new
financing channels has already been generated across ESA, but now these opportunities must
be translated into progressively greater budgetary allocations to human capital sectors. Beyond
addressing the funding gaps, it is equally important to support government efforts to monitor the
amount and use of resources directed to human capital programs as well as identify and correct
spending inefficiencies to maximize the impact of that investment. As the demographic clock ticks,
the urgency of this agenda grows ever-more pressing with each passing day.

JEL classification: J11, J13, O11, O15

Key words: demographic economics, population economics, demographic transition,
demographic dividend, age distribution, population growth, human capital, human capital
investment, social sector investment

                                                4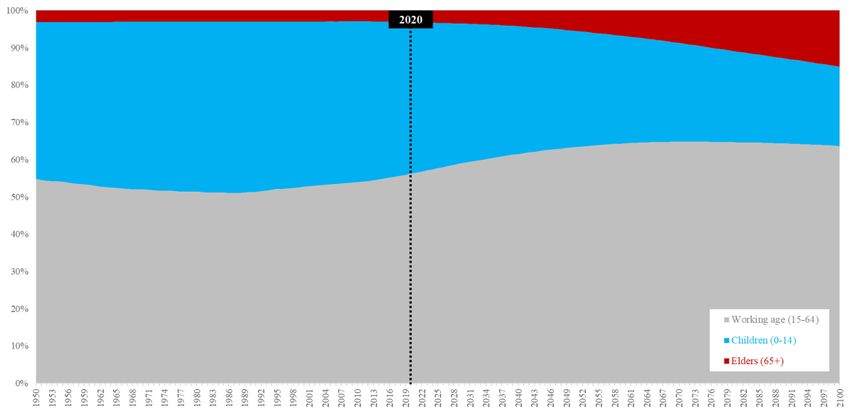
1.       Introduction

This working paper provides an overview of demographic trends in the Eastern and
Southern Africa (ESA) 1 region and the potential to capitalize on the demographic dividend.
The demographic dividend is the time-bound opportunity to catalyze economic growth and poverty
reduction as the working age population expands due to falling birth and death rates. Using a
variety of variables, the paper describes the ongoing population boom in ESA alongside the move
toward higher levels of savings and investment that can propel the production of more goods and
services and hence greater income and poverty reduction opportunities. It then assesses the
recent and likely trajectory of human capital in the region – a key determinant of the dividend –
while also modelling an alternative policy path whereby governments immediately ensure that
each newborn reaches her or his full physical and cognitive development while also completing
secondary school. The paper concludes by highlighting the importance of greater and better
investment in human capital sectors, which will determine how much of the remaining dividend
can be salvaged, while also discussing how UNICEF and development partners can help.

The paper is intended to support UNICEF’s understanding of demographic trends for more
effective programming and advocacy, especially in the area of public finance. It is
accompanied by an Excel tool that allows users to select any country in Africa, any sub-region in
Africa (Eastern and Southern, Western and Central, and Northern) or Africa as a whole, which
autogenerates the analyses presented in Sections 2, 3 and 4 of the paper. The paper also serves
as a template that can be customized to develop country-specific demographic narratives when
used in conjunction with the tool. Annexes 2 and 3 additionally present demographic fast facts
about ESA and Africa, respectively.

Several technical issues should be kept in mind. First, all demographic data presented in this
paper and included in the Excel tool are derived from UN DESA World Population Prospects:
2019 Revision (medium variant estimates) and UN DESA World Urbanization Prospects: 2018
Revision. Second, the objective of the paper is to provide a short overview of demographic
concepts and trends in ESA, so country-specific information and cross-country comparisons are
not presented. Third, where possible, data for ESA are presented as population weighted regional
averages. For instance, if looking at children as a share of the total population, the ESA figure
reflects the total number of persons aged 0-17 in all 21 countries in the region divided by the total
population of all 21 of those countries. However, due to statistical reporting practices, this was
not possible for some variables (e.g. fertility rate, death rate, life expectancy), so the information
presented reflects the average value of the 21 countries.

1
 ESA is intended as a UNICEF region and includes 21 countries: Angola, Botswana, Burundi, Comoros, Eritrea, Eswatini, Ethiopia,
Kenya, Lesotho, Madagascar, Malawi, Mozambique, Namibia, Rwanda, Somalia, South Africa, South Sudan, Tanzania (United
Republic of), Uganda, Zambia and Zimbabwe.

                                                              5
2. The demographic transition and population boom
All regions and countries experience a demographic transition due to declining birth and
death rates. Driven and sustained by a variety of factors, including better health and education
services, improved agricultural productivity, general technological progress and urbanization (see
Canning 2011, among many others), a fall in birth and death rates causes a structural change
from large family sizes and short lives to smaller family sizes and longer lives. Annex 1 presents
an overview of the stages of the classical demographic transition model for ESA.
Demographic transition forces began to take hold of ESA in the 1980s and continue to
shape the region. Death rates have been steadily declining since the 1950s and will bottom out
around 2040, but the fall in birth rates did not begin until the late 1970s and will continue a
downward trajectory until the end of the century, albeit at a much slower pace (Figure 1). The
impacts on family size and life expectancy are astounding. While the average woman was
expected to give birth to seven children in the 1960s, a person born in the region was lucky to
survive 45 years (Figure 2). By the year 2000, however, women were having two fewer children,
on average, while life expectancy had extended by five years. Currently, the average woman has
around four children, which is projected to fall to three by 2040 and two in the 2090s. At the same
time, a child born in the region today should live for around 63 years, but a child born in 2045 will
be expected to enjoy 70 years of life and 75 for years for those born in 2080.
Figure 1. Birth and death rate projections in ESA, 1950-2100 (per 1,000 population)
Source: Author’s calculations based on UN DESA World Population Prospects: 2019 Revision (medium variant estimates)
6Figure 2. Fertility rate and life expectancy projections in ESA, 1950-2100
Source: Author’s calculations based on UN DESA World Population Prospects: 2019 Revision (medium variant estimates)
As the move toward smaller families and longer lives unfolds, the size of the population
dramatically increases. Before the demographic transition kicks off, population growth is low
because high levels of fertility are largely offset by high levels of mortality. However, as the
number of births remains high but deaths begin to decline, especially among children, the
population growth rate spikes, which propels a sharp increase in the number of people. In ESA,
the population growth rate moved from 2%, on average, in 1950, to 3% in the 1980s, which
increased the total population from around 85 million to 220 million – or almost a three-fold jump
(Figure 3). The population growth rate has been falling since and currently stands at 2.5% with
about 550 million persons living in the region – just less than half of which are under the age of
18. Looking forward, although the population growth rate will continue a steady descent reaching
1% in 2080 and 0.6% by 2100, the total population will nearly double over the next three decades,
reaching 1 billion in 2050 and then on to 1.5 billion in 2080.
Figure 3. Population and growth rate projections in ESA, 1950-2100
Source: Author’s calculations based on UN DESA World Population Prospects: 2019 Revision (medium variant estimates)
7As the demographic transition advances, one key social concern is the fast-growing
number of children. If looking at birth trends, there were around 12 million new babies to care
for in ESA in the year 2000 (Figure 4). As of 2020, this number increased by an additional 5 million
babies each year – reaching close to 17 million – and will surpass 22 million in the 2040s. At the
same time, the number of children aged 0-4 in ESA will increase by more than 30 million between
2020 and 2050, which reaches 32 million for the cohort of 5-9 year olds (mainly primary school
age) and more than 34 million for 10-14 year olds (mainly lower secondary school age) (Figure
5).
Figure 4. Birth projections in ESA, 1950-2100 (in # of births)
Source: Author’s calculations based on UN DESA World Population Prospects: 2019 Revision (medium variant estimates)
Figure 5. Population pyramid projections in ESA, in 1990, 2020 and 2050 (in millions)
Source: Author’s calculations based on UN DESA World Population Prospects: 2019 Revision (medium variant estimates)
Note: Each year represents the accumulated total, so by 2050 there will be around 110 million children aged 0-4 living in ESA
8Another critical issue is the location of population growth. Here the overwhelming trend is
urbanization. While currently around one in three persons reside in an urban area, ESA will be
predominantly urban in 2047 (Figure 6). Overall, the number of persons living in urban areas will
swell from 192 to more than 525 million between 2020 and 2050, which represents a nearly three-
fold increase. Many cities will face extraordinary demographic pressures. For example, capitals
like Bujumbura, Dar es Salaam, Kampala and Lilongwe will see their populations double over the
next 15 years (Figure 7A), which applies to many secondary cities as well, such as Dire Dawa in
Ethiopia and Quelimane and Tete in Mozambique (Figure 7B). For the three mega cities projected
in the region by 2030 – Addis Ababa, Dar es Salaam and Luanda – they will be absorbing around
1,000 new residents every day over the next 15 years, on average (Figure 7C).
Figure 6. Rural and urban population projections in ESA in 1990, 2020 and 2050
(in millions and as % of total)
Source: Author’s calculations based on UN DESA World Population Prospects: 2019 Revision (medium variant estimates) and UN DESA
World Urbanization Prospects: 2018 Revision
Figure 7. Population projections in select cities in ESA, 2005, 2020 and 2035
A. Select capital cities (in # of persons and as % increase)
9B. Select secondary cities (in # of persons and as % increase)
C. Select cities (in average # of new daily residents between 2020 and 2035)
Source: Author’s calculations based on UN DESA World Urbanization Prospects: 2018 Revision
103. Increasing labour supply: The foundation of the dividend
In terms of the demographic dividend, the most important feature is the fast increase in
the size of the working age population. As more and more people enter the labour market, the
economy has the potential to produce more and more goods and services, which can drive
economic growth and income, thereby creating opportunities to significantly improve the well-
being of the population (the details are explained in Section 4). This process is well underway in
ESA. Currently, more than 12 million persons reach working age every year, which is double the
number from the 1990s (Figure 8). Going forward, there will be more than 18 million new potential
workers entering the labour market every year in the 2040s and 24 million in the 2080s.
Figure 8. New working age population projections in ESA, 1950-2100
(in # of persons aged 15 in the population)
Source: Author’s calculations based on UN DESA World Population Prospects: 2019 Revision (medium variant estimates)
The window of opportunity that is available for a region or country to take advantage of
the dividend is the period where the working age population increases faster than the
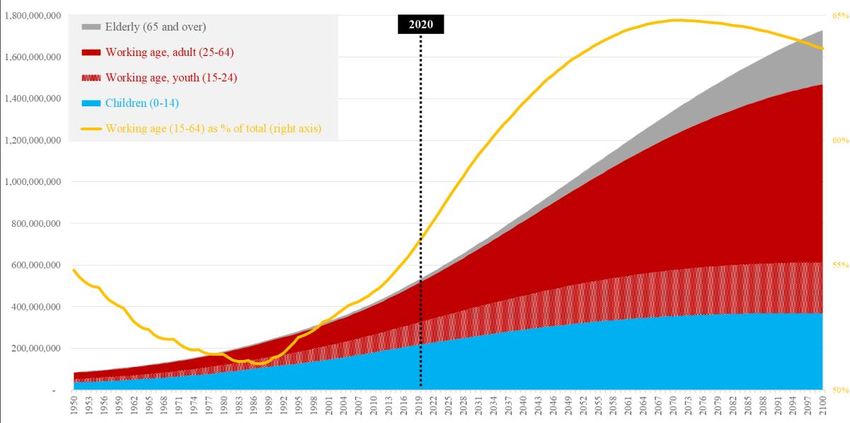
dependent age population. In ESA, the working age population (those persons aged 15-64) has
been rising since the 1990s when it was just below 50% of the total population. It currently stands
at 56% and is projected to increase to 60% in the mid-2030s before reaching 64% in the 2050s
where it will hover until the 2090s and then begin falling (Figure 9). In terms of the overall size,
the working age population doubled between the mid-1990s and 2020 – from 150 million to more
than 300 million persons. Going forward, it is projected to double again by 2047, reaching more
than 600 million, and will surpass one billion in the 2080s before starting to decline in the 2090s.
11Figure 9. Dependent and working age population projections in ESA, 1950-2100 (in # & % of total)
Source: Author’s calculations based on UN DESA World Population Prospects: 2019 Revision (medium variant estimates)
Building on the relationship between potential workers and non-workers, the dependency
ratio can be used to assess the timeframe for a region or country to benefit from a
demographic dividend. Mathematically, the dependency ratio adds the number of children
(under 14) and elderly (65 and over) and divides that by the number of persons of working age
(15-64), which are standardized age categories used by the ILO. The ratio gets smaller as the
size of the working age population grows faster than the size of the non-working age population.
As described earlier, family sizes are continuing to shrink as life expectancy expands,
which are causing the dependency ratio to fall in ESA. The ratio topped out at 96% in the late
1980s (i.e. there were 96 dependents for every 100 potential workers); the ratio is currently at
78%, which is expected to bottom out around 54% in the 2060s before reversing course (Figure
10). However, since the rate of change will begin to slow down significantly in the 2050s, ESA
has approximately 30 years to take advantage of the favorable demographic conditions that are
being propelled by the rising share of working age persons in the population. To offer a
comparison, this trend is inverted in high income countries, with the dependency ratio currently at
54%, on average, and expected to exceed 70% in 2050.
12Figure 10. Young and old dependency ratio projections in ESA, 1950-2100
(children and elderly as a % of working age population)
Source: Author’s calculations based on UN DESA World Population Prospects: 2019 Revision (medium variant estimates)
The demographic transition, therefore, presents a one-time opportunity for a region or
country.2 As small families and long lives become the norm, the labour force will need to care for
an increasing number of non-workers, mainly elderly persons. In ESA, around 1.4 million persons
will turn 65 in 2020, but this number will double by 2040, triple by 2050 and increase tenfold
around 2090, at which point an additional 14 million persons are projected to leave the labour
force and become “dependent” each year (Figure 11). As the balance between new workers and
new non-workers begins to change (i.e. the number of new babies and elderly begins to equal
and eventually surpass the number of new workers each year), this signals that the demographic
transition is ending. Based on current projections, dependents – elders in this case – will start to
increase their share of the total population beginning in 2070 (Figure 12).
Figure 11. New working and non-working age population projections in ESA, 1950-2100
(in # of persons aged 15 and 65)
Source: Author’s calculations based on UN DESA World Population Prospects: 2019 Revision (medium variant estimates)
2
A second dividend is possible when elderly workers accumulate savings/assets that can also be invested, but the ability of African
countries to benefit from this remains questionable at present.
13Figure 12. Working and dependent age population projections in ESA, 1950-2100
(% of population)
Source: Author’s calculations based on UN DESA World Population Prospects: 2019 Revision (medium variant estimates)
144. Savings and investment: Driving the dividend
A key economic force that underpins the potential to achieve a demographic dividend is
the savings rate. When looking at the structure of an economy, the amount of savings equals
the amount of investment. So as savings rise, investment in things like infrastructure, agriculture
machinery, small businesses, etc. also rise which, in turn, set the foundation for greater economic
output in the future.3 In terms of the demographic transition, the increasing number of workers
and output naturally create more income, which facilitates greater savings and investment. A rise
in savings is also partly explained by the move toward smaller family sizes, which require fewer
resources to maintain – i.e. it is cheaper to clothe, feed and educate three children than seven
children.
A strong relationship therefore emerges between falling dependency ratios and rising
savings rates. In low income countries, where the demographic transition is still at a relatively
early stage, savings rates are very low – 15% of GDP, on average (red lines in Figures 13A and
13B). In contrast, upper-middle income countries, which are generally nearing the end of the
demographic transition, are characterized by very high savings rates – 33% of GDP, on average
(green lines in Figures 13A and 13B). This indicates that savings rates tend to increase relatively
steeply as the demographic transition advances thus encouraging investment and broader
economic development.
However, this relationship eventually reverses. Driven by low birth and death rates (i.e. post-
demographic transition status), high income countries commonly feature very low and rising
dependency ratios, which are accompanied by much lower savings rates. For instance, savings
rates in high income countries are 23% of GDP, on average, which are a full ten percentage points
lower than those in upper-middle income countries (blue lines in Figures 13A and 13B). Much of
this change is driven by the rising consumption needs of the elderly who are no longer working
and earning. Lower savings will then result in lower investment and hence limit the expansionary
potential of the economy.4
Figure 13. Savings rates and dependency ratios by income groups, 1970-2018
A. Dependency ratios B. Savings rates
Sources: UN DESA World Population Prospects: 2019 Revision (medium variant estimates) and World Bank national accounts data
3
This is generally true, but the trade balance and fiscal balance are additional factors that affect the amount of investment in an open
economy.
4
See footnote 2.
155. Human capital: Maximizing the dividend
The potential gains in economic output and improved well-being depends on the
productive capacity of each new person that enters the labour force. In other words, just
because an economy has an increasing number of persons of working age does not automatically
mean that there will be more output or improved productivity, or that there will be greater income
and opportunities to improve well-being. There is no question that physical capital matters. The
existence of high-quality infrastructure, in particular, is critical to facilitating and sustaining greater
economic output and growth – think roads, ports and airports, water and irrigation systems,
electricity and telecommunications networks, or anything that helps businesses produce and sell
goods and services in domestic and international markets. Equally important, however, is human
capital or the ability of the labour force to produce and sell those goods and services. A fast-
growing labour force that is well-educated and fully physically and cognitively developed is
therefore better positioned to contribute to increased economic output and take advantage of
broader opportunities presented by the demographic transition (Lutz et al. 2019). Of course, the
opposite is also true.
As a thought exercise, it can be insightful to examine the human capital potential of young
workers. One very simplistic approach is to look at the educational achievement and general
physical and cognitive development of a cohort of young workers. For the former, completion
rates serve as a good proxy since they allow for estimating the number of a reference age group
that completed no education, only completed primary education, only completed lower secondary
education or completed upper secondary education.5 For the latter, stunting rates among children
under 5 are a decent proxy since they can also be linked to a reference age group and be tracked
over time, while the effects of malnutrition and poor health experienced during childhood tend to
be irreversible.6 When combined, young workers that are better educated and whose growth was
not affected by stunting should be expected to be more productive workers and hence better able
to contribute to improved productivity and economic growth.
When applying education and general development proxies, the current human capital
potential in ESA is alarming. Of the roughly 10 million 23 year olds7 in the region in 2020,
approximately 40% did not complete primary school while less than 20% studied full-time and
progressed through upper secondary education without unreasonable delay (Figure 14A). If
combining those persons that did not complete primary school or only completed lower secondary
school, close to two out every three young workers (63%) could be considered lacking basic
literacy and numeracy skills. At the same time, nearly half of 23 year olds (47%) in 2020 were
affected by stunting as children, suggesting that their bodies and brains were never fully
developed (Figure 14B).
5
Applying the primary completion rates in year n - 6, lower secondary completion rates in year n - 3 and upper secondary completion
rates in year n to the reference age group for upper secondary completion rates in year n allows for estimating the number of persons
in that age group that only completed each level or no level. For instance, primary rates in 2014, lower secondary rates in 2017 and
upper secondary rates in 2020 can be used to approximate the educational achievement of 23 year olds in the year 2020.
6
Applying the stunting rates in year n - 19 to the reference age group in year n allows for estimating the number of persons in that
age group that were affected and not affected by stunting as a child. For instance, stunting rates in 2001 can be used to approximate
the number of 23 year olds in the year 2020 that were affected by stunting as children.
7
Since the aim is to understand the highest level of basic education achieved, 23 is the youngest age that can be used for this analysis
since completion rates represent the cohort of persons aged 3-5 years above the intended age for the last grade of each level of
education who have completed that grade. In ESA, official school ages for upper secondary education are 16-18, on average, which
means that the reference age group to identify completion rates is 21-23 (or 18 + 3 = 21 and 18 + 5 = 23).
16Figure 14. Human capital outcomes of 23 year olds in ESA, 2020 (in millions and % of total)
14A. Education completion rates 14B. Affected by stunting, height for age
Sources: Author’s calculations based on UN DESA World Population Prospects: 2019 Revision (medium variant estimates), UNESCO Institute of
Statistics, and UNICEF, WHO and World Bank Joint Child Malnutrition Estimates (2018 edition)
Notes: Interpolation and nearest neighbor imputation methods used to gap fill missing values at the country level, where applicable, in order to arrive at
regional estimates; 2020 projections are based on the least squares method using the latest 10-year period
Based on current trends, the human capital potential of ESA will likely improve over time.
Projecting the educational achievement of the same cohort of young workers indicates that the
percentage of 23 year olds that do no complete any level of education will drop from 40% to 27%
between 2020 and 2050 just as the share that complete lower and upper secondary education
will increase by six and four percentage points, respectively (Figure 15A). Therefore, at the current
rate of improved completion rates in the region, close to half of this representation of the young
labour force will possess at least lower secondary education skills, which is 10% better than in
2020. Forecasting stunting trends on 23 year olds further suggests that the portion of this group
of young workers that are affected will fall from 47% to 32% between 2020 and 2050; this indicates
that close to 70% will have reached their full physical and cognitive development (Figure 15B).
Figure 15. Human capital outcomes of 23 year olds in ESA, 1990-2050 (in millions and % of total)
15A. Education completion rates 15B. Affected by stunting, height for age
Sources: Author’s calculations based on UN DESA World Population Prospects: 2019 Revision (medium variant estimates), UNESCO Institute of
Statistics, and UNICEF, WHO and World Bank Joint Child Malnutrition Estimates (2018 edition)
Notes: Interpolation and nearest neighbor imputation methods used to gap fill missing values at the country level, where applicable, in order to arrive at
regional estimates; forward-looking projections are based on the least squares method using the latest 10-year period
17Despite the likely progress in strengthening the human capital base of the working age
population in ESA, the gains will not be enough to maximize the demographic dividend.
Assuming that the cohort of 23 years olds were representative of the entire labour force in the
year 2050 – acknowledging that this would be a significant over-estimation since older workers
would have achieved lower levels of education and been affected by much higher incidences of
stunting as children – more than half (53%) would still likely be illiterate and lack basic numeracy
skills having completed no education or only primary education (Figure 15A above). At the same
time, approximately one-third (32%) would not have reached their full physical or brain
development potential due to the effects of stunting (Figure 15B above). Moreover, at that stage,
dependent age populations would start to begin increasing their share of the total population,
signaling the end of the window to capitalize on favorable demographic conditions. Current trends
therefore suggest that ESA will remain far from possessing the human capital base required to
fully reap a demographic dividend.
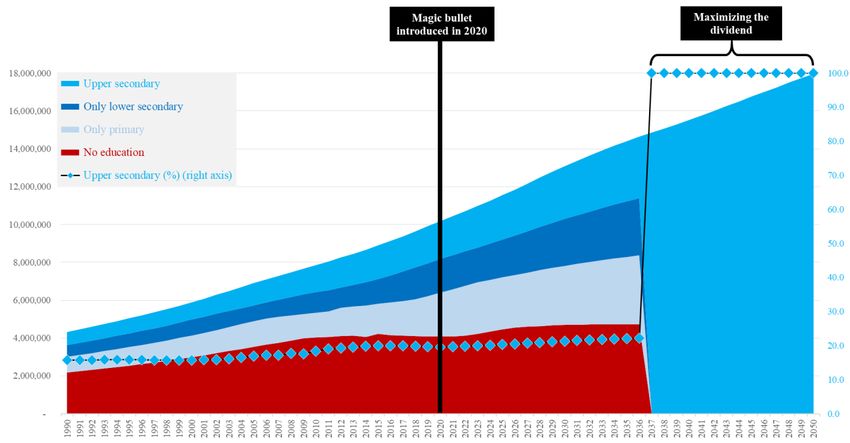
But how would the outlook change if governments were able to instantly solve two of the
most pressing human capital challenges? For the sake of argument, assume that, starting in
2020, all governments guaranteed that every child that enters primary school progresses through
and graduates from secondary school without undue delay, while every newborn has adequate
nutritional intake and is safeguarded from the effects of stunting throughout childhood. Under this
“magic bullet” scenario, the cohort of 23 year olds would start their primary education at 6 years
old in 2020 and would possess at least an upper secondary education in 2037 (Figure 16), while
23 year olds born in 2020 would be completely free of any impacts of stunting in 2043 (Figure
17). In other words, all new working age persons would have reached their full physical and
cognitive development and enjoy a minimum set of skills in the early 2040s, which would present
an opportunity to start maximizing the productivity and output potential of the economy from a
human capital perspective. However, even under this implausible scenario, the older workforce
would still be characterized by low educational achievement and stunted growth, while there
would only be about a decade before the demographic window begins closing.
18Figure 16. Education completion rates among 23 year olds in ESA under a “magic bullet”*
scenario, 1990-2050 (in # and % of total)
* Assumes all students that enter primary school starting in 2020 finish upper secondary school without delay
Sources: Author’s calculations based on UN DESA World Population Prospects: 2019 Revision (medium variant estimates) and UNESCO Institute of
Statistics
Notes: Interpolation and nearest neighbor imputation methods used to gap fill missing values at the country level, where applicable, in order to arrive at
regional estimates; forward-looking projections are based on the least squares method using the latest 10-year period, assuming that the cohort of
children that enter primary school age in 2020 (6 years old) complete upper secondary education and reach 23 years of age in 2037
Figure 17. 23 year olds affected by stunting under a “magic bullet”* scenario, 1990-2050
(in # and % of total)
* Assumes that every child born in 2020 and after is never affected by stunting
Sources: Author’s calculations based on UN DESA World Population Prospects: 2019 Revision (medium variant estimates), and UNICEF, WHO and
World Bank Joint Child Malnutrition Estimates (2018 edition)
Notes: Interpolation and nearest neighbor imputation methods used to gap fill missing values at the country level, where applicable, in order to arrive at
regional estimates; forward-looking projections are based on the least squares method using the latest 10-year period, assuming that the cohort of
children that are born in 2020 complete upper secondary education and reach 23 years of age in 2043
196. Public investment decisions: The future of the dividend
Unlocking the remaining potential of the demographic dividend in ESA hinges on the
investment choices of governments starting today. By investing in the health, knowledge,
skills and resilience of their populations, governments can help the fast-growing labour force to
be more productive, flexible and innovative, and thus better capable of contributing to sustained
economic growth and poverty reduction while there is still time (World Bank 2018). As a starting
point, this requires scaling up spending on core health and education programs, which will also
need to be complemented by sound economic and governance policies to encourage savings,
investment and the creation of new jobs for all of the new workers (Table 1).
Table 1. Policy and programmatic approaches to deliver the demographic dividend
Area Core policies and programs Special focus Benefits
Health ▪ HIV/AIDS prevention and ▪ Ensure adequate personnel (doctors, nurses, ▪ Improved child
treatment midwives, community health workers), facilities, survival rates and life
▪ Immunizations medical equipment and health commodities to expectancy
▪ Nutrition, including school provide universal access to basic primary ▪ Better attendance and
meals healthcare services even as the demand for performance in school
▪ Promotion of healthy lifestyles services increases vis-à-vis growing populations among student
and diets among young adults populations
▪ Sanitation ▪ Enhanced worker
▪ Sexual and reproductive health productivity
Education ▪ Early childhood development ▪ Ensure the number of classrooms, teachers and ▪ Improved skills of the
(ECD) didactic materials match rising student populations workforce to move into
▪ Primary school ▪ Strengthen the quality of learning, including formal sector jobs and
▪ Secondary school through teacher training earn higher wages,
▪ Technical and vocational ▪ Adjust learning curriculum to changing labour pursue entrepreneurial
education and training (TVET) market demands opportunities, and
▪ Support girl’s empowerment by ensuring female foster innovation
participation throughout the school cycle and by
outlawing and enforcing mechanisms to prevent
child marriages and gender-based violence
Economic ▪ Physical infrastructure ▪ Support economic sectors that can expand and ▪ Increased savings and
and ▪ International trade absorb the growing workforce investment
Governance ▪ Tax incentives ▪ Increased number and
▪ Good governance, including quality of jobs
rule of law, anti-corruption, ▪ Increased economic
contract enforcement, etc. output
▪ Macroeconomic stability
▪ Savings and investment
schemes for workers
Sources: Author’s summary based on USAID, PACE and Population Reference Bureau (2019), African Institute for Development Policy and University
of Southampton (2018), Bloom et al. (2017), Canning et al. (2015), and UNECA and African Union Commission (2013)
Unfortunately, the recent levels, design and performance of human capital investment
across ESA are very unlikely to reap much of the remaining demographic dividend.8 As a
starting point, few governments are meeting their financial commitments to core human capital
sectors, either in budget priority or in levels of investment. For example, only 5/21 countries with
recent comparable expenditure data had devoted 20% or more of their national budgets to
education in line with Education for All (UNESCO 2015), while just 3/21 countries had spent 15%
or more according to the Abuja Declaration (WHO 2011) (Figure 18). And even where human
capital sectors are afforded a higher share of the budget, the low revenue base makes it
8
The information contained in this paragraph is a summary of a detailed review of human capital investment in ESA as presented in
Chapter 7 of Cummins (2019a).
20impossible for most governments to achieve minimum spending levels (Figure 19). The structure
of human capital budgets is also problematic. On the one hand, budgets commonly favor tertiary
services at the expense of primary services that are direly needed and gravely underfunded
(Figure 20 presents an example from the education sector). On the other hand, infrastructure
development and equipment and materials to support effective service delivery are often
afterthoughts, as recurrent items – largely salaries – absorb the lion’s share of human capital
budgets (Figure 21). Low budget credibility and poor budget execution, especially for capital
items, act as additional barriers to better human capital investment (Figure 22).
Figure 18. Human capital expenditure* in select ESA countries, 2015
(% of total expenditure)
60.0 Education
50.0
40.0 Health
30.0
Water and
20.0 sanitation
10.0 Social
0.0 protection
LICs LMICs Avg
Sources: WHO Global Health Expenditure Database for health, UNESCO Institute for Statistics for education, and Government Spending Watch for
water and sanitation as well as social protection
* Data for water and sanitation are approved allocations and not actual expenditure as in the other sectors
Figure 19. Per capita human capital expenditure* in select ESA countries, 2015
(in PPP, current international US$)
1,600 Education
1,400
1,200 Health
1,000
800
WASH
600
400
Social
200
protection
-
LICs LMICs Avg
Source: Author’s calculations based on WHO Global Health Expenditure Database for health, UNESCO Institute for Statistics for education, Government
Spending Watch for water and sanitation as well as social protection, and IMF World Economic Outlook Database (April 2019) for GDP and population
21Figure 20. Government expenditure by level of education in select ESA countries, 2017 or latest
available (% of total government expenditure on education)
100.0
90.0 pre-primary
80.0
70.0 primary
60.0
50.0 secondary
40.0
30.0 tertiary*
20.0
10.0 other
0.0
Source: UNESCO Institute for Statistics
* Includes both tertiary and post-secondary non-tertiary
Figure 21. Economic classification of human capital expenditure* in ESA, 2017 or latest available
(% of total social sector expenditure, regional averages)
100%
80%
Recurrent
60%
40%
Capital
20%
0%
Social protection Water and sanitation Education Health Social sector average
(n=9) (n=9) (n=14) (n=14)
Source: Author’s calculations based on WHO Global Health Expenditure Database for health, UNESCO Institute for Statistics for education, and
Government Spending Watch for water and sanitation as well as social protection
* Data for water and sanitation are approved allocations and not actual expenditure as in the other categories
Figure 22. Human capital budget credibility rates in ESA, 2017 or latest available (actual
expenditure as % of approved allocation, three-year period regional averages)
110%
100% Recurrent
90%
80%
Capital
70%
60%
50% Total
40%
Water and sanitation Social protection Health Education Social sector average
Source: Author’s calculations based on UNICEF budget briefs, Public Expenditure Reviews (PERs), Public Expenditure and Financial Assessments
(PEFAs), BOOST databases and Government Spending Watch published since 2016
227. Concluding thoughts
Population dynamics are upending ESA. The ongoing shift toward smaller families and longer
lives is causing jaw-dropping population growth. In addition to the huge increase in the number of
children and workers, these processes are largely taking place in urban areas, which will be under
increasing strain for the foreseeable future. At the same time, as the working age population
outpaces the dependent age population, the region has an opportunity to benefit from the natural
increase in economic output to improve well-being and accelerate poverty eradication.
The time-bound window to take advantage of favorable demographic conditions is quickly
closing. Looking at the projected change in the dependency ratio, the region has approximately
30 years to exploit the growing labour force before the number of elderly persons starts to
significantly increase, thus limiting savings, investment and future output potential.
The remaining benefits will be largely determined by the human capital base of the
workforce, which remains severely undeveloped. When applying proxies for human capital to
a cross-section of the young labour force, only one out of every three young workers has
completed some sort of secondary education, while close to half were affected by malnutrition
during childhood. The absence of basic literacy and numeracy skills combined with stunted bodies
and brains indicates that most workers remain far from reaching their productive or innovative
potential.
Looking forward, human capital will not develop fast enough to maximize the demographic
dividend. According to projections, more than half of 23 year olds will still only possess no more
than a primary education in 2050, while one-third will have suffered from stunting. And even under
a completely implausible scenario whereby all governments guarantee that every newborn is well-
nourished throughout childhood and every new student graduates from secondary school, this
new generation of fully empowered workers would not enter the labour market until the early
2040s, by which time the demographic window is already beginning to close.
Quickly and radically scaling up investment in human capital is the only hope for ESA to
salvage some part of the dividend. Yet concerns abound. Few governments are meeting their
financial commitments to core human capital sectors, including education and health. At the same
time, the low revenue base makes achieving minimum investment levels an impossibility in most
countries. There are also major questions around the use and impact of resources allocated to
human capital sectors, which are frequently unaligned to priorities or simply unspent.
Despite the worrisome outlook, UNICEF and development partners can play help
governments to galvanize and get the most out of their investment in human capital. On
the financing side, nearly all UNICEF country offices in ESA have recently carried out fiscal space
analyses.9 The regional summary report notes that every government has at least one very strong
option to boost investment in human capital sectors (Cummins 2019b). Reprioritizing the budget,
increasing domestic revenue and improving the efficiency of spending are the most promising
avenues, while attracting greater foreign aid and cracking down on illicit financial flows are good
approaches in sub-groups of countries. Through further analysis, advocacy and advice, and
9
The country reports are available here: https://www.unicef.org/esa/reports/public-finance-analyses#fiscal-space.
23operational support, UNICEF and development partners can work with governments to translate
these opportunities into progressively higher allocations to human capital programs. Beyond the
funding gaps, they can also support governments to monitor the amount and use of resources
going into human capital sectors as well as identify and address spending inefficiencies to
maximize the impact of investment and capitalize on the remaining dividend. As the demographic
clock ticks, the urgency of this agenda grows ever-more pressing with each passing day.
24References
African Institute for Development Policy and University of Southampton (2018) Regional Analysis
of Youth Demographics, Nairobi: African Institute for Development Policy.
Bloom, D., Kuhn, M. and K. Prettner (2017) “Africa’s Prospects for Enjoying a Demographic
Dividend,” Journal of Demographic Economics (JODE), Cambridge University Press 83(1), pp.
63-76.
Canning, D. (2011) “The Causes and Consequences of Demographic Transition,” Population
Studies 65:3, pp. 353-361.
Canning, D., Raja, S. and A. Yazbeck (2015). Africa’s Demographic Transition: Dividend or
Disaster?, Washington, DC: World Bank.
Cummins, M. (2019a) The Macroeconomic and Social Investment Outlook for Children in Eastern
and Southern Africa, Nairobi: UNICEF ESARO.
Cummins, M. (2019b) Fiscal Space for Children and Human Capital in Eastern and Southern
Africa: Options and Strategic Entry Points to Address Investment Gaps in 16 Countries, Nairobi:
UNICEF ESARO.
Lutz, W., Cuaresma, J. C., Kebede, E., Prskawetz, A., Sanderson, W. C. and E. Striessnig (2019)
“Education rather than Age Structure Brings Demographic Dividend,” Proceedings of the National
Academy of Sciences of the United States of America (PNAS) 116 (26) 12798-12803.
United Nations Economic Commission for Africa (UNECA) and the African Union Commission
(2013) “Africa and the Challenge of Realizing the Demographic Dividend,” 5 Policy Briefs on the
Demographic Dividend.
United Nations Educational, Scientific and Cultural Organization (UNESCO) (2015). Incheon
Declaration and SDG4 – Education 2030 Framework for Action. Paris: UNESCO.
USAID, Policy Advocacy Communication Enhanced and Population Reference Bureau (2019)
“The Four Dividends,” Population Reference Bureau.
WHO (2011). The Abuja Declaration: Ten Years On. WHO: Geneva.
World Bank (2018) “The Human Capital Project,” World Bank Working Paper.
25Annex 1. Classical demographic transition model: Snapshot of ESA
1. PRE-TRANSITION 2. EARLY TRANSITION 3. LATE
Life expectancy Low Rapidly increasing Stabilizing
Fertility rate High Rapidly declining Declining
Workforce Stable Increasing Stabilizing
Children Many Starts decreasing Decreasing
Working age Stable Increasing Stable
Elderly Few Stable Starts increasing
80.0 7.0
70.0 6.0
Fertility rate (right axis)
60.0
5.0
50.0
4.0
40.0
Life expectancy (left axis) 3.0
30.0
2.0
20.0
10.0 1.0
Workforce (millions, right axis)
- 0.0
70%
60%
50%
40%
30%
20% Children (0-14) (% of population)
10%
0%
70%
60%
50%
40%
30%
Workforce (15-64) (% of population)
20%
10%
0%
70%
60%
50%
40%
30%
20%
10%
Elderly (65+) (% of population)
0%
1950
1953
1956
1959
1962
1965
1968
1971
1974
1977
1980
1983
1986
1989
1992
1995
1998
2001
2004
2007
2010
2013
2016
2019
2022
2025
2028
2031
2034
2037
2040
2043
2046
2049
2052
2055
2058
2061
2064
2067
2070
2073
2076
2079
2082
2085
2088
2091
2094
2097
2100
Source: Author’s calculations based on UN DESA World Population Prospects: 2019 Revision (medium variant estimates)
26Annex 2. Demographic fast facts about ESA10
Overall population growth
▪ Home to just 85 million persons in the 1950s, the region will boast more than 1 billion people
by 2050 and 1.5 billion in 2080 – more than China and India today.
▪ It will take 35 years for the population to double and 70 years to triple – from just under 550
million in 2020 to 1.1 billion in 2055 to 1.6 billion in 2090.
▪ The annual population growth rate in ESA will average 2.4% between 2020 and 2030,
although it is currently above 3% in four countries: 3% in Tanzania, 3.1% in Burundi, and 3.3%
in Angola and Uganda. Compare that to the global average (0.9%) or to averages in Asia
(0.7%) or North America and Europe (0.1%).
Urbanization
▪ Two out of three people still live in rural areas today (compare that to WCA where it is almost
1 in 2).
▪ There will be more people living in urban areas beginning in 2047.
▪ For the three mega cities projected in the region by 2030 – Addis Ababa, Dar es Salaam and
Luanda – they will absorb around 1,000 new residents every day over the next 15 years as
their populations nearly double.
Births
▪ Close to 17 million babies will be born in ESA in 2020; this will reach 20 million by 2036 and
peak at close to 25 million in the 2080s before declining.
▪ 1 birth takes place every 2 seconds – or 45,000/day; this will reach 1.6 births every 2 seconds
– or 68,000/day – in 2087 before slowing down.
Child population (0-17)
▪ There are just over 255 million children today, which will reach 300 million in 2030, 400 million
in 2059 and peak at 442 million in 2094 before starting to decline.
▪ The share of children in the population will nearly fall in half between today and the end of the
century – from 47% in 2020 to 25% in 2100.
Labour force
▪ The potential workforce (15-64 year olds) will double in 27 years – from just over 300 million
in 2020 to more than 600 million in 2047 – and surpass 1 billion in the 2080s.
▪ More than 12 million young persons will reach working age in 2020, which is close to 35,000
on a daily basis; those figures will double in the 2080s.
▪ The dependency ratio maxed out at 96% in the late 1980s (i.e. there were 96 dependents for
every 100 potential workers in the population) and has been declining ever since; the current
ratio stands at 78%, which is expected to bottom out around 54% in the 2060s giving the
region approximately 30 years to exploit favorable demographic conditions. In contrast, this
trend is inverted in high income countries, where the dependency ratio is currently 54%, on
average, and will exceed 70% in 2050.
10
Based on the 21 countries included in UNICEF’s regional classification – see footnote 1 for the complete list.
27You can also read