Development of Gold Tiny Particles and Particles in Different Sizes at Varying Precursor Concentration - arXiv
←
→
Page content transcription
If your browser does not render page correctly, please read the page content below

Development of Gold Tiny Particles and Particles in Different Sizes at
                        Varying Precursor Concentration

                            Mubarak Ali a, * and I –Nan Lin b

   a Department   of Physics, COMSATS University Islamabad, Park Road, Islamabad-
    45550, Pakistan, *E-mail: mubarak74@mail.com, mubarak74@comsats.edu.pk

b Department   of Physics, Tamkang University, Tamsui, New Taipei City 25137, Taiwan
                             E-mail: inanlin@mail.tku.edu.tw

Abstract: Coalescence of tiny particles for a large sized particle has been a significant
phenomenon for many senior academicians and researchers throughout the world,
where it has been a part of record of all periodicals contributing to science and
technology. This study attempts to deal with the development of gold particles under
varying precursor concentration for a custom-built setup. Under the tuned ratio of
bipolar pulse OFF to ON time, tiny particles of different sizes and shapes develop
depending on the amount of gold precursor. Packets of nano-energy bind gold atoms in
their own shape when a compact monolayer assembly is formed at solution surface.
Between 0.07 mM to 0.90 mM precursor concentration, tiny particles develop both in
triangular shape as well as in non-triangular shape. Tiny particles of triangular shape
develop in a large number at precursor concentration 0.30 mM and 0.60 mM. Hence,
nanoparticles and particles also developed in different geometrical shapes. Such tiny
particles pack due to the exerted force in immersing format, where converted structures
of smooth elements assemble to develop particles of different shapes. Tiny particles of
non-geometrical shapes do not assemble at common point and their assembling
develops a particle of distorted shape. This occurs mainly when precursor concentration
is 0.05 mM and 1.20 mM. Development of different shapes having different sizes
depends mainly on the amount of precursor concentration. When the length of a side is
around 100 nm, it is considered a nanoparticle and when it is greater, it is considered a
particle. An anisotropic particle has structure different to that of the distorted one. At 50

                                             1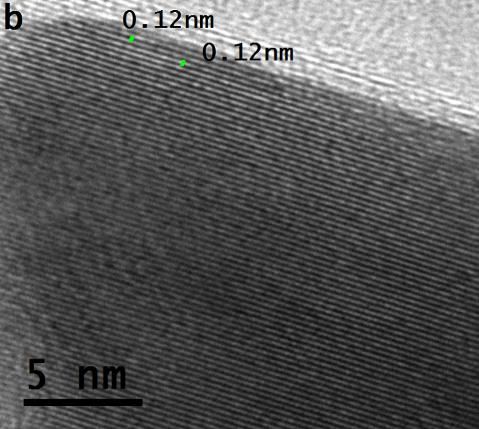
sccm Argon flow rate, particles develop in the same shapes as in the case of 100 sccm.
Different colors of solutions indicate different elongation rates of atoms forming
structures of smooth elements of nanoparticles and particles. This study clarifies the
necessary concentration of precursor to develop colloids of different sizes.
Keywords: Precursor concentration; Nano-energy; Tiny-shaped particles; One-
dimensional particles; Multi-dimensional particles; Distorted particles

1.      Introduction
Developing different structures of colloidal matter under a certain processing strategy
may be the origin of a widespread phenomenon. The particles of controlled shape can
be the strong candidates for significant applications. This is because of a great
challenge to develop anisotropic particles. To assemble tiny-sized particles precisely is
a goal for developing advanced functional materials. Metallic colloids having different
shapes under different processing conditions may reveal the unexplored factors of their
developments. When a tiny-sized particle develops by atom-to-atom amalgamation,
attained dynamics of atoms can be the sole cause. To regulate the structure of tiny-
sized particles while developing shape of a large-sized particle, a tailored amount of
energy is found to be another cause. Electron dynamics in amalgamated atoms of a
certain nature may regulate the structure and morphology of their bigger size. However,
this (electron dynamics) cannot be the case with those atoms bind into a tiny particle
due to their certain transitional state. Here, prior to binding of those atoms (under
certain protocol of energy), they have been amalgamated for favorably attained
dynamics and by morphing the monolayer assembly at electronically controlled flat
solution surface. It is expected that under variable concentration of gold precursor in an
appropriate range, it may depict the overall picture of size, shape and structure of
particles.
     As a matter of fact, transition state of an atom and electron dynamics of an atom are
two different scenarios. In the first case, electrons should be mainly recognized to take
infinitesimal displacements under varying forced energy in their atom when remaining
within the occupied states (clamped energy knots). In the latter case, electrons should

                                             2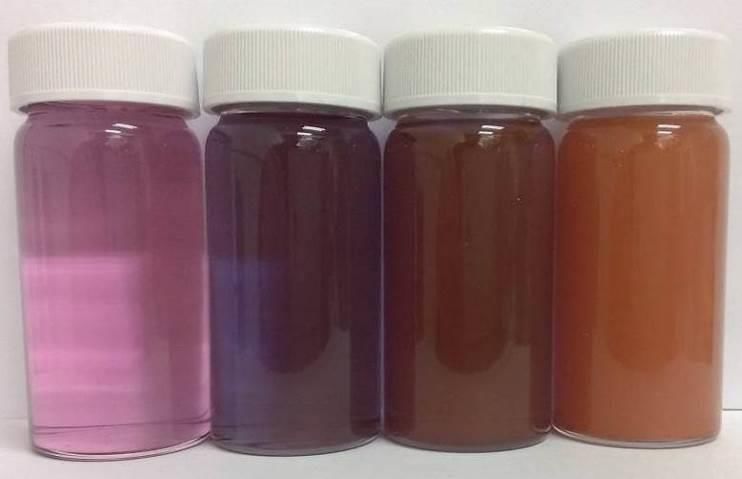
be mainly recognized to leave occupied states under suitable force or energy prior to
reinstate states. The latter case is mainly related to the outer rings of atoms.
   Several approaches have been explored in the literature to synthesize colloidal tiny-
sized particles and large-sized particles where citrate reduction method is one of the
most widely adopted procedures [1]. Development of large-sized particles on likely
coalescence of tiny-sized particles has been the subject of several studies [2-12]. Metal
clusters behave like simple chemical compounds and could find applications in
catalysis, sensors and molecular electronics [2]. Discrete features of nanocrystals and
their tendency to extend into superlattices suggest ways and means for the design and
fabrication of advanced materials with controlled characteristics [3]. An ordered array of
nanoparticles instead of agglomeration might present new properties different from the
individual particles [4]. Coalescence of nanocrystals into extended shapes has
appeared to be a realistic goal [5]. Self-assembly means to design specific structure,
which cannot be achieved alternatively [6]. Potential long-term use of nanoparticle
technology is to develop small electronic devices [7]. Assembling of nanoparticles may
be an initial effort towards the selective positioning and patterning in a large area [8].
Organization of nanometer sized building blocks into specific structures to construct
functional materials and devices is one of the current challenges [9]. On assembling
nanocrystals into useful structures, ‘atoms and molecules’ will be treated as materials of
tomorrow [10]. Precise control on the assemblies of nanoparticles enables the synthesis
of complex shapes and provides pathways to fabricate new materials and devices [11].
Coalescing nanocrystals into long-range crystals allow one to develop materials with
endless selections [12]. Surface plasmon absorption is workable for small-sized
anisotropic particles, but it has remained a challenging task to take benefit from the
phenomenon at macroscopic level [13].
   On trapping mobile electrons, tiny particles collectively oscillate [14]. The existing
mechanistic interpretations are insufficient to explain several observations [15]. The rate
of reactant addition/reduction can be estimated to produce subsequent specific shaped
particles in high yields [15]. Locating the specific mode of excitation of surface plasmon
in metallic nanocrystals will foreground intense consequences in the research fields

                                             3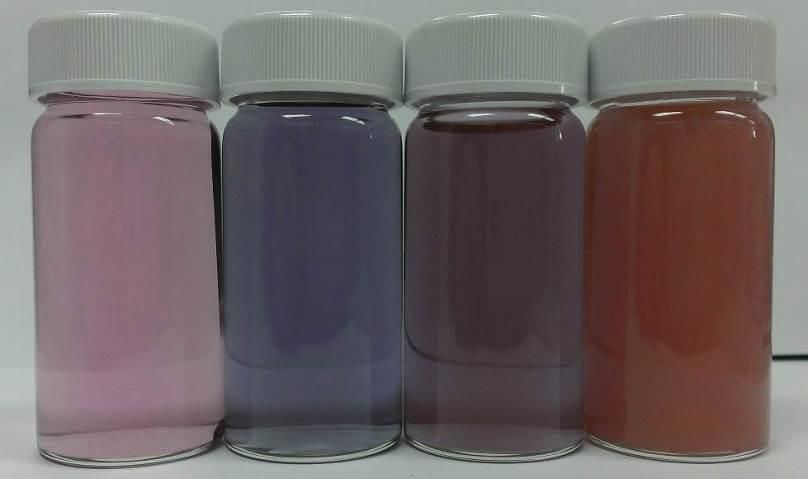
[16]. More work is required to develop in-depth understanding of metallic colloids [17,
18].
   Attempts have also been made to synthesize different anisotropic particles and
distorted particles in different employed plasma solution processes [19-26] where four
main strategies have remained in utilization i.e., DC plasma discharge in contact with
the liquid, DC glow discharge plasma in contact with the liquid, pulse plasma discharge
inside the liquid, and gas-liquid interface discharge. Quite a few reaction mechanisms
proposed by different groups are to be the most probable underlying mechanisms such
as plasma electrons [21], hydrogen radicals in liquid [23], aqueous electrons [22] and
hydrogen peroxide [19, 20]. Gold nanoplates and nanorods have been synthesized on
the surface of solution while sphere-shaped particles inside the solution [23]. Again,
probing matter at a length scale comparable to the subwavelength of light can deliver
phenomenal optical properties [27, 28] and different phase-controlled syntheses give an
improved catalytic activity of metallic nanostructures as compared to bulk ones [29, 30].
Different tiny-sized particles of gold having different attained dynamics of their
amalgamation were discussed [31]. Leaving inter-state electron gaps of splitting inert
gas atoms, photons having characteristic of current achieve visible range to reveal the
light-glow while traveling in the air-medium [32]. Photons generated by the uninterrupted
inter-state electron dynamics of a natural state silicon atom have their characteristics of
current and energy which are being transported from one point to another through their
involved force [33]. When photons having characteristic of current continuously
propagate through inter-state electron gaps of atoms of a suitable wire, they work as
photonic current [32]. The amalgamated atoms bind under generated energy of the
targeted atom while executing confined inter-state electron dynamics [34]. A separate
study has discussed the mechanism of development of a triangular-shaped gold tiny
particle and modification of atoms of arrays into structures of smooth elements [35].
Carbon atoms of different states bind into grains or crystallites depending on the
localized process conditions [36, 37]. Different tiny-sized particles and large-sized
particles while processing gold precursor, silver precursor and their binary composition
were discussed where processing of gold solution resulted in anisotropic particles [38].
Morphology and structure of gold particles were controlled under the varying conditions

                                            4
of the process while employing the pulse-based electron-photon and solution interface
process [39]. While considering formation of tiny particles and their extended shapes,
origin of physics and chemistry of materials was discussed [40]. Gold particles of
unprecedented features developed while setting the optimized condition of the process
[41]. The origin of different atoms belonging to gas and solid states along with
transitional behaviors was discussed [42]. Depending on the nature of atoms of tiny-
sized particles, their use can be disadvantageous for a certain nanomedicine application
[43].
     Some details on concentration as a factor for gold nanoparticles synthesis have
been discussed by the other group [19, 20]. The size of gold nanoparticles tuned in the
range of few nanometers to several hundred nanometers under the molar concentration
of gold precursor upto 1.0 mM [20]. The investigations of Patel et al. [20] concluded that
hydrogen per oxide worked as the reducing agent where gold ions converted into gold
atoms, which is entirely a different mechanism from the one presented in our study. The
underlying mechanisms of nucleation and growth of anisotropic and distorted
nanoparticles and particles along with additional details presented in this study have
never been reported before.
     The present study describes how to develop gold tiny-sized particles and their
different shaped large-sized particles while varying the concentration of gold precursor.
We briefly discussed the role of varying precursor concentration under fixed process
parameters while developing particles of different shapes in custom-built pulse-based
electron-photon and solution interface process.

2.      Experimental details
Solid powder of HAuCl4 was purchased from Alfa Aesar to obtain the aqueous solution
of different molar concentrations. In brief, aqueous solution of one-gram HAuCl4·3H2O
and ~100 ml DI water was prepared in a glass bottle. This was followed by the
preparation of several different molar concentrations by dissolving that amount (of
prepared mixture of precursor) in DI water. The total quantity of the solution for each
experiment was ~100 ml. Schematic diagram of the setup is shown in Figure 1.

                                            5
A copper capillary (electron-photon source) with internal diameter ~3 mm (thickness:
~1.5 mm) was used to maintain the flow of Argon gas. At the bottom of tube, atoms of
flowing Argon gas split by propagating photons having characteristic of current. A
graphite rod (energy source) with a width of ~1 cm was immersed into the solution
known as anode. The distance between copper capillary bottom and solution surface
was ~5 mm and was kept constant in all experiments. Distance between graphite rod
and copper capillary was set ~4 cm in each experiment. Layout of air/solution interface
and electron-photon/solution interface is shown elsewhere [31].

                                                                  Step-up transformer
                                                  Argon gas

               Pulse power controller

                                                                    Graphite rod:
                                                                       1cm2
                 DC Power supply

                                        Copper tube                 Cover

                   Height:
                 ~ 13 cm        Diameter of beaker: 10.5 cm             4.00 cm

                                                                  Water surface
                                Diameter of glow: 3 mm            area: 346 cm2

                  Height: ~ 1
                      cm                 Electron-photon and solution interface
                   solution)                   (HAuCl4:3H2O + DI water)

    Figure 1: Schematic diagram of pulse-based electron-photon and solution interface process
   Bipolar pulse of fixed ON/OFF time was being controlled by the pulse DC power
controller (SPIK2000A-20, MELEC GmbH; Germany). Input DC power was provided by
SPIK2000A-20. Symmetric-bipolar mode of pulse power controller was employed, and
equal time periods of pulses were set: ton (+/-) = 10 µsec and toff (+/-) = 10 µsec. The
input power slightly fluctuated initially. Fluctuation of input power was the maximum at
the start of the process, dropped to nearly half in a second and remained almost stable

                                                              6
in the remaining period. The splitting of inert gas atoms was automatically adjusted at
the outer end forming the light glow. The light glow formed by the combined population
(density) of travelling photons and splitted electrons (and electron streams) carrying
photons per unit volume at the bottom of copper capillary. The stable value of the
voltage was 32 volts where current reading was noted 1.3 amp. The power was
enhanced ~40 times under the application of step-up transformer. The variation of input
power was noticed within 1 % to execute a new experiment processing different
precursor concentration.
Temperature of the solution was recorded with laser-controlled temperature meter
(CENTER, 350 Series). In each experiment, temperature was measured at the start
(~20°C), middle (~27°C) and at the end (~37°C) of the process with ± 1°C accuracy.
Different molar concentrations were prepared (~0.05 mM, ~0.10 mM, ~0.30 mM, ~0.60
mM, ~0.90 mM and ~1.20 mM), where duration of the process was set 10 minutes in
each experiment. Total Argon gas flow rate was determined to be 100 sccm, which was
maintained by mass flow controller passing through the copper capillary for ignition.
Different molar concentrations were also prepared (~0.07 mM, ~0.10 mM, ~0.30 mM
and ~0.60 mM) at 50 sccm Argon gas flow rate, where other parameters were kept the
same as in the case of processing solutions at 100 sccm Argon gas flow rate.
Copper grid covered by carbon film was used and samples were prepared by dip-
casting. Samples were placed into Photoplate degasser (JEOL EM-DSC30) for ~24
hours to eliminate moisture. Bright field transmission microscope (BF-TM) images,
selected area photons reflection (SAPR) patterns (known as SAED patterns) and high-
resolution transmission microscope (HR-TM) images were taken by the application of
microscope known as HR-TEM (JEOL JEM2100F) while operating at 200 kV.
3. Results and discussion
At precursor concentration 0.05 mM, sphere-shaped and less distorted nanoparticles
developed as shown by different BF-TM images (a-d) in Figure 2. Nanoparticles appear
to have developed due to the coalescences of very small tiny particles. They hardly
show any features of geometrical shapes where they appeal to distorted nanoparticles
mainly.
7Figure 2: (a-d) BF-TM images of nanoparticles showing various less distorted shapes, precursor
concentration 0.05 mM and Argon gas flow rate 100 sccm
In the case of precursor concentration 0.05 mM, the average size of nanoparticle is
between 20 to 25 nm. This indicates that tiny-sized particles developed in the formation
of such nanoparticles only constituted a few gold atoms. But, on increasing the
precursor concentration from 0.05 mM to 0.10 mM, the average size of particles also
grew larger where many of them developed in geometrical shapes as shown by BF-TM
images in Figure 3 (a-c).
8Figure 3: BF-TM images of nanoparticles showing both geometrical and distorted shapes; precursor
concentration 0.10 mM and Argon flow rate 100 sccm
The number of amalgamating atoms per unit area has increased. So, the size of tiny
particle has also increased. Here, tiny particles also developed in triangular shape in a
quite large number. Hence, their assembling under the certain mechanism also resulted
in the development of geometrical-shaped nanoparticles.
At precursor concentration 0.30 mM, the average size of particles having different
geometrical shapes is increased further. The BF-TM images of triangle-, hexagon-,
isosceles trapezoid-, rhombus-, pentagon-, rod- and bar-shaped particles are shown in
Figure 4 (a) & (b). The particles show high aspect ratios and their increase in size is
related to increase in size of tiny particles. As the size of tiny particles having triangular
9shape is increased further, the assembling results in the development of both
nanoparticles and particles.
Figure 4: (a) & (b) BF-TM images of nanoparticles and particles developed in various geometrical
shapes and distorted shapes; precursor concentration 0.30 mM and Argon gas flow rate 100 sccm
Several high aspect ratio shapes are shown by BF-TM images in Figures 5 (a-f)
along with their SAPR patterns in Figure 5 (A-F). Each image shows a unique
geometrical shape of the particle along with SAPR pattern. SAPR patterns of
anisotropic particles indicate one-dimensional (1D) shapes in the case of bar and rod-
shaped particles, whereas multi-dimensional (MD) shapes in the case of triangle and
hexagon-shaped particles. In Figure 5 (g), difference in the lengths of sides of particles
(triangle and hexagon-shaped particles) is within the margin of an atom or few atoms.
This indicates that tiny particles of same size were packed for them. These particles
developed under the equal rate of assembling (packing) tiny-shaped particles to all
sides. In some cases, the particles bind via their sides (Figure 5h), and, in other cases,
they are overlaid by one another (Figure 5i), but they are related to distorted particles.
1011
12
Figure 5: (a-i) BF-TM images of particles showing both geometrical shapes and distorted shapes along
     with SAPR patterns (A-F); precursor concentration 0.60 mM and Argon gas flow rate 100 sccm
   For precursor concentration 0.90 mM, particles of different geometrical shapes are
shown by BF-TM images in Figure 6 (a-h), which indicate the similar features as in the
case of particles (and nanoparticles) developed at precursor concentrations 0.10 mM,
0.30 mM and 0.60 mM. However, particles developed at 0.90 mM possess a low aspect
ratio also. More particles can develop in distorted shapes at precursor concentration
0.90 mM.

                                                13
14
15
Figure 6: BF-TM images of particles showing both geometrical and distorted shapes along with SAPR
           patterns (A-F); precursor concentration 0.90 mM and Argon flow rate 100 sccm
   At 1.20 mM, very large sized tiny particles are packed under the influence of mixed-
behavior forces which results in the development of highly distorted particles as shown
by various BF-TM images in Figure 7 (b-j). Only the particle of hexagonal-shape shows
anisotropy as shown in Figure 7 (a). SAPR patterns of differently-shaped particles show
irregular structure. The spots of photons in the patterns reflected at the surface of
particles (shown in Figures 7a & 7b) covering a few elongated atoms indicate uniform
structural features (shown in Figure 7A and Figure 7B) as the chosen area of each
pattern is only a few square nanometers. However, the elongation of atoms is not
uniform in the case of distorted particles as shown in Figures 7 (c) and 7 (d) where their
structural features are evident that distribution of spotted intensity of reflected photons
at selected area in Figure 7 (C) and Figure 7 (D) is not in the repeated order. The very
large-sized packed tiny particles do not indicate the uniform elongation of their atoms as
the shape of developed particle is distorted which is shown in Figure 7 (d). A flower like
shape of distorted particle is shown in Figure 7 (e) and several particles of identical
features are shown in Figure 7 (i). In Figure 7 (e), an average size of tiny particle is 50
nm, which causes development of highly distorted particles where they have the highly
disordered structure.

                                               16
17
18
Figure 7: (a-j) BF-TM images of particles showing distorted particles (except in ‘a’)/ SAPR patterns (A-
                  D); precursor concentration 1.20 mM and Argon flow rate 100 sccm
   In SAPR patterns of particles, shapes other than rod or bar having distance between
parallel printed intensity spots of ~0.24 nm are labeled in Figures 5 (A-C), Figure 6 (B)
and Figure 7 (A). On the other hand, the distance between parallelly printed intensity
spots (which are now intensity lines) in the case of rod (or bar)-shaped particles is ~0.27
nm as shown in Figure 5 (F) and in Figure 6 (E). A separate study has discussed the
cause of printing intensity spots of reflected photons in the shape of lines for particles of
1D shapes and in the shape of dots for particles of MD shapes [43].
   The colors of processed solutions at different molarities of precursor concentration
are shown in Figure 8 (left to right: 0.05 mM, 0.10 mM, 0.30 mM, 0.60 mM, 0.90 mM
and 1.20 mM). Besides 100 sccm, solutions were also processed at 50 sccm Argon gas
flow rate and their colors are shown in Figure 9 (left to right: 0.07 mM, 0.10 mM, 0.30
mM and 0.60 mM). A different color of each solution is related to the overall size and
shape of particles along with their quantity. Appearance of distinctive color of a colloidal
solution processed at different molar concentration is related to the scheme of inter-
state electron gaps of elongated atoms processed by structures of smooth elements of
different shapes particles and the number of their overall quantity. These require further
investigations at a large scale.

                                                  19
Figure 8: Different color of solutions processed under different molar concentration of precursor (0.05
mM, 0.10 mM, 0.30 mM, 0.60 mM, 0.90 mM and 1.20 mM, left to right) and Argon flow rate 100 sccm
Figure 9: Different color of solutions processed under different molar concentration of precursor (0.07
mM, 0.10 mM, 0.30 mM and 0.60 mM, left to right) and Argon flow rate 50 sccm
The BF-TM images of their nanoparticles and particles are shown in Figures 10-13.
Distorted particles as well as anisotropic particles developed at 50 sccm show identical
features to the ones developed at 100 sccm. The nanoparticles and particles developed
at different concentrations of gold solution when processed at 50 sccm Argon gas flow
rate retain their shapes as in the case of nanoparticles and particles developed at 100
sccm Argon gas flow rate. Many of the nanoparticles developed in the form of
geometrical shapes at precursor concentration 0.07 mM as shown in Figure 10 (a-c), in
different BF-TM images.
20Figure 10: BF-TM images of nanoparticles showing both geometrical and distorted shapes; precursor
concentration 0.07 mM and Argon flow rate 50 sccm
The number of nanoparticles and particles having geometrical shapes is further
increased at precursor concentration 0.10 mM. As shown in Figure 11 (a-d), there are
many nanoparticles and particles which developed in geometrical shapes.
Nanoparticles of very small size and very large size are found in a large number as
shown in Figure 11 (a) and Figure 11 (c).
21Figure 11: BF-TM images of nanoparticles showing both geometrical and distorted shapes; precursor
concentration 0.10 mM and Argon flow rate 50 sccm
The size of nanoparticles and particles is increased further when higher
concentration of gold solution is processed where both anisotropic and distorted
particles developed as shown in Figure 12 (a-c). Distorted nanoparticles and particles
are assembled to an anisotropic particle to fill the vacant space through available forces
as shown in Figure 12 (a). Both distorted nanoparticles and particles are assembled
also to fill their vacant regions due to the mixed-behaviors of conceivably available
forces as shown in Figure 12 (c).
22Figure 12: BF-TM images of nanoparticles and particles showing both geometrical and distorted
shapes; precursor concentration 0.30 mM and Argon flow rate 50 sccm
Different BF-TM images of nanoparticles and particles developed at 50 sccm Argon
gas flow rate when the precursor concentration was 0.60 mM as shown in Figure 13.
Some of the nanoparticles and particles developed having precision of an atom in their
sides, or a few atoms, for example, a triangle-shaped particle shown in Figure 13 (g).
The different hexagon-shaped nanoparticles (or particles) shown in Figure 13 (c) also
indicate the lengths of their sides in highly controlled precision.
2324
Figure 13: BF-TM images of particles showing both geometrical and distorted shapes; precursor
                       concentration 0.60 mM and Argon gas flow rate 50 sccm
   Several different shapes of nanoparticles and particles are shown in Figure 14 (a).
HR-TM image of one vertex of a triangle-shaped nanoparticle encircled in Figure 14 (a)
was captured. The magnified view of that HR-TM image is shown in Figure 14 (b). In
this image, width of elongated atoms of each array made in a structure of smooth
element is ~0.12 nm. Nearly same is the case with their inter-spacing distance (~0.12
nm), which is also shown in Figure 14 (b). Both width and inter-spacing distance are
measured with original scale marker.

 Figure 14: (a) BF-TM image of nanoparticles showing both geometrical and distorted shapes and (b)
magnified HR-TM image taken from the one vertex of encircled triangle in ‘a’ shows nearly equal width of

                                                  25
each structure of smooth element and inter-spacing distance (approx.); precursor concentration 0.10 mM
and Argon gas flow rate 50 sccm
A structure of smooth element develops when transitional state atoms in array
remain bound while elongating at the same rate from both sides of centers under
exertion of force to their electrons along the opposite poles [34]. So, the structures of
smooth elements are mainly related to the tiny particles having their triangular shapes.
Elongation of single gold atom is discussed under the equal rate along the both sides
(poles) from its center [31]. In the elongation of an atom, electrons of both sides from
their (atom) center orientate from the lateral orientation to the adjacent orientation [39].
Nanoparticles and particles that developed at Argon gas flow rate of 50 sccm show
intensive contrast in terms of dark color as compared to different featured nanoparticles
and particles synthesized at Argon gas flow rate of 100 sccm. This is more relevant to
elongation of atoms in different tiny-shaped particles developing nanoparticles and
particles of geometrical shapes. At Argon gas flow rate of 50 sccm, elongation rate of
gold atoms is slightly less (at sub-angstrom level) due to lower concentration of flowing
Argon gas. Therefore, splitted electron streams of flowing inert gas atoms (under lower
concentration) impinge on the underneath matter (gold atoms) at a lower rate. However,
due to the entrance of less population (density) of photons and electron streams
(resulted under splitted flowing inert gas atoms) in the solution, the average size of
nanoparticles and particles also becomes smaller as compared to those developed at
100 sccm Argon gas flow rate. Under different Argon gas flow rate, it is expected that
inter-state electron gaps of elongated atoms of structures of smooth elements of
nanoparticles and particles varies within sub-angstrom (≤ 0.10 Å). This difference is
because of less and more elongations of the atoms of their structures of smooth
elements. In addition to that, anisotropic nanoparticles and particles developed at 100
sccm Argon gas flow rate can have less circular shape of printed white spots of intensity
in their SAPR patterns as compared to anisotropic nanoparticles and particles
developed at 50 sccm Argon gas flow rate. Generally, nanoparticles and particles
developed at 50 sccm Argon gas flow rate have original black texture of their surfaces in
BF-TM images, whereas those developed at 100 sccm show only black texture of their
surfaces in BF-TM images.
26It is observable in the BF-TM images of nanoparticles and particles developed at 50
sccm and 100 sccm Argon gas flow rate that they reveal not only a bit difference in size,
but also in the solutions with different colors. So, by varying the inter-state electron gaps
of elongated gold atoms (or by atoms of other suitable elements), it is possible to
activate the underlying science of different colors. However, many studies are required
to investigate the influence of different Argon flow rates on the structures and, ultimately,
on their shapes and sizes also. This will possibly depict the overall picture of splitting
light into different colors through different colloidal matters processed under different
conditions.
Packing trends of tiny-shaped particles can be depicted and drawn from their
differently developed anisotropic particles. Assembling angles can be extracted from the
distributed intensity spots in SAPR patterns of their particles. In Figure 6 (C), SAPR
pattern indicates that spotted spots reflected at the front surfaces are at a certain pace
where photons (not electrons) reflected from the structures of smooth elements of
above positioned particle (hexagon-shaped particle) as well as the underneath one
(hexagon-shaped particle); in latter case, photons reflected at the surface of underlying
structure while entering through the inter-spacing distance of structures of smooth
elements of above positioned particle. Each structure of smooth element in both
hexagonal-shaped particles was related to the elongated atoms of array.
On amalgamation of atoms at set precursor concentration, they developed in
different tiny-sized particles under the supply of packets of nano-energy. At the lowest
concentration of precursor (0.05 mM), very few gold atoms were available at the
solution surface. However, the packet of each nano-energy possesses the same size
and shape under set tuned ratio of pulse OFF to ON time as given in the section of
experimental details. The atoms underneath packets of nano-energy are insufficient to
form their reasonable sizes. Their average size remained ~1.3 nm with no specific
geometry. Atoms of assembly do not form compact monolayer at air-solution interface.
Thus at 0.05 mM (and when ratio of pulse OFF to ON time =1), atoms do not develop
tiny particles in a triangular shape (Figure 15a1) because atoms do not align for arrays
of their tiny clusters. Thus, they do not elongate for developing structures of smooth
elements as shown in Figure 15 (a2). They are packed under the exertion of force in
27mixed-behavior. This results in the development of less distorted or sphere-shaped
nanoparticle as shown in Figure 15 (a3).
(d)
(a)
(3) (2) (1)
(b)
(e)
(3) (2) (1)
(c)
(3) (2) (1)
Figure 15: (a1) less disordered tiny particles, (a2) deformation of atoms of ‘less disordered tiny
particles’, (a3) less distorted particle, (b1) moderately disordered tiny particle, (b2) deformation of atoms of
‘moderately disordered tiny particle’, (b3) partially distorted particle, (c1) highly disordered tiny particle, (c2)
deformation of atoms of ‘highly disordered tiny particle’, (c3) highly distorted particle, (d) development of
particle in a triangular shape having the MD shape in the region of three dimensions and (e) development
of particle in a hexagonal shape having the MD shape in the region of six dimensions
At fixed bipolar pulse ON/OFF time while increasing the precursor concentration
from ~0.07 mM to ~0.90 mM, many tiny particles developed in a triangular shape. Their
size increased on increasing precursor concentration. However, for intermediate
precursor concentrations (~0.07 nm to ~0.90 mM), tiny-sized particles also developed in
a non-triangular shape in certain regions of the solution. They are termed as moderately
disordered tiny particles as shown in Figure 15 (b1). Such tiny particles do not deal with
packing under exertion of force in a uniform manner. Thus, not all the atoms of such tiny
particle elongate uniformly. They are termed as moderately distorted tiny particles as
sketched in Figure 15 (b2). So, such tiny particles packed under exertion of force in a
non-uniform manner. Their packing developed partially distorted nanoparticles and
particles as shown in Figure 15 (b3).
28At 1.20 mM, precursor concentration is very large, and assembly developed at
solution surface does not deal with the ordering of gold atoms from the start of the
process. Due to the higher amount of gold atoms on solution surface, it resulted in the
development of an assembly of disorderliness instead of perfect monolayer. However,
the packets of nano-energy owned their same size and shape as in the case of
processing solutions of lower concentration. Therefore, at initial stage of the process, all
the developed tiny-sized particles are highly disordered as they are quite large. The
highly disordered tiny particles do not develop in a triangular shape. Hence, their
structures do not undertake arrays of atoms. A highly disordered tiny particle is shown
in Figure 15 (c1) where groups of atoms (total atoms: 171) configured along different
sides. Thus, atoms of highly disordered tiny particle elongated and deformed along the
different orientations where forces exerted along the poles of electrons were in a highly
non-uniform manner. Deformation of atoms of ‘highly disordered tiny particle’ in different
orientations is shown in Figure 15 (c2). Such large-sized tiny particles do not pack under
the uniform exertion of force to electrons. The packing and assembling of such highly
distorted tiny particles developed a highly distorted particle as shown in Figure 15 (c3).
Particles of different geometrical shapes developed one at a time. They developed
at the center of light glow on solution surface in the course to maintain their
development procedure. The shape of particle depends on the number of packing of
tiny-shaped particles at one time arriving from certain regions (zones) of the solution
surface. Both the particles shown in Figure 15 (d) and (e) developed at the center of
light glow. In both cases, packing of tiny-shaped particles remained uninterrupted to
develop structures of smooth elements in the hexagon and triangle-shaped particles. In
the triangle-shaped particle, the orientation of structures of smooth elements for each
face is made at ~120°. As shown in Figure 15 (d), each face of the particle having MD
shape has uniform placement of structures of smooth elements having their equal
widths and inter-spacing distances. This is the case in each composed mono layer of
that particle. The orientation of a structure of smooth element for each face is along the
120° angle, which is regular throughout. The particle constitutes three dimensions. In
the hexagon-shaped particle, the orientation of structures of smooth elements is framed
for six different faces. As shown in Figure 15 (e), each face of the particle of MD shape
29formed its uniform placement of structures of smooth elements by means of required
forced exertions mainly in the surface format and partially in the space and grounded
formats. The orientation of a structure of smooth element for each face is along the 60°
angle, which is regular throughout. That particle belonged to MD shape having its six
dimensions. Thus, the flat region of each face measures approximately one radian.
Here, the width of each structure of smooth element and inter-spacing distance also
remained approximately the same. Thickness of each structure of smooth element
appeared to be the same as that of the resultant width of each elongated gold atoms of
array. Before assembling tiny-shaped particles to nucleate and develop these particles
of MD shapes or 1D shapes, each tiny particle developed in the form of block of joined
triangle-shaped tiny particles under the bipolar pulse, where they separated under the
exertion of force. A detailed study on the separation of joined tiny-shaped particles is
given elsewhere [35], where a structure of smooth element is formed on elongating and
binding atoms of array. A single elongated atom also represents a structure of smooth
element. The shapes of different anisotropic particles deal with their structures having
smooth elements, where they get formed by the less or more elongation of atoms [44];
in MD shapes, atoms elongate more to form smooth elements and in 1D shapes, atoms
elongate less to form smooth elements. So, anisotropic nanoparticles and particles deal
with structures of smooth elements instead of structures of atoms. Therefore, mono
layers of structures of smooth elements form different orientated faces to develop
nanoparticle or particle of 1D shape or MD shape. This is through the precise
assembling of structures of smooth elements belonging to different tiny particles of
triangular shapes.
Under very high concentration of gold precursor (1.20 mM), average size of tiny
particles was 50 nm at the start of the process and on prolonging the process time, tiny
particles resulted in a decreased size as discussed elsewhere [31]. Therefore, the
anisotropic particle shown in Figure 7 (a) is due to the tiny particles of smaller size
developed at the later stage of the process. This indicates that, by increasing the
process duration, the favorable conditions prevailed. The tiny non-triangular shaped
particles changed into triangular shape under the favorable conditions of the process.
Therefore, initial concentration of precursor is not the only parameter controlling the size
30and shape of tiny particles. Size and shape of tiny particles as well as of nanoparticles
and particles depend on time-to-time change in the precursor concentration, too.
Simultaneous assembling of structures of smooth elements of two triangle-shaped
tiny particles at the center of light glow from opposite sides is almost along the same
axis, so they developed a mono layer of developing particles of 1D shapes. A pentagon-
shaped particle and a hexagon-shaped particle are related to five-dimensions and six-
dimensions respectively. However, such dimensional shapes are not possible when
gold atoms result in the emergence of structure in the original format by executing
confined inter-state electron dynamics [34]. So, developing such types of large-shaped
particles showing anisotropy, which are also the part of extensive debate in the
literature, is under the development of tiny-shaped particles.
The approximate percentage of anisotropic and distorted shapes developed at
different molar concentrations of gold is drawn in a chart shape as shown in Figure 16.
As shown in Figure 16, at intermediate range of precursor concentration, many particles
developed in geometrical shapes. They are more than 50% in number as shown in
Figure 16, which is not the case at very low and very high concentrations of solution
where mainly distorted nanoparticles and particles developed in a large number.
However, for the precursor concentrations 0.1 mM and 0.9 mM, approximately 25% and
35% nanoparticles and particles developed in geometrical shapes (in Figure 16). The
average size of both nanoparticles and particles having different features can be
estimated from the side lengths of nanoparticles and particles shown in their respective
figures. For each processed concentration of gold precursor, side lengths of the
resultant nanoparticles and particles are labelled in their respective images. So, it is
convenient to extract (find) the size (average) of nanoparticles and particles for each
molar concentration of gold precursor along with other statistical analyses including
standard deviation.
31100
Anisotropic shapes (approx. %)
Distorted shapes (approx. %)
80
60
40
20
0
0.05 mM 0.10 mM 0.30 mM 0.60 mM 0.90 mM 1.20 mM
Figure 16: Approx. %age of anisotropic and distorted shapes developed at different molar
concentrations of gold precursor while employing pulse-based electron-photon and solution interface
process when fixed duration in each process was 10 minutes and bipolar pulse ON/OFF time was 10
µsec
The mechanism behind the particular morphology in various anisotropic
nanoparticles and particles remained the same with different precursor concentration.
The difference in size is only observed. The assembling orientations of structures of
smooth elements (of different-sized and triangular-shaped tiny particles) remained intact
in the course of developing particular morphology anisotropic nanoparticles and
particles. The attained orientations of packing of tiny-shaped particles for each face of
these nanoparticles and particles, which remained intact during their development, can
be drawn by taking their centers as the reference points. Under normal conditions of
processing molar concentrations in pulse-based electron-photon and solution interface
process, these anisotropic nanoparticles and particles do not involve largely any sort of
interaction to alter the developed features of their morphology due to synchronization of
the process. However, distorted particles may introduce this factor.
Origin of gas and solid atoms has been discussed elsewhere [42]. As per the nature
of atoms of tiny-sized particles, they can be a defective nanomedicine instead of being
an effective one [43]. Gold shapes of one-dimension and multi-dimension clearly identify
32the role of forces at ground surface (in surface format) [44]. Developing hard coating is
nearly under the switched force and energy behaviors of gas and solid atoms [45]. It
has been pointed out that upto certain numbers of atoms, tiny particles developed in
hcp structures [46] and tiny particle size upto a point shows metallic character [47]. It
has been stated that research efforts that are in progress should also consider the
dynamics to explain geometry and entropy in addition to structure [48]. Disordered
jammed configuration is not the only one in any known protocol, but there are also
ordered metrics, which characterize the order of packing [49]. A study on size-controlled
gold nanoparticles synthesized in photochemical process is discussed elsewhere [50].
From the application point of view, nanoparticles and particles having distorted
shapes show potential in various catalytic applications, whereas those in anisotropic
shapes indicate a potential to be used in ultra-high-speed devices along with
applications in diversified areas such as optics, medical and photonic devices, etc.
Therefore, anisotropic nanoparticles and particles of different features enroll their strong
applications for the areas where highly controlled field is the requirement at significant
diligent points. However, nanoparticles and particles of different distorted shapes reveal
their strong applications in various catalytic activities. Gold products in certain sizes and
shapes can be driven for different biological applications, and they can have impactful
societal role.
4. Conclusion
In custom-built pulse-based electron-photon and solution interface process, the
development of anisotropic gold particles is due to the packing of triangle-shaped tiny
particles, where their structures of smooth elements are assembled under the controlled
orientations at electron levels. Tiny-shaped particles arrive from different regions of
solution surface to assemble structures of smooth elements at the center of light glow.
Development of distorted particles is under the coalescences of non-triangular-shaped
tiny particles, where they do not necessarily coalesce at the center of light glow. The
development of tiny particles in different sizes depends on the initial amount of
precursor concentration. A certain amount of precursor concentration under the fixed
ratio of bipolar pulse OFF to ON time results in the development of many tiny particles
33having a triangular shape. Increasing the molar concentration of gold precursor from
0.05 mM to 1.20 mM, average size of tiny particles also increases from 1.3 nm (approx.)
to 50 nm (approx.). At 0.05 mM, tiny-sized particles do not develop in a triangular
shape. Packing of such tiny particles results in the development of less distorted
sphere-shaped nanoparticles. At 0.07 to 0.90 mM, many tiny-sized particles develop in
a triangular shape, but they develop in maximum amount (number) at precursor
concentration 0.30 mM and 0.60 mM. At 1.20 mM; many tiny-sized particles do not
develop in a triangular shape and their packing develops (as a result) distorted particles.
The SAPR patterns of distorted particles show their structure in the disorderliness.
At 0.05 mM precursor concentration, distorted shapes develop that are termed as
distorted or spherical-shaped nanoparticles. At 1.20 mM precursor concentration,
mainly distorted particles having very large size develop. Between 0.05 mM and 1.20 M
precursor concentrations, distorted shapes also develop with the increase in size.
Those shapes are mainly related to distorted nanoparticles or distorted particles. Up to
0.20 mM precursor concentration, developed 1D and MD shapes of gold are related to
nanoparticles. For 0.30 mM precursor concentration, developed 1D and MD shapes of
gold have size both in nanoparticle and particle. For precursor concentration greater
than 0.30 mM, developed 1D and MD shapes have mainly their size limit within the
range of particle.
The decreasing Argon gas flow rate from 100 sccm to 50 sccm does not alter the
morphology of nanoparticles and particles. The change in Argon gas flow rate
influences the electronic structure of elongated atoms of structures of smooth elements
within sub-angstrom. Generally, at 50 sccm Argon gas flow rate, atoms forming
structures of smooth elements of nanoparticles and particles elongated less under the
less orientating electrons adjacently as compared to those developed at 100 sccm
Argon gas flow rate.
The color of solution for each processed molar concentration of gold changes due to
overall impact of the incident light. The modified inter-state electron gaps of elongated
atoms of structures of smooth elements having certain shapes became the main cause
of visible distinctive color of filtered-light while leaving different particles having different
shapes under the impactful scale of an angle.
34Acknowledgements:
Mubarak Ali thanks National Science Council (now MOST) Taiwan (R.O.C.) for
awarding postdoctorship: NSC-102-2811-M-032-008 (August 2013- July 2014). Authors
wish to thank Dr. Kamatchi Jothiramalingam Sankaran, National Tsing Hua University
and Mr. Vic Chen, Tamkang University, Taiwan (R.O.C.) for assisting in TEM operation.
References:
1. Daniel, M–C, Astruc D (2004) Gold Nanoparticles: Assembly, Supramolecular
Chemistry, Quantum-Size-Related Properties, and Applications toward Biology,
Catalysis, and Nanotechnology. Chem. Rev. 104; 293-346.
2. Brust M, Walker M, Bethell D, Schiffrin D J, Whyman R (1994) Synthesis of Thiol-
derivatised Gold Nanoparticles in a Two-phase Liquid-Liquid System. J. Chem. Soc.,
Chem. Commun. 801-802.
3. Whetten RL; Khoury JT, Alvarez MM, Murthy S, Vezmar I, Wang ZL, Stephens PW,
Cleveland, CL, Luedtke WD, Landmanet U (1996) Nanocrystal Gold Molecules. Adv.
Mater. 8; 428-433.
4. Link, S, El-Sayed, MA (2000) Shape and size dependence of radiative, nonradiative
and photothermal properties of gold nanocrystals. Inter. Rev. Phys. Chem. 19; 409-
453.
5. Brown LO, Hutchison JE (2001) Formation and Electron Diffraction Studies of
Ordered 2-D and 3-D Superlattices of Amine-Stabilized Gold Nanocrystals. J. Phys.
Chem. B 105;8911-8916.
6. Whitesides GM, Boncheva M (2002) Beyond molecules: Self-assembly of
mesoscopic and macroscopic components. Proc. Natl. Acad. Sci. U.S.A. 99; 4769-
4774.
7. Brust M, Kiely CJ (2002) Some recent advances in nanostructure preparation from
gold and silver particles: a short topical review. Colloids and Surfaces A:
Physicochem. Eng. Aspects 202; 175-186.
8. Huang J, Kim F, Tao AR, Connor S, Yang P (2005) Spontaneous formation of
nanoparticle stripe patterns through dewetting. Nat. Mater. 4; 896-900.
359. Glotzer SC, Horsch MA, Iacovella CR, Zhang Z, Chan ER, Zhang X (2005) Self-
assembly of anisotropic tethered nanoparticle shape amphiphiles. Curr. Opin.
Colloid Interface Sci. 10;287-295.
10. Glotzer SC, Solomon MJ (2007) Anisotropy of building blocks and their assembly
into complex structures. Nature Mater. 6; 557-562.
11. Shaw CP, Fernig DG, Lévy R (2011) Gold nanoparticles as advanced building
blocks for nanoscale self-assembled systems. J. Mater. Chem. 21; 12181-12187.
12. Vanmaekelbergh D (2011) Self-assembly of colloidal nanocrystals as route to novel
classes of nanostructured materials. Nano Today 6;419-437.
13. Liu N, Tang ML, Hentschel M, Giessen H, Alivisatos AP (2011) Nanoantenna-
enhanced gas sensing in a single tailored nanofocus. Nat. Mater. 10; 631-637.
14. Mulvaney P (1996) Surface Plasmon Spectroscopy of Nanosized Metal Particles.
Langmuir 12: 788-800.
15. Lofton C, Sigmund W (2005) Mechanisms controlling crystal habits of gold and silver
colloids. Adv. Funct. Mater. 15; 1197-1208.
16. Tao A, Sinsermsuksakul P, Yang P (2006) Polyhedral Silver Nanocrystals with
Distinct Scattering Signatures. Angew. Chem. Int. Ed. 45; 4597-4601.
17. Millstone JE, Hurst SJ, Métraux GS, Cutler JI, Mirkin CA (2009) Colloidal Gold and
Silver Triangular Nanoprisms. Small 5; 646-664.
18. Cuffari B (2019) Does the Structure of Gold Nanoparticles Change with Different
Dopants? https://www.azonano.com/article.aspx?ArticleID=5142
19. Mariotti D, Patel J, Švrček V, Maguire P (2012) Plasma –Liquid Interactions at
Atmospheric Pressure for Nanomaterials Synthesis and Surface Engineering.
Plasma Process. Polym. 9; 1074-1085.
20. Patel J, Něemcová L, Maguire P, Graham WG, Mariotti D (2013) Synthesis of
surfactant-free electrostatically stabilized gold nanoparticles by plasma –induced
liquid Chemistry. Nanotechnology 24;245604-14.
21. Huang X, Li Y, Zhong X (2014) Effect of experimental conditions on size control of
Au nanoparticles synthesized by atmospheric microplasma electrochemistry.
Nanoscale Research Lett. 9; 572-578.
3622. Saito N, Hieda J, Takai O (2009) Synthesis process of gold nanoparticles in solution
plasma. Thin Solid Films 518; 912-917.
23. Furuya K, Hirowatari Y, Ishioka T, Harata A (2007) Protective Agent-free Preparation
of Gold Nanoplates and Nanorods in Aqueous HAuCl4 Solutions Using Gas–Liquid
Interface Discharge. Chem. Lett. 36; 1088-1089.
24. Hieda J, Saito N, Takai O (2008) Exotic shapes of gold nanoparticles synthesized
using plasma in aqueous solution. J. Vac. Sci. Technol. A 26;854-856.
25. Shirai N, Uchida S, Tochikubo F (2014) Synthesis of metal nanoparticles by dual
plasma electrolysis using atmospheric dc glow discharge in contact with liquid. Jpn.
J. Appl. Phys. 53; 046202-07.
26. Baba K, Kaneko T, Hatakeyama R (2009) Efficient Synthesis of Gold Nanoparticles
Using Ion Irradiation in Gas–Liquid Interfacial Plasmas. Appl. Phys. Exp. 2;035006-
08.
27. Liu Y, Zhang X (2011) Metamaterials: a new frontier of science and technology.
Chem. Soc. Rev. 40; 2494-2507.
28. Kuzyk A, et al. (2012) DNA-based self-assembly of chiral plasmonic nanostructures
with tailored optical response. Nature 483; 311-314.
29. Kim J, Lee Y, Sun S (2010) Structurally ordered FePt nanoparticles and their
enhanced catalysis for oxygen reduction reaction. J. Am. Chem. Soc. 132; 4996-
4997.
30. Kusada K, et al. (2013) Discovery of face-centered-cubic ruthenium nanoparticles:
facile size-controlled synthesis using the chemical reduction method. J. Am. Chem.
Soc.135; 5493-5496.
31. Ali, M., Lin, I –N. (2019) Effects of the Electronic Structure, Phase Transition and
Localized Dynamics of Atoms in the Formation of Tiny Particles of Gold.
http://arxiv.org/abs/1604.07144
32. Ali M. (2019) Atoms of None of the Elements Ionize While Atoms of Inert Behavior
Split by Photonic Current. http://arxiv.org/abs/1611.05392
33. Ali M. (2017) Heat and Photon Energy Phenomena: Dealing with Matter at Atomic
and Electronic Levels. http://www.preprints.org/manuscript/201701.0028
3734. Ali M. (2019) Structure Evolution in Atoms of Those Elements Executing Confined
Inter-State Electron Dynamics. http://arxiv.org/abs/1611.01255
35. Ali M. (2019) Tiny-Shaped Particles Developing Mono Layer Shape Dealing with
Localized Gravity at Solution Surface. http://arxiv.org/abs/1609.08047
36. Ali M, Lin I –N. (2019) Phase transitions and critical phenomena of tiny grains
carbon films synthesized in microwave‐based vapor deposition system. Surf.
Interface Anal. 51; 389-399.
37. Ali M, Ürgen M (2017) Switching dynamics of morphology-structure in chemically
deposited carbon films-a new insight. Carbon, 122; 653-663.
38. Ali M, Lin, I –N, Yeh, C -Y. (2018) Tapping Opportunity of Tiny-Shaped Particles and
Role of Precursor in Developing Shaped Particles. NANO 13 (7), 1850073 (16 pp).
39. Ali M, Lin, I –N. (2019) Controlling Morphology-Structure of Gold Tiny Particles,
Nanoparticles and Particles at Different Pulse Rates and Pulse Polarity. Adv. Nat.
Sci.: Nanosci. Nanotechnol. 10, 025015 (14 pp).
40. Ali M, Lin, I –N. Formation of tiny particles and their extended shapes: origin of
physics and chemistry of materials. Appl. Nanosci. 9 (2019)
https://doi.org/10.1007/s13204-018-0937-z
41. Ali, M, Lin, I –N, Yeh, C –J. Predictor Packing in Developing Unprecedented
Shaped Colloidal Particles. NANO 13 (9) (2018) 1850109 (15 pages).
42. Ali, M. (2019) Atoms in Gaseous and Solid States.
https://www.researchgate.net/publication/323723379
43. Ali, M. (2018) Nanoparticles-Photons: Effective or Defective Nanomedicine. J.
Nanomed. Res. 5(6); 241-243.
44. Ali, M, Lin, I –N. (2019) Nucleation and Structural Identification in Gold Particles of
High Aspect Ratios through Mechanistic Approach.
https://www.researchgate.net/publication/329066950
45. Ali, M, Hamzah, E, Toff, M R M. (2019) Hard Coating Deposits: Incompatible
Working Energy and Forced Behaviors of Gas and Solid Atoms.
https://www.preprints.org/manuscript/201802.0040
3846. Negishi Y, et al. (2015) A Critical Size for Emergence of Nonbulk Electronic and
Geometric Structures in Dodecanethiolate-Protected Au Clusters. J. Am. Chem.
Soc. 137; 1206-1212.
47. Moscatelli A (2015) Gold nanoparticles: Metallic up to a point. Nature Nanotechnol.
DOI:10.1038/nnano.2015.16.
48. Manoharan, V N (2015) Colloidal matter: Packing, geometry, and entropy, Science
349; 1253751.
49. Atkinson S, Stillinger, F H, Torquato S (2015) Existence of isostatic, maximally
random jammed monodisperse hard-disk packings, Proc. Natl. Acad. Sci. U.S.A.
111; 18436-18441.
50. Kim, J -H, Lavin, B W, Burnett, R D, Boote, B W (2011) Controlled synthesis of gold
nanoparticles by fluorescent light irradiation, Nanotechnology 22; 285602.
Authors’ biography:
Mubarak Ali graduated from University of the Punjab with BSc (Phys & Maths) in 1996 and MSc
Materials Science with distinction from Bahauddin Zakariya University, Multan, Pakistan (1998); his
thesis work completed at Quaid-i-Azam University Islamabad. He gained PhD in Mechanical
Engineering from the Universiti Teknologi Malaysia under the award of Malaysian Technical
Cooperation Programme (MTCP;2004-07) and postdoc in advanced surface technologies at Istanbul
Technical University under the foreign fellowship of The Scientific and Technological Research Council
of Turkey (TÜBİTAK, 2010). He completed another postdoc in the field of nanotechnology at the
Tamkang University Taipei (2013-2014) sponsored by National Science Council now M/o Science and
Technology, Taiwan (R.O.C.). Presently, he is working as Assistant Professor on tenure track at
COMSATS University Islamabad (previously known as COMSATS Institute of Information Technology),
Islamabad, Pakistan (since May 2008) and prior to that worked as assistant director/deputy director
at M/o Science & Technology (Pakistan Council of Renewable Energy Technologies, Islamabad, 2000-
2008). He was invited by Institute for Materials Research, Tohoku University, Japan to deliver
scientific talk. He gave several scientific talks in various countries. His core area of research includes
materials science, physics & nanotechnology. He was also offered the merit scholarship for the PhD
study by the Government of Pakistan, but he did not avail himself of the opportunity. He also earned
Diploma (in English language) and Certificate (in Japanese language) in 2000 and 2001 respectively, in
part-time from the National University of Modern Languages, Islamabad. He is the author of several
articles available at following links; https://scholar.google.com.pk/citations?hl=en&user=UYjvhDwAAAAJ,
https://www.researchgate.net/profile/Mubarak_Ali5, https://www.mendeley.com/profiles/mubarak-ali7/, &
https://publons.com/researcher/2885742/mubarak-ali/publications/
39You can also read