Low- and high-thermogenic brown adipocyte subpopulations coexist in murine adipose tissue
←
→
Page content transcription
If your browser does not render page correctly, please read the page content below
The Journal of Clinical Investigation RESEARCH ARTICLE
Low- and high-thermogenic brown adipocyte
subpopulations coexist in murine adipose tissue
Anying Song,1 Wenting Dai,1 Min Jee Jang,2 Leonard Medrano,3 Zhuo Li,4 Hu Zhao,5 Mengle Shao,6 Jiayi Tan,1 Aimin Li,7
Tinglu Ning,1 Marcia M. Miller,4 Brian Armstrong,8 Janice M. Huss,1 Yi Zhu,9 Yong Liu,10 Viviana Gradinaru,2 Xiwei Wu,11
Lei Jiang,1,12 Philipp E. Scherer,6 and Qiong A. Wang1,12
Department of Molecular & Cellular Endocrinology, Diabetes & Metabolism Research Institute, City of Hope Medical Center, Duarte, California, USA. 2Division of Biology and Biological Engineering,
1
California Institute of Technology, Pasadena, California, USA. 3Department of Translational Research & Cellular Therapeutics, Diabetes & Metabolism Research Institute, and 4Electron Microscopy and
Atomic Force Microscopy Core, Beckman Research Institute, City of Hope Medical Center, Duarte, California, USA. 5Department of Restorative Sciences, School of Dentistry, Texas A&M University, Dallas,
Texas, USA. 6Touchstone Diabetes Center, University of Texas Southwestern Medical Center, Dallas, Texas, USA. 7Pathology Core of Shared Resources and 8Light Microscopy Digital Imaging Core, Beckman
Research Institute, City of Hope Medical Center, Duarte, California, USA. 9Children’s Nutrition Research Center, Department of Pediatrics, Baylor College of Medicine, Houston, Texas, USA. 10Hubei Key
Laboratory of Cell Homeostasis, College of Life Sciences, Institute for Advanced Studies, Wuhan University, Wuhan, China. 11Integrative Genomics Core and 12Comprehensive Cancer Center, Beckman Research
Institute, City of Hope Medical Center, Duarte, California, USA.
Brown adipose tissue (BAT), as the main site of adaptive thermogenesis, exerts beneficial metabolic effects on obesity and
insulin resistance. BAT has been previously assumed to contain a homogeneous population of brown adipocytes. Utilizing
multiple mouse models capable of genetically labeling different cellular populations, as well as single-cell RNA sequencing
and 3D tissue profiling, we discovered a brown adipocyte subpopulation with low thermogenic activity coexisting with the
classical high-thermogenic brown adipocytes within the BAT. Compared with the high-thermogenic brown adipocytes,
these low-thermogenic brown adipocytes had substantially lower Ucp1 and Adipoq expression, larger lipid droplets, and
lower mitochondrial content. Functional analyses showed that, unlike the high-thermogenic brown adipocytes, the low-
thermogenic brown adipocytes have markedly lower basal mitochondrial respiration, and they are specialized in fatty
acid uptake. Upon changes in environmental temperature, the 2 brown adipocyte subpopulations underwent dynamic
interconversions. Cold exposure converted low-thermogenic brown adipocytes into high-thermogenic cells. A thermoneutral
environment had the opposite effect. The recruitment of high-thermogenic brown adipocytes by cold stimulation is not
affected by high-fat diet feeding, but it does substantially decline with age. Our results revealed a high degree of functional
heterogeneity of brown adipocytes.
Introduction ingly, some previous studies have indicated that thermogenesis
Brown adipose tissue (BAT) is a thermogenic organ that is thought is not uniformly activated in all brown adipocytes. For instance,
to play an important role in human energy homeostasis (1–3). brown adipocytes have been shown to have a heterogeneous expres-
Upon activation, brown adipocytes within the BAT can function sion of uncoupling protein 1 (UCP1) (15, 16). Moreover, in vitro–
as an effective energy sink, burning and disposing excess lipids cultured brown adipocytes showed heterogeneous mitochondrial
and glucose (4–6). In recent years, progress has been made in membrane potential (17, 18). However, the thermogenic and met-
rodents and humans in understanding the function and physio- abolic heterogeneity of brown adipocytes within the same BAT in
logical impact of BAT. It is now well accepted that recruiting and vivo remains largely uncharacterized.
activating BAT can correct dyslipidemia and prevent obesity-
related metabolic disorders (7–10). Although functional hetero- Results
geneity has recently been reported in white and beige adipocytes Brown adipocytes heterogeneously and dynamically express Adipoq.
within an individual fat depot (11–14), BAT is still viewed to have To better understand brown adipocyte dynamics in vivo, we used
a highly homogeneous population of brown adipocytes. Interest the AdipoChaser-LacZ mouse model we previously developed to
label brown adipocytes. This model is a doxycycline-based (dox-
based), tet-responsive labeling system for the inducible, perma-
Related Commentary: p. 65 nent labeling of adiponectin-expressing (Adipoq-expressing)
cells as LacZ+ cells (Supplemental Figure 1A and refs. 19, 20; sup-
Conflict of interest: The authors have declared that no conflict of interest exists. plemental material available online with this article; https://doi.
Copyright: © 2020, American Society for Clinical Investigation.
org/10.1172/JCI129167DS1). To our surprise, at room tempera-
Submitted: March 29, 2019; Accepted: September 25, 2019;
Published: November 25, 2019.
ture (24°C), despite the uniform labeling of white adipocytes (19,
Reference information: J Clin Invest. 2020;130(1):247–257. 20), only 38% of total brown adipocytes in the BAT were labeled
https://doi.org/10.1172/JCI129167. as LacZ+ (blue) cells, and these cells distribute in a patchy pattern
jci.org Volume 130 Number 1 January 2020 247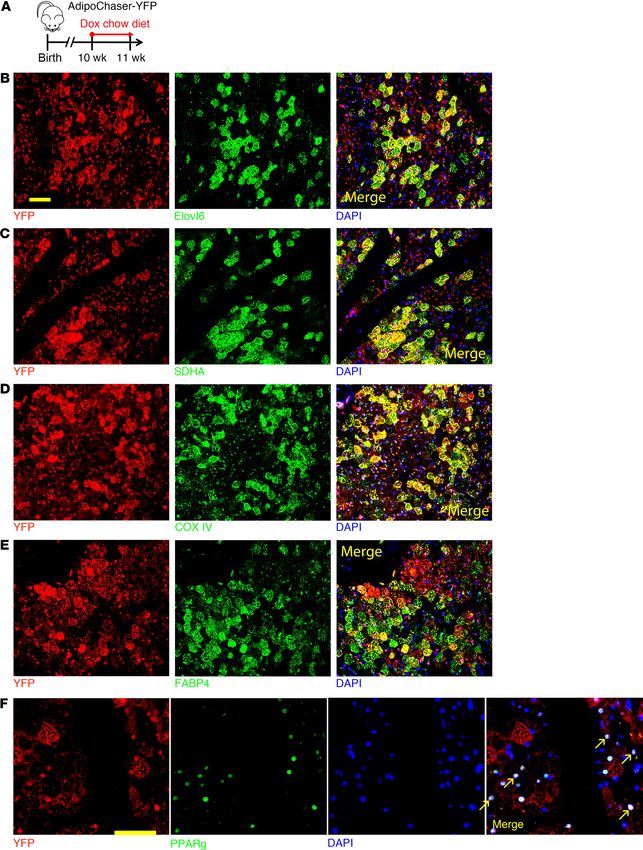
RESEARCH ARTICLE                                                                                          The Journal of Clinical Investigation

Figure 1. Two subpopulations of classical brown adipocytes undergo dynamic interconversions in vivo. (A) Representative X-gal staining of BAT from
AdipoChaser-LacZ mice exposed to different environmental temperatures while fed with dox-containing chow diet. (B) Quantification of the percentage
of LacZ+ brown adipocytes in the total brown adipocytes. n = 8 mice (6°C); 6 mice (24°C); 7 mice (30°C). (C–F) Representative X-gal staining of BAT from
AdipoChaser-LacZ mice kept at the indicated temperatures while fed with dox-containing chow diet, followed by regular chow diet feeding at the indicated
temperatures. Scale bars: 100 μm (A, C–F). All data are mean ± SD of biologically independent samples; **P < 0.01. Statistical significance was assessed
using a 1-way ANOVA followed by Tukey’s multiple comparisons test. All images are representative of 3 independent experiments.

(Figure 1, A and B). The percentage of LacZ+ brown adipocytes was             over, we have not seen obvious apoptosis of brown adipocyte by
markedly higher (76%) when mice were housed in a cold environ-                active caspase 3 staining (Supplemental Figure 2, A–D). Therefore,
ment (6°C) and markedly lower (6%) when mice were housed in a                 there are dynamic interconversions between these 2 brown adipo-
thermoneutral environment (30°C) (Figure 1, A and B). However,                cyte subpopulations upon temperature change, and we have no
Adipoq mRNA in the whole BAT was slightly increased when mice                 evidence of significant adipogenesis or cell death.
were at 6°C, and was not altered when mice were in 30°C (Supple-                  The Adipoq low-expressing brown adipocyte subpopulation
mental Figure 1B). When we treated AdipoChaser-LacZ mice with                 has unique subcellular morphology and lower UCP1 expression.
β3-adrenergic receptor agonist to stimulate thermogenesis (Sup-               We subsequently looked into the subcellular structure of these
plemental Figure 1C), we observed a similar percentage of LacZ+               2 brown adipocyte subpopulations through electron micros-
brown adipocytes as was seen upon cold exposure (67%) (Supple-                copy imaging. X-gal, when cleaved by β-galactosidase, pro-
mental Figure 1, D and E).                                                    duces 5,5′-dibromo-4,4′-dichloro-indigo-2, an intense blue
     Is the increase of LacZ+ brown adipocytes during cold expo-              product which is insoluble. Under the electron microscope,
sure due to de novo adipogenesis? And likewise, is the decrease               this blue product can be observed as crystals (21, 22), and the
of LacZ+ brown adipocytes during thermoneutral exposure due to                LacZ+ brown adipocytes can be distinguished by this feature.
cell death? When we prelabeled mice at 24°C and pulse-chased at               Compared with the LacZ+ brown adipocytes (Adipoq high-
6°C or 30°C, the percentages of LacZ+ brown adipocytes (40%)                  expressing), the LacZ – brown adipocytes had markedly lower
remained the same as when they were at 24°C (Supplemental Fig-                mitochondrial number/content and much larger lipid droplets
ure 1, C and D). When we prelabeled mice at 30°C and pulse-chased             (Figure 2, A–D). We then switched to an AdipoChaser-mT/mG
at 6°C, the percentages of LacZ+ brown adipocytes (5%) remained               system we reported recently (refs. 20, 23 and Supplemental Fig-
the same as when they were at 30°C (Figure 1E). Likewise, when                ure 3A), and confirmed that Adipoq is selectively expressed in
we prelabeled mice at 6°C and pulse-chased at 30°C, the per-                  a subpopulation of brown adipocytes in a patchy pattern (Sup-
centages of LacZ+ brown adipocytes (73%) remained the same as                 plemental Figure 3, B and C). In the isolated primary brown
when they were at 6°C (Figure 1F). Meanwhile, body weight, BAT                adipocytes, the GFP – (Adipoq low-expressing) brown adipocytes
weight, and brown adipocyte cell size were not altered when mice              had markedly higher mitochondrial membrane potential (Sup-
were in a cold environment (Supplemental Figure 1, F–H). More-                plemental Figure 3, D–F), indicating that these cells have lower

   248              jci.org   Volume 130   Number 1   January 2020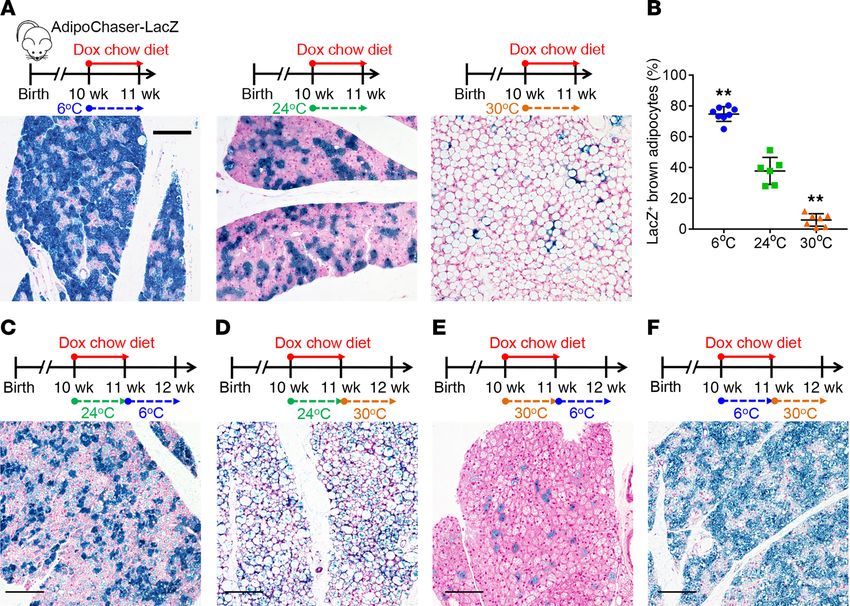
The Journal of Clinical Investigation RESEARCH ARTICLE
Figure 2. The 2 brown adipocyte subpopulations have distinct morphology and Ucp1 expression. (A) Electron micrographs of BAT from mice kept at 6°C.
Arrows: LacZ crystals. Scale bar: 2 μm. (B–D) Quantification of the mitochondria size, number, and lipid droplet size. n = 7 LacZ+ cells for B and C, n = 9
LacZ+ cells for D; n = 10 LacZ– cells for B and C, n = 12 LacZ– cells for D. (E and F) YFP (red), UCP1 (green), and DAPI (blue) immunofluorescence staining of
BAT from AdipoChaser-YFP mice treated with dox-containing chow diet as indicated. Cells with yellow color are double positive with YFP and UCP1. Scale
bars: 50 μm. All data represent mean ± SD of biologically independent samples; **P < 0.01. Statistical significance was assessed using a 2-tailed Student’s
t test (B–D). All images are representative of 3 independent experiments.
mitochondrial membrane depolarization and uncoupling rate ure 3A). These 2 populations differed by the expression level of
(24). We also generated the AdipoChaser-YFP mice (Supple- Ucp1 as well as Adipoq (Figure 3, B and C). Two other clusters
mental Figure 3G), as YFP is relative easier for immunofluores- of cells were identified as white adipocytes (WA, 197 cells) and
cence staining. When we labeled mice in 6°C, the Adipoq high- nonadipocytes (NA, 34 cells) (Figure 3A). The white adipocyte
expressing (YFP+) brown adipocytes largely overlapped with cluster served as an internal control in the subsequent analysis.
UCP1 high-expressing cells (Figure 2E). Thus, Adipoq expres- In the BA-L subpopulation, expressions of genes related to ther-
sion positively correlates with UCP1 protein expression. Overall, mogenesis, such as Cidea, Elovl6, and oxidative phosphorylation
these results suggest that the Adipoq low-expressing brown adi- (OXPHOS) complexes, were extremely low, close, or lower than
pocytes are morphologically and molecularly different from the the white adipocytes in the WA cluster (Figure 3D, Supplemen-
Adipoq high-expressing brown adipocytes. When we prelabeled tal Figure 4, and Supplemental Figure 5, A–E). Similarly, the BA-L
mice at 24°C and pulse-chased at 6°C, there were markedly subpopulation had very low expression levels of genes related to
more UCP1+ cells than YFP+ cells, and most of the prelabeled lipolysis, glycolysis, fatty acid oxidation, and the TCA cycle (Fig-
YFP+ brown adipocytes colabeled as UCP1+ cells (Figure 2F). ure 3E and Supplemental Figure 6, A–C). Moreover, 2 newly iden-
This result confirms that the YFP – brown adipocytes labeled at tified pathways that have been described and may be essential for
24°C could convert into UCP1 high-expressing cells at 6°C. the positive regulation of thermogenesis, ROS (25) and succinate
Molecular heterogeneity between the 2 brown adipocyte subpop- metabolism (26), were also only enriched in the BA-H subpopula-
ulations revealed by single-cell RNA sequencing. We next set out tion (Supplemental Figure 6, D and E). Therefore, brown adipo-
to verify the brown adipocyte heterogeneity through single-cell cytes within the BA-L subpopulation belong to a novel and unique
RNA sequencing (scRNA-seq) of primary brown adipocytes iso- type of brown adipocyte with low thermogenic activity.
lated from the BAT of adult mice housed at 24°C. Two major Notably, the BA-L subpopulation had substantial high expres-
brown adipocyte subpopulations were clustered: brown adipo- sion levels of genes related to fatty acid uptake (Figure 3F and
cytes with high thermogenic activity (BA-H, 2352 cells, which Supplemental Figure 7A). This subpopulation was also enriched
includes 3 subclusters, BA-H1, BA-H2, and BA-H3) and brown for genes that are essential for cell-to-cell trafficking (ref. 27 and
adipocytes with low thermogenic activity (BA-L, 1250 cells) (Fig- Supplemental Figure 7B), as well as UCP1-independent thermo-
jci.org Volume 130 Number 1 January 2020 249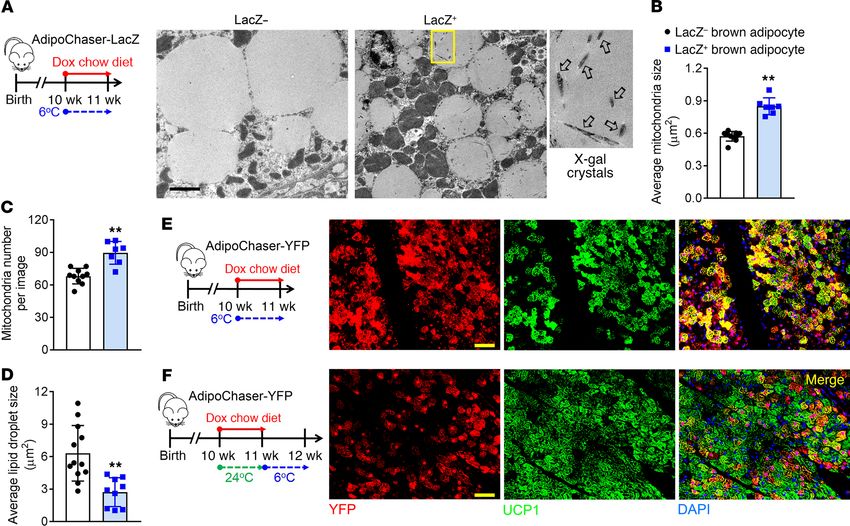
RESEARCH ARTICLE                                                                                             The Journal of Clinical Investigation

Figure 3. Single-cell RNA sequencing confirms the existence of 2 distinct brown adipocyte subpopulations. (A) t-distributed stochastic neighbor
embedding (tSNE) plot of 3602 primary brown adipocytes isolated from 10-week-old WT male mice. Clustering was generated using k-means = 4. These
data are from a single experiment. (B–F) Transcript counts represent log2 of gene expression. Each dot corresponds to one single cell, colored according to
cell cluster. (B) Violin plots showing the distribution of normalized expression values of adiponectin (Adipoq) and Ucp1 across cells that belong to the 5
adipocyte clusters. (C–F) Distribution of the expression of Adipoq and Ucp1 (C), Cidea, Elovl6, Cox7a1, and Ndufa12 (D), Lipe (Hsl) and Pnpla2 (Atgl) (E),
and Fabp4 and Cd36 (F) within tSNE plot.

genesis through the futile cycle of creatine metabolism (28) and                patterns in these 2 subpopulations. Surprisingly, Pparg was
tight junction (Supplemental Figure 7, C and D). Thus, brown adi-               relatively enriched in the BA-L subpopulation (Supplemental
pocytes within the BA-L subpopulation hold a unique metabolic                   Figure 7E), consistent with the expression patterns of its down-
status, and the function of these cells is potentially fundamentally            stream targets Cd36 and Fabp4 (Figure 3F). In contrast, Cebpa
different from the cells within the BA-H subpopulation.                         was enriched in the BA-H subpopulation (Supplemental Figure
    What regulates the functional heterogeneity between the                     7E). These data indicate that these 2 factors may act as upstream
2 brown adipocyte subpopulations? Interestingly, PPARγ (29)                     regulators responsible for the distinct transcriptional profiles of
and C/EBPα (30), the 2 master transcription factors that reg-                   the 2 brown adipocyte subpopulations. As expected, the expres-
ulate adipocyte function (31, 32), have distinct expression                     sion of white adipocyte marker resistin (Retn) (Supplemental

   250               jci.org   Volume 130   Number 1   January 2020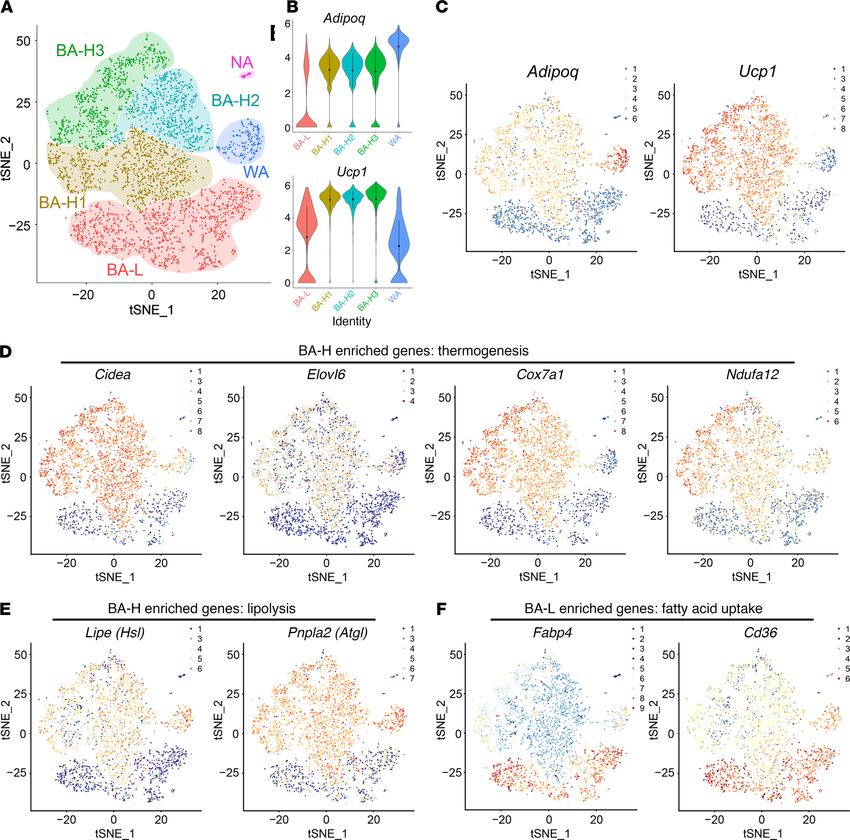
The Journal of Clinical Investigation                                                                RESEARCH ARTICLE

                                                                                                  Figure 4. Immunofluorescence
                                                                                                  costaining of differentially
                                                                                                  expressed genes identified
                                                                                                  through single-cell RNA sequenc-
                                                                                                  ing. (A) AdipoChaser-YFP male
                                                                                                  mice were kept on normal chow
                                                                                                  until 10 weeks of age. Mice were
                                                                                                  then treated with dox-containing
                                                                                                  chow diet for 1 week. (B–F) YFP
                                                                                                  (red) and Elovl6 (green) (B), SDHA
                                                                                                  (green) (C), COXIV (green) (D),
                                                                                                  FABP4 (green) (E), and PPARγ
                                                                                                  (green) (F) immunofluorescence
                                                                                                  staining of BAT from AdipoChaser-
                                                                                                  YFP mice treated with dox-con-
                                                                                                  taining chow diet as indicated.
                                                                                                  Cells with yellow color are merged
                                                                                                  from red and green. Scale bars: 50
                                                                                                  μm. Images are representative of 2
                                                                                                  independent experiments.

Figure 7F) was detected only in the WA cluster. Among the 3     chondrial biogenesis and insulin responsiveness (refs. 33–35
BA-H subclusters, thermogenic genes had the highest expres-     and Supplemental Figure 7H).
sion levels in BA-H3 (Supplemental Figure 4). The subclusters       We next performed immunofluorescence costaining to con-
BA-H1 and BA-H2 were enriched for genes that related to mito-   firm the protein levels of these genes identified through scRNA-

                                                                jci.org   Volume 130   Number 1   January 2020              251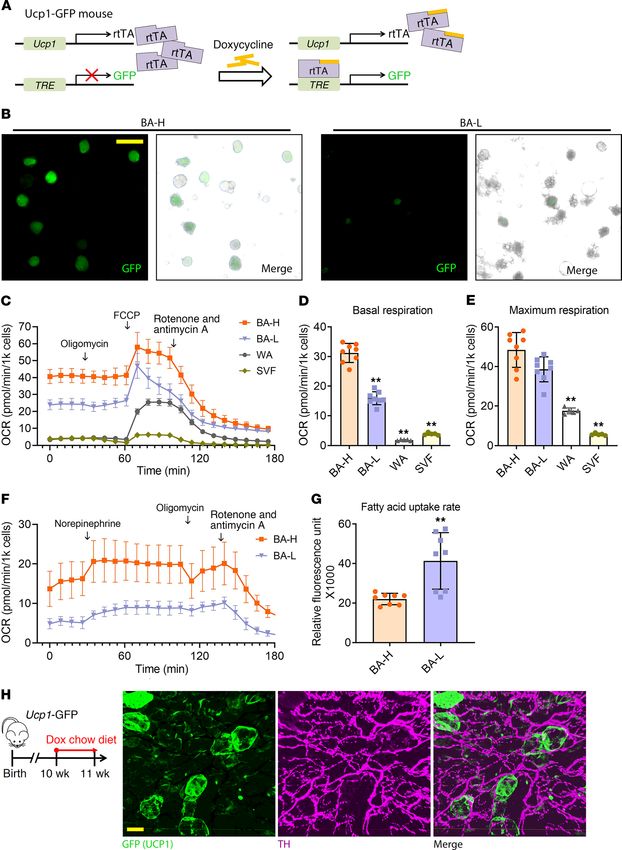
RESEARCH ARTICLE                                           The Journal of Clinical Investigation

 252      jci.org   Volume 130   Number 1   January 2020
The Journal of Clinical Investigation RESEARCH ARTICLE
Figure 5. The brown adipocyte subpopulations have distinct metabolic indicating these brown adipocytes have high mitochondrial poten-
profiles. (A) Ucp1-GFP mice, the inducible real-time labeling system of tial and are readily recruitable (Figure 5E). The BA-H population
Ucp1 promoter activity, derived from interbreeding 2 transgenic strains,
isolated through mild centrifugation contains a low percentage
Ucp1-rtTA and TRE-GFP, which allows inducible real-time labeling of the
Ucp1 promoter activity. At the basal level, Ucp1-GFP mice do not express of SVF. To obtain a purer BA-H population, we isolated the BA-H
GFP in any cell type. When these mice are treated with dox, GFP expres- population from AdipoChaser-mT/mG mice through a magnetic
sion is induced based on the Ucp1 promoter activity. (B) Fluorescent imag- bead-based method, taking advantage of the membrane-bound
es of isolated BA-H and BA-L subpopulations from the BAT of Ucp1-GFP GFP. The OCR levels of both BA-L and BA-H subpopulations
mice. Scale bar: 50 μm. These images are representative of 4 independent
obtained through this alternative method were much lower com-
experiments. (C–E) OCR in freshly isolated primary cells treated with the
different compounds. Primary brown adipocytes (BA-H and BA-L) were pared with the cells obtained through mild centrifugation, which
from male WT mice housed in 6°C for 7 days. As controls, primary white may be due to the much longer processing time involved for the
adipocytes and SVF from BAT were from male WT mice housed at room isolation (Figure 5F). However, the difference in basal OCR is
temperature. (C) Plot of OCR to time measured by Seahorse. (D and E) consistent between the 2 methods (Figure 5, C and F). Moreover,
Calculated basal and maximum respiration levels of different cell types.
both BA-L and BA-H populations showed responses to norepi-
n = 8 mice (BA-H and BA-L); n = 5 mice (WA and SVF). (F) Plot of OCR to
time measured by Seahorse in primary brown adipocytes (BA-H and BA-L) nephrine, but the BA-H population had a more robust increase in
treated with the different compounds. These cells were freshly isolated the OCR (Figure 5F). We also measured the fatty acid uptake rate
from male AdipoChaser-mT/mG mice housed in 6°C for 7 days through in the 2 brown adipocyte subpopulations, and consistent with the
EasySep Magnet (Stem Cell Technologies). (G) Fatty acid uptake rate in the high Fabp4 mRNA and protein level (Figure 3F and Figure 4E),
2 brown adipocyte subpopulations. n = 8 mice (BA-H and BA-L). For each
the BA-L population displayed much higher rates of fatty acid
group, cells from all mice were pooled together, and data represent mean
± SD of experimental replicates, normalized to cell numbers. **P < 0.01. uptake (Figure 5G). This result is consistent with a recent report
Statistical significance was assessed using a 1-way ANOVA followed by that demonstrated that the uptake of nutrients by adjacent murine
Tukey’s multiple comparisons test (D and E), or a 2-tailed Student’s t test brown adipocytes is variable (36). Overall, these results demon-
(G). (H) Ten-week-old Ucp1-GFP mice were treated with dox-containing diet strate that the 2 brown adipocyte subpopulations have fundamen-
for 4 days before tissue harvest. PACT-cleared BAT from Ucp1-GFP mice
tally distinct function and metabolic profiles.
and immunolabeled with GFP (green) and sympathetic neuron marker
tyrosine hydroxylase (TH) (purple) antibody. Scale bar: 30 μm. Images are Sympathetic innervation is not correlated with the distribution
representative of 3 independent experiments. of 2 brown adipocyte subpopulations. We performed 3D profiling
of BAT from the Ucp1-GFP mice housed at 24°C. UCP1+ (GFP+)
brown adipocytes distributed in a patchy pattern (Figure 5H and
Supplemental Video 1), confirming the scRNA-seq result that Ucp1
seq. In the AdipoChaser-YFP mice (Figure 4A), YFP+ cells (Adipoq is also distinctly expressed in different subpopulations of brown
high-expressing brown adipocytes) primarily overlapped with adipocytes. The thermogenesis of brown adipocytes is governed
Elovl6 (Figure 4B) as well as SDHA and COX IV (Figure 4, C and by sympathetic innervation (37). The 3D architecture showed that
D), whereas large numbers of YFP+ brown adipocytes did not compared with the less innervated white adipose tissues (38, 39),
overlap with FABP4 (Figure 4E) or PPARγ (Figure 4F). Thus, the almost every brown adipocyte is heavily innervated with sympa-
protein levels of these important genes match with the expression thetic neurons (Figure 5H and Supplemental Video 1). Thus, the
pattern demonstrated by the scRNA-seq results. diversity in thermogenic activity observed in these 2 brown adi-
Isolation of the 2 brown adipocyte subpopulations reveals their pocyte subpopulations is not determined by sympathetic inner-
distinct metabolic statuses. To test whether the 2 brown adipocyte vation. Notably, the expression level of β3-adrenergic receptor
subpopulations have different mitochondrial respiratory capacity, Adrb3 was enriched in the BA-H subpopulation (Supplemental
we separately collected the 2 freshly isolated brown adipocyte Figure 7G). Therefore, the diverse thermogenic activity may be
subpopulations from BAT through mild centrifugation. With the determined by the difference in the responsiveness of brown adi-
Ucp1-GFP mice, a tet-responsive labeling system under the control pocytes to β3-adrenergic signals.
of the Ucp1 promoter (Figure 5A), isolation and separation were Developmental timing of the 2 brown adipocyte subpopulations.
verified based on the GFP signal intensity (Figure 5B). We first Does BAT emerge developmentally as 2 distinct subpopulations?
measured mitochondrial function through a Mito Stress Test Kit We looked into the Adipoq expression in brown adipocytes during
(Figure 5C). The BA-H, BA-L, white adipocytes, and primary BAT development, by exposing AdipoChaser-LacZ mice to dox diet
stromal vascular fraction (SVF) showed distinct levels of oxygen at various embryonic and postnatal stages (Figure 6A). When we
consumption as judged by the oxygen consumption rate (OCR). exposed mice to dox diet during E3–E10, very few (less than 1%)
As the ATP synthesis rate is relatively low in brown adipocytes brown adipocytes were labeled as LacZ+ cells upon examining the
due to uncoupled respiration, it is not surprising that oligomycin tissue at 4 weeks of age (Figure 6B). When mice were exposed
(ATP synthase inhibitor) did not markedly alter OCR in brown to dox diet during E7–E14, brown adipocytes showed a hetero-
adipocytes, whereas oligomycin decreased OCR by 59% in SVF geneous pattern of LacZ+ cells, with some regions carrying more
and by 20% in white adipocytes (Figure 5C). The basal respiration than 92% and other regions displaying less than 10% LacZ+ signal
in the BA-H population was around 2-fold higher compared with when examined at 4 weeks of age (Figure 6C). When mice were
the BA-L population. Both brown adipocyte subpopulations had exposed to dox diet during E9–E16, brown adipocytes showed uni-
substantially higher basal respiration compared with white adipo- form positive labeling of LacZ+ cells when examined at 4 weeks
cytes and the SVF (Figure 5D). Interestingly, the BA-H population of age (Figure 6D). These observations indicate that brown adipo-
had a maximal respiration rate very close to the BA-L population, cyte differentiation is initiated as early as E10, and that all brown
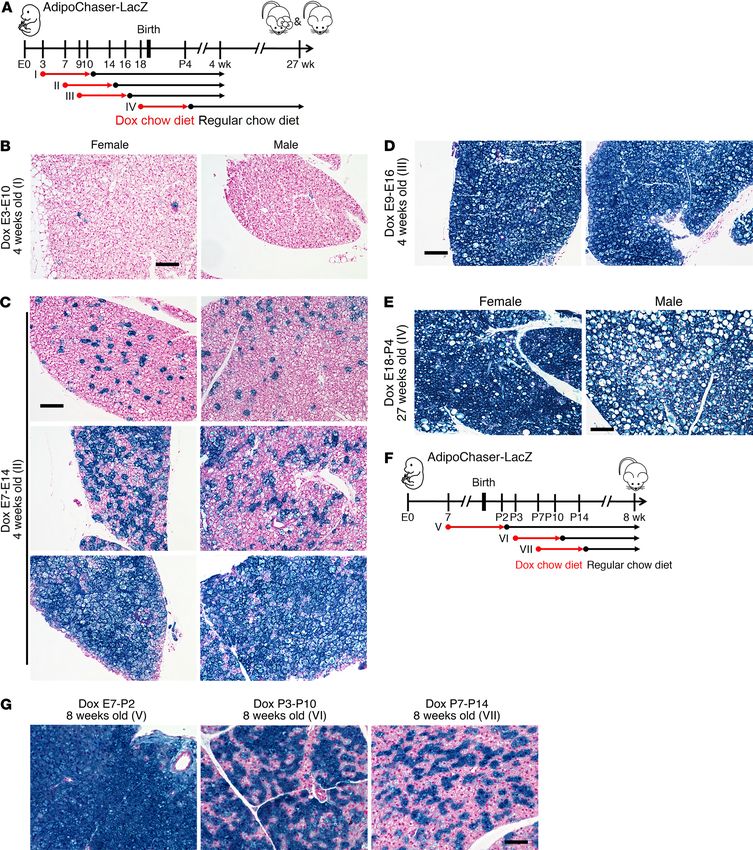
jci.org Volume 130 Number 1 January 2020 253RESEARCH ARTICLE The Journal of Clinical Investigation Figure 6. Brown adipocytes were born as adiponectin high expressors, and heterogeneity establishes after birth. (A) Female mice carrying only Adn-rtTA and Rosa26-loxP-stop-loxP-LacZ were bred with AdipoChaser-LacZ male mice. When these female mice were pregnant, they were exposed to dox- containing chow diet during E3–E10 (I), E7–E14 (II), E9–E16 (III), or E18– P4(IV), and kept on regular chow diet thereafter. Offspring of the female mice were genotyped, and AdipoChaser-LacZ mice of both sexual phenotypes were used for LacZ staining when they were 4 weeks or 27 weeks old. (B–D) Repre- sentative X-gal staining of BAT from 4-week-old AdipoChaser-LacZ mice that were on dox diet for the indicated number of days during development. (E) Representative X-gal staining of BAT from 27-week-old AdipoChaser-LacZ mice that were on dox diet during E18–P4. Scale bars: 100 μm (B–E). (F) Female mice carrying only Adn-rtTA and Rosa26-loxP-stop-loxP-LacZ were bred with AdipoChaser-LacZ male mice. When the female mice were pregnant, they were exposed to dox-containing chow diet during E7–P2 (V), P3–P10 (VI), or P7–P14 (VII), and kept on regular chow diet thereafter. Offspring of the female mice were genotyped, and male AdipoChaser-LacZ mice were used for LacZ staining when they were 8 weeks old. (G) Representative X-gal staining of BAT from the AdipoChaser-LacZ mice that were on dox diet for the indicated number of days during development. Scale bar: 50 μm. All images are representa- tive of 3 independent experiments. 254 jci.org Volume 130 Number 1 January 2020
The Journal of Clinical Investigation RESEARCH ARTICLE
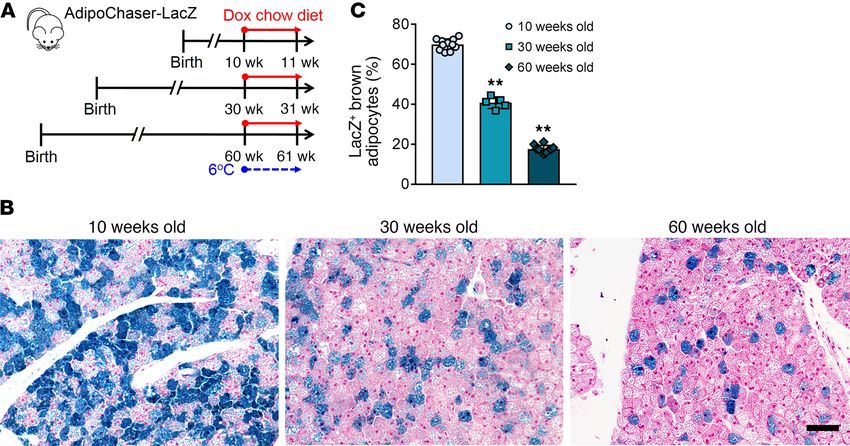
Figure 7. The recruitment of BA-H during cold exposure declines with age. (A) AdipoChaser-LacZ male mice were kept on normal chow until 30 or 60
weeks of age. Mice were then exposed to 6°C for 7 days while treated with dox-containing chow diet. (B) Representative X-gal staining of BAT from mice
of different age exposed to 6°C. Scale bar: 50 μm. (C) Quantification of the percentage of LacZ+ brown adipocytes in the total brown adipocytes. n = 11 mice
(10 weeks old); n = 5 mice (30 weeks old); n = 10 mice (60 weeks old). **P < 0.01. Statistical significance was assessed using a 1-way ANOVA followed by
Tukey’s multiple comparisons test. All images are representative of 3 independent experiments.
adipocytes have initiated differentiation and started to express (23% vs. 12%). Thus, HFD feeding does not impair the recruitment
Adipoq by E16. Thus, adiponectin can be used as a terminal dif- of Adipoq high-expressing brown adipocytes during cold exposure.
ferentiation marker for both brown adipocytes and white adipo- However, even in the chow-fed group, these 21-week-old mice had
cytes (19). At the age of 27 weeks, for the mice that were exposed a markedly lower percentage of LacZ+ brown adipocytes at both
to dox diet during E18–P4, the brown adipocytes continued to 6°C and 24°C compared with 8-week-old mice (Figure 1, A and
display a uniformly positive LacZ labeling (Figure 6E), indicating B), indicating that there is a decline in the number of Adipoq high
that the turnover rate for brown adipocytes is extremely low in the expressers with age. When older mice were housed at 6°C (Figure
adult stage at room temperature. Thus, the Adipoq low-expressing 7A), the percentage of LacZ+ brown adipocytes further dropped
brown adipocytes are not newly generated after birth. to below 40% (30-week-old) and 20% (60-week-old) (Figure 7,
We subsequently narrowed down the time frame during B and C). These results indicate that the ability of BAT to recruit
which the BAT develops heterogeneity through the interconver- Adipoq high-expressing brown adipocytes during cold exposure is
sion (Figure 6F). When AdipoChaser-LacZ mice were exposed to substantially reduced with age.
dox diet during E7–P2, their brown adipocytes showed a uniform
LacZ+ labeling when examined at 8 weeks of age (adult stage) Discussion
(Figure 6G). When mice were exposed to dox diet during P3–P10 We report the discovery of a low-thermogenic brown adipocyte
or P7–P14, 56% or 42% of their brown adipocytes were labeled subpopulation with unique molecular and metabolic features,
as LacZ+ cells, which is close to the percentage at the adult stage coexisting with the classical brown adipocytes in vivo. The results
(38% in Figure 1B). These experiments indicate that the BAT presented here offer critical insight toward our understanding of
transcriptional program becomes heterogeneous shortly after how brown adipose tissue thermogenesis is regulated at the cellu-
birth, and the ratio of Adipoq high-expressing and low-expressing lar level. The discovery of the new low-thermogenic subpopula-
brown adipocytes becomes stable around P7. tion is of great interest since this population of cells does not have
The interconversion of BA-L to BA-H declines with age, but not typical brown adipocyte morphology and displays a unique met-
HFD feeding. It has been suggested that decreased BAT thermo- abolic profile. However, the exact function of this subpopulation
genesis is associated with the accumulation of body fat, as well is largely unknown. These brown adipocytes have relatively large
as age (40–42). Therefore, we checked if high fat diet–induced lipid droplets and low mitochondrial content and an extremely low
(HFD-induced) obesity reduces the interconversion of Adipoq low respiration rate, compared with the high-thermogenic subpopula-
expressers to high expressers during cold exposure (Supplemental tion. Are these brown adipocytes in a resting status and readily
Figure 8, A and B). When AdipoChaser-LacZ mice were housed recruitable to convert into high-thermogenic cells? Or do they
at 6°C, the percentages of LacZ+ brown adipocytes from HFD-fed have critical metabolic functions other than thermogenesis? As
mice (47%) were comparable to brown adipocytes from chow-fed the low-thermogenic brown adipocytes have a much higher rate of
mice (45%) (Supplemental Figure 8, C and D). At 24°C, HFD-fed fatty acid intake, these cells may have an indispensable role for
mice had even higher percentages of LacZ+ brown adipocytes the functional integrity of the thermogenic activity of the whole
jci.org Volume 130 Number 1 January 2020 255RESEARCH ARTICLE The Journal of Clinical Investigation
BAT. The high-thermogenic subpopulation represents the exten- essential to improve our ability to identify effective therapeu-
sively studied classical brown adipocyte subtype, which has the tic approaches for metabolic disorders. Future strategies that
potential ability to further increase Ucp1 expression and ther- promote the low-thermogenic brown adipocytes to convert into
mogenesis upon cold stimulation. It is noteworthy that most of a population of high-thermogenic cells may greatly enhance
the human studies detect BAT based on glucose uptake, as BAT brown adipose tissue thermogenesis, which may have potential
exhibits high uptake of fluorine-18 fludeoxyglucose on positron for the treatment of obesity and diabetes.
emission tomography (PET). This detection method may miss the
lower thermogenic brown adipocytes, which have high fatty acid Methods
uptake rate. Detailed methods are in the Supplemental Material.
Adiponectin is considered a white adipocyte marker since it The scRNA-seq data have been deposited in NCBI Gene Expres-
is more abundantly expressed in the white adipocyte. However, sion Omnibus database (accession number GSE125269).
it is not surprising to observe a higher Adipoq expression in the Statistics. The results are mean ± SD. Differences were analyzed
high-thermogenic brown adipocytes, as adiponectin positively by various methods as indicated in figure legends. All measurements
regulates mitochondrial biogenesis and activity (43–45). Recent were taken from individual samples.
3D adipose tissue imaging reveals that cold-induced generation Study approval. The City of Hope IACUC approved all animal
of beige adipocytes in the subcutaneous adipose tissue depends experiments.
on the density of sympathetic innervation (38, 39). Here, we show
that sympathetic innervation in BAT is much denser than that Author contributions
in white adipose tissue. Thus, the thermogenic heterogeneity of QAW, PES, and AS designed the experiments. QAW, PES, and LJ
brown adipocytes is not correlated to sympathetic innervation. wrote the manuscript. AS and QAW handled all the mouse exper-
However, it is still possible that norepinephrine is differentially iments and performed β-gal staining. AL performed histological
secreted by each sympathetic neuron. Notably, the expression sectioning. AS performed the mitochondrial membrane poten-
level of β3-adrenergic receptor Adrb3 was enriched in the BA-H tial test and immunofluorescence staining. AS prepared primary
subpopulation. Therefore, the diverse thermogenic activity may brown adipocytes and XW conducted and analyzed scRNA-seq
be determined by the difference in the responsiveness of brown experiments. AS, QAW, LM, TN and WD performed the seahorse
adipocyte to β3-adrenergic signals. and fatty acid intake experiment. AS, MJJ, HZ, and BA performed
Developmentally, as newborn pups require much higher ther- BAT tissue clearing and 3D imaging. AS, ZL, and MMM per-
mogenic activity, it is not surprising that all brown adipocytes are formed the transmission electron microscopy. MS, JT, JMH, YL,
born as Adipoq high expressers and potentially have high thermo- YZ, LJ, and VG contributed to experimental design and discussion.
genic activity. Interestingly, a subpopulation of brown adipocytes All authors approved the final manuscript.
gradually converts into Adipoq low expressers after birth. The
establishment of heterogeneity after birth is likely due to the het- Acknowledgments
erogeneous lineages of brown adipocyte precursors during devel- The authors are grateful to Jiandie Lin, Li Ye, and members of the
opment. However, it is also possible that the 2 brown adipocyte Diabetes and Metabolism Research Institute for discussions and
subpopulations are not born to be different, and they may undergo comments. The authors thank the City of Hope Animal Resource
a switching mechanism even at room temperature, taking dynamic Center, Integrative Genomics Core, Electron Microscopy and
turns to function as high-thermogenic cells. As the interscapular Atomic Force Microscopy Core, Light Microscopy Core, Pathol-
BAT is the first adipose depot to develop in the mouse, BAT may ogy (Solid Tumor) Core (supported by NIH P30CA033572), Ana-
serve as the primary site for adiponectin expression and secre- lytical Cytometry Core, and City of Hope Comprehensive Cancer
tion in these very early stages of life. When white adipose depots Center for guidance and assistance for experiments. This study
development initiates later in life, these tissues then take over as was supported by NIH grants K01DK107788, R03HD095414,
the primary sites for adiponectin production. When mice in the and R56AG063854 (to QAW) and R01DK55758, R01DK099110,
adult stage are exposed to cold, other than a conversion of BA-L P01DK088761, and P01AG051459 (to PES). QAW was also sup-
into BA-H population, BAT may also undergo de novo adipogene- ported by City of Hope Caltech-COH Initiative Award and the
sis, especially when mice are exposed to the cold for a long period American Diabetes Association Junior Faculty Development Award
of time (46, 47). Importantly, the conversion of low-thermogenic (1-19-JDF-023). PES was also supported by an unrestricted research
brown adipocytes into high-thermogenic adipocytes upon cold grant from the Novo Nordisk Foundation and by a grant from the
exposure is impaired with old age, but not by HFD feeding. This Kristian Gerhard Jebsen Foundation. This work was also supported
may offer a new explanation for the age-associated decline in by the Beckman Institute for CLARITY, Optogenetics and Vector
brown adipose tissue thermogenic activity. Engineering Research for technology development and broad dis-
Future studies will need to address the metabolic func- semination (http://clover.caltech.edu/) (to VG) and Caltech Divi-
tions and lineages of the low-thermogenic brown adipocyte sional Postdoctoral Fellowship (to MJJ).
subpopulation, as well as the molecular mechanisms that reg-
ulate the interconversion between the 2 subpopulations. More Address correspondence to: Qiong (Annabel) Wang, Depart-
importantly, it will be interesting to determine why the num- ment of Molecular & Cellular Endocrinology, City of Hope,
ber of high-thermogenic brown adipocytes declines with age. 1500 East Duarte Road, Duarte, California 91010, USA. Phone:
Unmasking the complex physiology of BAT thermogenesis is 626.218.6419; Email: qwang@coh.org.
256 jci.org Volume 130 Number 1 January 2020The Journal of Clinical Investigation RESEARCH ARTICLE
1. Orava J, et al. Different metabolic responses of homeostasis. FASEB J. 2016;30(1):81–92. adipose cell fate and function. Nat Rev Mol Cell
human brown adipose tissue to activation by cold 17. Wikstrom JD, et al. Hormone-induced mitochon- Biol. 2016;17(8):480–495.
and insulin. Cell Metab. 2011;14(2):272–279. drial fission is utilized by brown adipocytes as an 33. Lin J, et al. Transcriptional co-activator PGC-1
2. Ouellet V, et al. Brown adipose tissue oxidative amplification pathway for energy expenditure. alpha drives the formation of slow-twitch muscle
metabolism contributes to energy expenditure EMBO J. 2014;33(5):418–436. fibres. Nature. 2002;418(6899):797–801.
during acute cold exposure in humans. J Clin 18. Xie TR, Liu CF, Kang JS. Sympathetic transmit- 34. Lin J, et al. PGC-1beta in the regulation of hepatic
Invest. 2012;122(2):545–552. ters control thermogenic efficacy of brown adi- glucose and energy metabolism. J Biol Chem.
3. Chondronikola M, et al. Brown adipose tissue pocytes by modulating mitochondrial complex V. 2003;278(33):30843–30848.
improves whole-body glucose homeostasis Signal Transduct Target Ther. 2017;2:17060. 35. Rajakumari S, et al. EBF2 determines and
and insulin sensitivity in humans. Diabetes. 19. Wang QA, Tao C, Gupta RK, Scherer PE. Track- maintains brown adipocyte identity. Cell Metab.
2014;63(12):4089–4099. ing adipogenesis during white adipose tissue 2013;17(4):562–574.
4. Bartelt A, et al. Brown adipose tissue activi- development, expansion and regeneration. 36. He C, et al. NanoSIMS imaging reveals unex-
ty controls triglyceride clearance. Nat Med. Nat Med. 2013;19(10):1338–1344. pected heterogeneity in nutrient uptake by
2011;17(2):200–205. 20. Wang QA, et al. Reversible de-differentiation brown adipocytes. Biochem Biophys Res Commun.
5. Stanford KI, et al. Brown adipose tissue regulates of mature white adipocytes into preadipo- 2018;504(4):899–902.
glucose homeostasis and insulin sensitivity. cyte-like precursors during lactation. Cell Metab. 37. Morrison SF, Madden CJ, Tupone D. Central
J Clin Invest. 2013;123(1):215–223. 2018;28(2):282–288.e3. neural regulation of brown adipose tissue ther-
6. Chouchani ET, Kazak L, Spiegelman BM. New 21. Childs BG, Baker DJ, Wijshake T, Conover CA, mogenesis and energy expenditure. Cell Metab.
advances in adaptive thermogenesis: UCP1 and Campisi J, van Deursen JM. Senescent intimal 2014;19(5):741–756.
beyond. Cell Metab. 2019;29(1):27–37. foam cells are deleterious at all stages of athero- 38. Jiang H, Ding X, Cao Y, Wang H, Zeng W. Dense
7. Lowell BB, et al. Development of obesity in sclerosis. Science. 2016;354(6311):472–477. intra-adipose sympathetic arborizations are
transgenic mice after genetic ablation of brown 22. Baker DJ, et al. Naturally occurring essential for cold-induced beiging of mouse white
adipose tissue. Nature. 1993;366(6457):740–742. p16(Ink4a)-positive cells shorten healthy lifes- adipose tissue. Cell Metab. 2017;26(4):686–692.e3.
8. Kopecky J, Clarke G, Enerbäck S, Spiegelman pan. Nature. 2016;530(7589):184–189. 39. Chi J, et al. Three-dimensional adipose tissue
B, Kozak LP. Expression of the mitochondrial 23. Ye R, et al. Impact of tamoxifen on adipocyte imaging reveals regional variation in beige fat
uncoupling protein gene from the aP2 gene lineage tracing: Inducer of adipogenesis and biogenesis and PRDM16-dependent sympathetic
promoter prevents genetic obesity. J Clin Invest. prolonged nuclear translocation of Cre recombi- neurite density. Cell Metab. 2018;27(1):226–236.e3.
1995;96(6):2914–2923. nase. Mol Metab. 2015;4(11):771–778. 40. Jung RT, Shetty PS, James WP, Barrand MA, Call-
9. Crane JD, et al. Inhibiting peripheral serotonin 24. Harms M, Seale P. Brown and beige fat: develop- ingham BA. Reduced thermogenesis in obesity.
synthesis reduces obesity and metabolic dysfunc- ment, function and therapeutic potential. Nature. 1979;279(5711):322–323.
tion by promoting brown adipose tissue thermo- Nat Med. 2013;19(10):1252–1263. 41. Yoneshiro T, et al. Age-related decrease in
genesis. Nat Med. 2015;21(2):166–172. 25. Chouchani ET, et al. Mitochondrial ROS regulate cold-activated brown adipose tissue and accu-
10. Gnad T, et al. Adenosine activates brown adipose thermogenic energy expenditure and sulfenyla- mulation of body fat in healthy humans. Obesity
tissue and recruits beige adipocytes via A2A tion of UCP1. Nature. 2016;532(7597):112–116. (Silver Spring). 2011;19(9):1755–1760.
receptors. Nature. 2014;516(7531):395–399. 26. Mills EL, et al. Accumulation of succinate con- 42. Tajima K, et al. Mitochondrial lipoylation inte-
11. Bertholet AM, et al. Mitochondrial patch clamp trols activation of adipose tissue thermogenesis. grates age-associated decline in brown fat ther-
of beige adipocytes reveals UCP1-positive and Nature. 2018;560(7716):102–106. mogenesis. Nat Metab. 2019;1(9):886–898.
UCP1-negative cells both exhibiting futile cre- 27. Crewe C, et al. An endothelial-to-adipocyte 43. Iwabu M, et al. Adiponectin and AdipoR1 regulate
atine cycling. Cell Metab. 2017;25(4):811–822.e4. extracellular vesicle axis governed by metabolic PGC-1alpha and mitochondria by Ca(2+) and
12. Lee KY, et al. Tbx15 defines a glycolytic subpopu- state. Cell. 2018;175(3):695–708.e13. AMPK/SIRT1. Nature. 2010;464(7293):1313–1319.
lation and white adipocyte heterogeneity. Diabe- 28. Kazak L, et al. A creatine-driven substrate cycle 44. Kusminski CM, et al. MitoNEET-driven alterations
tes. 2017;66(11):2822–2829. enhances energy expenditure and thermogenesis in adipocyte mitochondrial activity reveal a crucial
13. Lee KY, Luong Q, Sharma R, Dreyfuss JM, Ussar in beige fat. Cell. 2015;163(3):643–655. adaptive process that preserves insulin sensitivity
S, Kahn CR. Developmental and functional het- 29. Tontonoz P, Hu E, Spiegelman BM. Stimulation in obesity. Nat Med. 2012;18(10):1539–1549.
erogeneity of white adipocytes within a single fat of adipogenesis in fibroblasts by PPAR gamma 45. Qiao L, Kinney B, Yoo HS, Lee B, Schaack J, Shao
depot. EMBO J. 2019;38(3):e99291. 2, a lipid-activated transcription factor. Cell. J. Adiponectin increases skeletal muscle mito-
14. Chen Y, et al. Thermal stress induces glycolytic 1994;79(7):1147–1156. chondrial biogenesis by suppressing mitogen-
beige fat formation via a myogenic state. Nature. 30. Hu E, Tontonoz P, Spiegelman BM. Transdiffer- activated protein kinase phosphatase-1. Diabetes.
2019;565(7738):180–185. entiation of myoblasts by the adipogenic tran- 2012;61(6):1463–1470.
15. Cinti S, et al. CL316,243 and cold stress induce scription factors PPAR gamma and C/EBP alpha. 46. Bukowiecki LJ, Géloën A, Collet AJ. Proliferation
heterogeneous expression of UCP1 mRNA and Proc Natl Acad Sci USA. 1995;92(21):9856–9860. and differentiation of brown adipocytes from
protein in rodent brown adipocytes. J Histochem 31. Wang QA, et al. Distinct regulatory mechanisms interstitial cells during cold acclimation. Am J
Cytochem. 2002;50(1):21–31. governing embryonic versus adult adipocyte Physiol. 1986;250(6 Pt 1):C880–C887.
16. Spaethling JM, et al. Single-cell transcriptomics maturation. Nat Cell Biol. 2015;17(9):1099–1111. 47. Lee YH, Petkova AP, Konkar AA, Granneman JG.
and functional target validation of brown adi- 32. Inagaki T, Sakai J, Kajimura S. Transcriptional Cellular origins of cold-induced brown adipocytes
pocytes show their complex roles in metabolic and epigenetic control of brown and beige in adult mice. FASEB J. 2015;29(1):286–299.
jci.org Volume 130 Number 1 January 2020 257You can also read