Synthetic Image Generation Using the Finite Element Method and Blender Graphics Program for Modeling of Vision-Based Measurement Systems
←
→
Page content transcription
If your browser does not render page correctly, please read the page content below
sensors
Article
Synthetic Image Generation Using the Finite Element Method
and Blender Graphics Program for Modeling of Vision-Based
Measurement Systems
Paweł Zdziebko               and Krzysztof Holak *

                                          Department of Robotics and Mechatronics, AGH University of Science and Technology, Al. A. Mickiewicza 30,
                                          30-059 Krakow, Poland; zdziebko@agh.edu.pl
                                          * Correspondence: holak@agh.edu.pl

                                          Abstract: Computer vision is a frequently used approach in static and dynamic measurements of
                                          various mechanical structures. Sometimes, however, conducting a large number of experiments is
                                          time-consuming and may require significant financial and human resources. On the contrary, the
                                          authors propose a simulation approach for performing experiments to synthetically generate vision
                                          data. Synthetic images of mechanical structures subjected to loads are generated in the following
                                          way. The finite element method is adopted to compute deformations of the studied structure, and
                                          next, the Blender graphics program is used to render images presenting that structure. As a result
                                          of the proposed approach, it is possible to obtain synthetic images that reliably reflect static and
                                          dynamic experiments. This paper presents the results of the application of the proposed approach
                                          in the analysis of a complex-shaped structure for which experimental validation was carried out.
                                          In addition, the second example of the process of 3D reconstruction of the examined structure (in a

                                   multicamera system) is provided. The results for the structure with damage (cantilever beam) are
Citation: Zdziebko, P.; Holak, K.         also presented. The obtained results allow concluding that the proposed approach reliably imitates
Synthetic Image Generation Using the      the images captured during real experiments. In addition, the method can become a tool supporting
Finite Element Method and Blender         the vision system configuration process before conducting final experimental research.
Graphics Program for Modeling of
Vision-Based Measurement Systems.         Keywords: image-based measurement; vision sensor modeling; vision system simulation; image-
Sensors 2021, 21, 6046.                   based reconstruction; finite element method; physics-based computer graphics
https://doi.org/10.3390/s21186046

Academic Editor: Sylvain Girard

                                          1. Introduction
Received: 14 August 2021
Accepted: 1 September 2021
                                                In the recent decade, image processing and computer vision techniques have gained
Published: 9 September 2021
                                          recognition in the engineering society as an important element of inspection and moni-
                                          toring systems for mechanical and civil engineering structures [1–3]. For object surface
Publisher’s Note: MDPI stays neutral
                                          state assessment, images capture the same information as that usually found by human
with regard to jurisdictional claims in
                                          inspectors. Additionally, image and video files encode full-field displacements or deforma-
published maps and institutional affil-   tion courses. A series of images captured from distinct viewpoints provide information
iations.                                  on the 3D structure of the object [4]. Videos, as a time series of images, additionally con-
                                          tain temporal information that can be utilized to find changes in the observed object or
                                          obtain dynamic response data if one applies a measurement camera with a frame rate that
                                          is sufficiently high [5]. A lot of research reported in the literature has been carried out
                                          for image-based remote inspection of civil engineering structures, using high-resolution
Copyright: © 2021 by the authors.
Licensee MDPI, Basel, Switzerland.
                                          camera systems mounted on a tripod [3] or unmanned aerial vehicles [6] (UAVs) to record
This article is an open access article
                                          necessary image data. Additionally, one can observe a significant development in artificial
distributed under the terms and           intelligence (AI) approaches in computer vision systems [7].
conditions of the Creative Commons              There are two major groups of computer vision applications for structure state assess-
Attribution (CC BY) license (https://     ment: image-based inspection of the surface and vision-based monitoring to obtain the
creativecommons.org/licenses/by/          current static state and/or dynamic behavior of the structure. Researchers have developed
4.0/).                                    methods for the detection of various types of damage: concrete cracks, delamination and

Sensors 2021, 21, 6046. https://doi.org/10.3390/s21186046                                                  https://www.mdpi.com/journal/sensors
Sensors 2021, 21, 6046                                                                                            2 of 17

                         spalling of concrete, asphalt cracks, steel fatigue cracks and corrosion [8]. In a recent
                         study [9], the authors proposed a tracking measurement of the full-field surface deforma-
                         tion of large-field recycled concrete-filled steel tube columns via a mark-free, four-ocular,
                         stereoscopic visual system. Achieved results proved the high accuracy of this method.
                               Earlier developed methods of surface damage detection are heuristic and were de-
                         signed for specific tasks. However, in these methods, all parameters must be chosen
                         manually based on the image data and the user’s practical knowledge. Deep learning
                         introduction expanded the capability and robustness compared to the classical vision [10].
                         A lot of studies have been conducted to increase the automation level of image-based dam-
                         age detection. An interesting application is the structural element recognition algorithm.
                         First, the structural elements are localized in the image (e.g., columns, beams) [11]. Next,
                         damage detection is carried out on each of them, and its severity is evaluated with the
                         application of specific technical standards. The entire inspection process is performed with
                         the application of UAV robots [12]. Object detection methods are also used in other vision
                         system applications, e.g., fruit detection systems, such as that presented by Li et al. [13].
                               Another big area of image processing application in structure state evaluation is
                         static [14,15] and dynamic vision-based measurement [16,17]. Structural deformation is
                         often computed by means of the digital image correlation (DIC) method, a well-known
                         approach in the field of laboratory testing of mechanical properties [18]. In this approach, a
                         high-contrast visual optical noise pattern has to be placed on the object’s surface before
                         an experiment is carried out to increase the performance of the method. The DIC method
                         has also been applied in the displacement measurement of large-scale civil engineering
                         structures. In such cases, a camera equipped with a telephoto lens is used. Usually, it
                         observes a single point, a marker or a natural feature; however, a larger field of view may
                         be observed also by means of the application of a synchronized camera network [19,20].
                         Stereovision systems are applied to recover the 3D structure of observed objects [21]. Such
                         systems may also be augmented by RGB-D sensors [22]. Multicamera reconstruction can
                         also be performed using even more cameras. For example, Chen et al. [23] and Tang
                         et al. [24] used four-camera vision systems for a tube-like shape object reconstruction.
                               Most often, the development of image processing algorithms requires access to a large
                         amount of test data. These are video sequences or single images showing objects whose dis-
                         placement or change in shape is the subject of detection. The structure is usually equipped
                         with visual markers or has an applied optical noise on its surface. This requirement is
                         related to how the algorithms determine changes in the shape of the structure in the image.
                         This is performed by measuring the position of individual markers on the system under
                         study. The design and development of damage detection require vision data (such as
                         images or video sequences) of analyzed structure. Usually, it is necessary to collect data
                         for loaded and unloaded states, as well as for various damage scenarios. This approach
                         requires careful preparation of laboratory setups and performing time-consuming exper-
                         iments, as damaged structures are not common in practice. It requires the preparation
                         of the test stand, i.e., sample manufacturing, configuration of the test rig and the vision
                         system. Dynamic experiment observations recorded with the use of high-speed cameras
                         are particularly time-consuming due to the large amount of data recorded.
                               A lot of progress has been made in the field of computer graphics and augmented
                         reality that has allowed the generation of photorealistic images and videos. In the literature,
                         such data have been used to train deep neural networks for the segmentation of images
                         and object classification problems [25]. This significantly increased the available sizes
                         of training data sets for neural networks and allowed the introduction of more variable
                         imaging conditions for synthetic cameras. Two approaches to the generation of synthetic
                         images are available. The first approach uses game engines to render images in a shorter
                         time but with limited capabilities for realism, and the second approach allows rendering
                         scenes using a physics-based ray tracing algorithm to produce high-quality, photorealistic
                         images. However, this approach requires more computational cost. Synthetic images
                         generated in one of these approaches provide a structural model with controllable and
Sensors 2021, 21, 6046                                                                                          3 of 17

                         repeatable loading and damage conditions. Additionally, the effects of external lighting
                         and vision system optical parameters can be easily simulated. A practical implementation
                         of this idea was presented in the work by Spencer et al. [1]. The authors presented a method
                         of using physical-based models of structures and synthetic image generation to obtain
                         images of structures with different damage conditions. They used synthetic data of a miter
                         gate and a deep neural network to identify changes occurring on the gate. The generated
                         training set of images included models of various damage conditions such as cracks and
                         corrosion. Synthetic images in the data set were generated under different environmental
                         factors such as variable lighting conditions and vegetation growth.
                               The results of the review presented in [25] indicate that the currently used methods of
                         synthetic image generation are most often based on existing graphics engines dedicated
                         to games or embedded algorithms in rendering programs, e.g., in Blender or Autodesk
                         Maya. It should be emphasized that the main goals of these solutions are visual effects.
                         When it is more important to reflect the actual deformation of the structure (e.g., under
                         loads), the available engines may not be sufficient and reliable solutions. To the best of
                         our knowledge, there are no published validation results that can definitely prove that the
                         mechanical deformations in synthetic images are realistic.
                               This article addresses this challenge. As part of this work, the authors propose a
                         solution that aims at synthetic image generation based on finite element analysis results,
                         which exemplifies the novelty of this work. In general, the proposed solution consists
                         of using a model formulated with the finite element method (FEM), which is a widely
                         recognized simulation method that precisely simulates the deformation of the studied
                         model. Then, the graphics program Blender is used to generate synthetic images using
                         computer resources (renderings).
                               The limitations of the proposed method are mainly related to the detailed represen-
                         tation of the simulated scene. The complicated shape of the observed structure requires
                         the formulation of a dense FEM mesh. This results in a significant extension of compu-
                         tation time. Moreover, another limitation of the applied method is the complex state of
                         illumination of the scene and a detailed representation of texture reflectance, as well as
                         the size of the generated image. All these factors increase the rendering time of the scene.
                         Overlapping these factors can make synthetically producing images more time-consuming
                         than conducting real experiments in extreme cases. However, in most practical applications,
                         these limitations are limited, and the computational efficiency of the followed numerical
                         approach is satisfactorily high.
                               FEM simulations are widely used in the analysis of engineering problems, including
                         multidomain simulations, in which an important role is played by coupling between
                         various physical domains, such as thermal and mechanical [26]. This method is also used
                         to analyze other problems, such as metal forming [27] or the analysis of components made
                         with composite materials [28]. The joint simulation of the Blender graphics program and
                         the FEM has been presented recently [29]. Nevertheless, the Blender program was only
                         used to define a finite element mesh. The second example of Blender integration, this time
                         in the computer-aided design (CAD) environment, was presented by Vasilev et al. [30]. The
                         images were rendered in Blender, but the whole process did not involve FEM calculations
                         to obtain the deformation of objects.
                               The novelty of the simulation approach introduced in this paper is the combination of
                         the FEM method and the ability to render synthetic images in the Blender program. Owing
                         to the use of FEM simulation models, high accuracy of simulated displacements is ensured.
                         Moreover, it is possible to simulate any complex mechanical structure. The authors of this
                         work have developed their own numerical environment. It allows customizing the simu-
                         lation and automatically renders images of statically or dynamically loaded mechanical
                         structures. In the proposed solution, FEM models are computed in the MSC.Marc solver,
                         which is dedicated to nonlinear analyses (e.g., with contacts) and multidomain couplings.
                         Moreover, owing to the developed simulation setup, the FEM analysis can be individually
                         customized to a specific problem (e.g., modeling of vision markers). The proposed algo-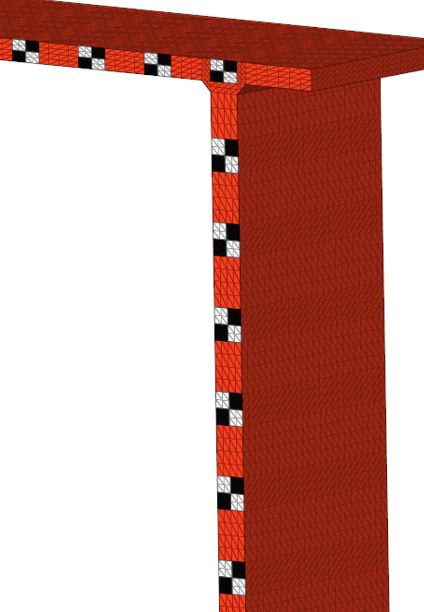
authors of this work have developed their own numerical environment. It allows
customizing the simulation and automatically renders images of statically or dynamically
loaded mechanical structures. In the proposed solution, FEM models are computed in the
MSC.Marc solver, which is dedicated to nonlinear analyses (e.g., with contacts) and
multidomain couplings. Moreover, owing to the developed simulation setup, the FEM
Sensors 2021, 21, 6046 4 of 17
analysis can be individually customized to a specific problem (e.g., modeling of vision
markers). The proposed algorithm is discussed in detail in Section 2. Subsequently,
Section 3 presents two examples of applications for generating synthetic images. The first
example includes experimental
rithm is discussed validation
in detail in Section of the proposed
2. Subsequently, simulation
Section approach,
3 presents while the
two examples
second exampleforpresents
of applications the synthetic
generating simulation results
images. forfirst
The a multicamera system.
example includes Section 4
experimental
summarizes
validation ofthe
thepresented
proposedwork.
simulation approach, while the second example presents the
simulation results for a multicamera system. Section 4 summarizes the presented work.
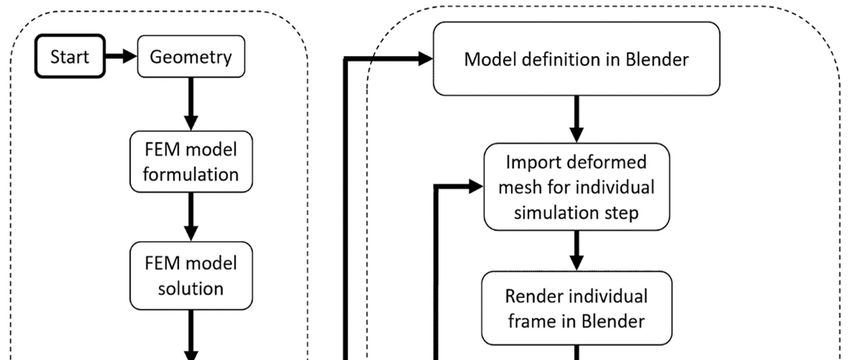
2. Materials and Methods
2. Materials and Methods
The proposed computing environment uses FEM simulation tools and the Blender
The program.
graphics proposedThe computing
diagramenvironment
of the proposed uses FEM simulation
algorithm is showntools and the
in Figure Blender
1. Synthetic
graphicsofprogram.
images The diagram
the structure of the
under study proposed
are obtainedalgorithm
as a result is of
shown in Figure 1.operation.
the algorithm’s Synthetic
images
The aimofofthethe
structure
proposedunder study are
method is toobtained as a result
synthetically of theimages
produce algorithm’s operation.
of mechanical
structures subjected to loads. It is also necessary to ensure real deformationsstruc-
The aim of the proposed method is to synthetically produce images of mechanical and
tures subjected
parameters of to loads. It
realistic is alsosystems
vision necessary to ensure
(lens, camera realresolution,
deformations and parameters
lighting conditions).of
realistic vision systems (lens, camera resolution, lighting conditions).
Further use of the images produced can vary. It can be focused on line deflection Further use of the
images produced
calculation candetection
or defect vary. It can be focused
based on image on processing.
line deflectionThecalculation
simulationormethodology
defect detec-
tion based on image processing. The simulation methodology begins with
begins with a definition of a model geometry using a CAD program or directly in the FEM a definition of a
model geometry using a CAD program or directly in the FEM preprocessor.
preprocessor. More complex components are usually more convenient to be modeled in a More complex
components
dedicated CAD areprogram.
usually more convenient to be modeled in a dedicated CAD program.
Figure
Figure 1.
1. Scheme
Scheme of
of the
the proposed
proposed simulation algorithm.
simulation algorithm.
Next,
Next, the
the FEM model is formulated in the FEM preprocessor. The authors used the
Altair HyperMesh
HyperMesh program.
program. Essential
Essential steps
steps in
in this
this stage
stage are as follows: defining a finite
element
element mesh, assigning material parameters
parameters and defining the boundary conditions and
the load
loadstep.
step.The
The finite
finite elements
elements should
should be of abesolid
of atype
solid
(3Dtype (3D e.g.,
elements, elements, e.g., in
in hexahedral,
tetrahedral or
hexahedral, pentahedral
tetrahedral or shape). This requirement
pentahedral shape). This isrequirement
dictated by the requirement
is dictated to
by the
render a closed volume in the next stage of the algorithm’s work. Moreover, to enable the
export of the FEM mesh into the Blender graphics program, it is necessary to cover solid
elements with a membrane of 2D elements in the model. Its thickness and stiffness should
be selected so as not to affect the simulation results. The calculations assumed a membrane
thickness of 0.001 mm and a Young’s modulus 10 times lower than the native material of
3D elements. The membrane mesh is deformed together with the native material. It has
common nodes with the 3D mesh. Owing to this, and ensuring the unambiguity of the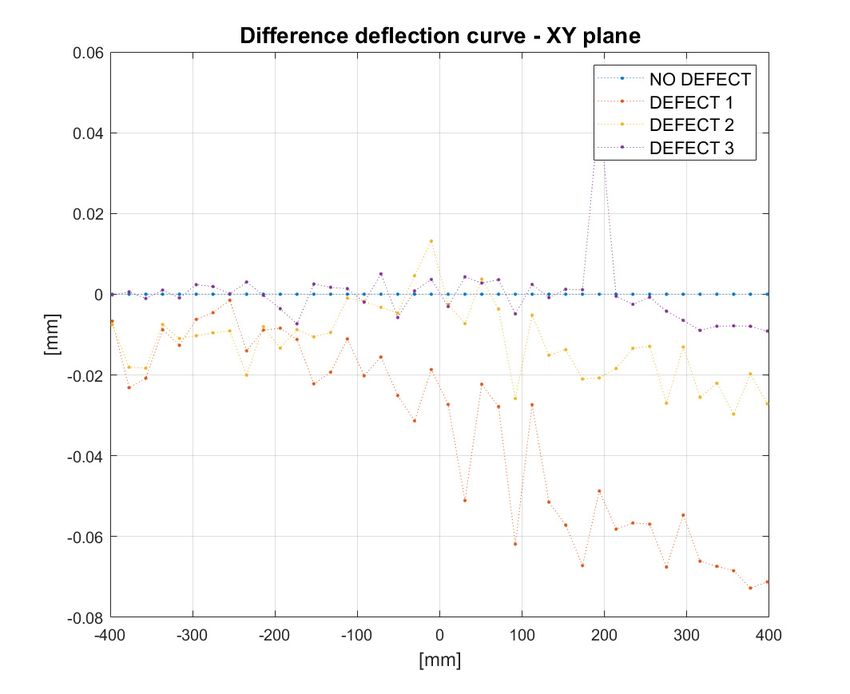
Sensors 2021, 21, 6046                                                                                          5 of 17

                         displacements, it is possible to correctly project the deformed mesh in Blender (at a later
                         stage of the algorithm). Degrees of freedom of the elements should correspond to the type
                         of analysis being carried out, e.g., displacements and rotations in nodes for the mechanical
                         domain. In this analysis domain, with the elastic deformation regime, the most important
                         mechanical properties of the material to be modeled are Young’s modulus, Poisson’s ratio
                         and density. The boundary conditions should reflect the actual loads as closely as possible.
                         In most cases for mechanical domain analysis, there are pressure loads and constraints on
                         appropriate degrees of freedom. The equation of the formulated FEM model in the general
                         form is given by Equation (1).
                                                                     Ku = F                                       (1)
                         where:
                               Kglobal sti f f ness matrix;
                               uglobal displacement vector;
                               Fglobal vector o f nodal f orces.
                               The definition load step describes the sequence in which the boundary conditions are
                         applied to the structure. It also defines the type of analysis to be performed (e.g., static,
                         quasi-static or dynamic transient). Then, the formulated FEM model is solved using a
                         dedicated solver. In this step, the global displacement vector is determined. The solution
                         proposed by the authors of this work is based on the MSC.Marc solver. The convergence
                         condition of the analysis dictates the step size in the FEM simulation. The second criterion
                         for the minimum number of steps in the FEM load step is imposed by the number of
                         required rendered frames (in Blender). In quasi-static problems, it is usually two frames
                         (before and after load application).
                               The next step of the algorithm is to export the deformed finite element mesh to a
                         *.STL file for individual time steps in the simulation. The authors developed the scripts to
                         automate exporting the current state of the structure’s deformation in the required time
                         intervals, which is especially important for simulating a dynamic phenomenon. The mesh
                         of the system under study must be divided into several parts. The number of exported
                         meshes depends on the number of textures used further in the algorithm in Blender. In
                         other words, if the resulting rendered image presents, for example, three textures or colors
                         on the object, then the export of the deformed mesh must be done separately for each of
                         these areas.
                               Next, the Blender program is involved in the proposed solution. The essential Blender
                         model components and parameters are defined at first. These are: cameras (position,
                         orientation, sensor size, lens focal length), lighting points (light shade, intensity) and
                         textures that are later applied to the imported mesh. These parameters should correspond
                         to real-file experimental conditions. In the next step, the import process of the deformed
                         mesh begins. The rendering of a single frame/image is performed next and is repeated for
                         all required frames. The task becomes much more time-consuming when it is necessary to
                         generate a large number of images. This can be necessary for synthetic images generation
                         of dynamic problems. A Python script was developed to automate this task.
                               As discussed before, the purpose of the proposed method is to produce synthetic
                         images. Nevertheless, it seems necessary to report on potential application areas of the
                         method. Therefore, in Section 3, three case studies of the use of the FEM+Blender simula-
                         tion are presented. These are not the only possible fields of application of the proposed
                         approach but only representative examples. They are limited to relatively simple mechani-
                         cal structures but take into account various load conditions and the occurrence of damage.
                         The application of this approach for arbitrarily complex objects is possible but requires
                         the formulation of complex FEM and Blender models. In the presented case studies, the
                         proposed FEM+Blender simulation is limited to quasi-static cases.

                         3. Results and Discussion
                             This section presents three case studies of the use of the proposed numerical simulation
                         approach. The first example shows the tower crane structure. In this case study, the
presented case studies, the proposed FEM+Blender simulation is limited to quasi-static
cases.
3. Results and Discussion
Sensors 2021, 21, 6046 This section presents three case studies of the use of the proposed numerical 6 of 17
simulation approach. The first example shows the tower crane structure. In this case
study, the experimental validation of the deflection value is performed for a simple load
case applied to the sample. The second example is based on the same tower-crane-like
experimental validation of the deflection value is performed for a simple load case applied
structure sample but loaded by forces acting together in two directions. This example
to the sample. The second example is based on the same tower-crane-like structure sample
shows the possibility of simulating a multicamera system, and the displacement
but loaded by forces acting together in two directions. This example shows the possibility
measurement is performed in 3D. The third example concerns a relatively simple
of simulating a multicamera system, and the displacement measurement is performed in
structure, i.e., cantilever beam, but it demonstrates the use of the simulation approach to
3D. The third example concerns a relatively simple structure, i.e., cantilever beam, but it
generate images of structures with introduced damage (modeled as material
demonstrates the use of the simulation approach to generate images of structures with
discontinuities).
introduced damage (modeled as material discontinuities).
3.1.3.1.
Case Study:
Case Tower
Study: Crane
Tower Structure
Crane Structure
This subsection presents
This subsection presents anan example
example of the utilization
of the utilizationof the proposed
of the proposed FEM+Blender
FEM+Blender
simulation
simulation forfor
synthetic image
synthetic imagegeneration.
generation.In parallel, thethe
In parallel, experiments
experiments were performed
were performedto to
validate thethe
validate numerical
numericalapproach.
approach. TheThe
shape of the
shape of theused
usedsample
sample (same
(samein the numerical
in the numerical
model
modelandandexperiments)
experiments)corresponds
corresponds to the tower-crane-like
to the tower-crane-like structure, which
structure, whichconsists of of
consists
twotwosteel beams welded together. The adopted dimensions of the sample
steel beams welded together. The adopted dimensions of the sample are shown in are shown in
Figure 2. The
Figure cross-section
2. The of the
cross-section vertical
of the beam
vertical beam(6 ×(640
× mm)
40 mm) is greater than
is greater thethe
than horizontal
horizontal
section (4 ×(440
section ×mm) to make
40 mm) to makethe the
analyzed
analyzedstructure
structuremoremorecomplex,
complex, as it
ashas nonuniform
it has nonuniform
stiffness. The
stiffness. Theboundary conditions applied
boundary conditions appliedto to
the the structure
structure are asare as follows:
follows: clamp
clamp constraints
constraints
on the 70onmm thesection
70 mm at section at the
the base of base of thecrane,
the tower tower andcrane,
theandloadtheconstraints
load constraints
in the Z-
in the Z-direction
direction on theon themm
108 108section
mm section from
from the theend
free freeofend
the of the sample.
sample.
Figure
Figure 2. Scheme
2. Scheme of the
of the examined
examined tower-crane-like
tower-crane-like structure.
structure.
During the experiments, a specimen was fixed in a pneumatic clamp. Standard vision
markers in the shape of black and white boxes were used. They were placed on the side
surface of the sample. The vision markers are used to determine the deflection of the
structure at a later stage in this work using image processing algorithms. Their shape and
placement were the same as in the numerical model discussed in more detail in Section 3.1.1.
In the case of the experiment, the vision markers were also glued to stationary objects, such
as walls, in order to check whether the camera tripod was moved during the tests. Flat
weights mounted near the free end of the sample loaded the structure. The images were
captured using one full-frame 21.1 MP Canon EOS 5D Mark II digital single-lens reflex
camera (DSLR) with a focal length that amounted to the value of 30 mm. One camera is
sufficient to measure the deflection in one plane in the case of an elementary load case.
The camera’s position was arbitrarily chosen to allow observing the whole structure and
3.1.1. In the case of the experiment, the vision markers were also glued to stationary
objects, such as walls, in order to check whether the camera tripod was moved during the
tests. Flat weights mounted near the free end of the sample loaded the structure. The
images were captured using one full-frame 21.1 MP Canon EOS 5D Mark II digital single-
Sensors 2021, 21, 6046
lens reflex camera (DSLR) with a focal length that amounted to the value of 30 mm.7One of 17
camera is sufficient to measure the deflection in one plane in the case of an elementary
load case. The camera’s position was arbitrarily chosen to allow observing the whole
structure and was fixed during experiments. The camera was located in such a way that
waslens’
the fixedaxis
during
was experiments.
perpendicularThe camera
to the planewas locatedby
appointed in the
suchtower
a way that structure
crane the lens’ axis
and
perpendicular
was placed 1 m away to from
the plane appointed
the sample. Theby thelength
focal tower wascranechosen
structure and was
to allow placed
registering
1 mwhole
the away sample
from the sample.
with The focal
its nearest length was
surroundings. chosen to allow
A two-point halogen registering the whole
lamp positioned on
sample with its nearest surroundings. A two-point halogen lamp positioned
the left side behind the camera, slightly below the lens axis, illuminated the scene. The on the left side
behindsystem
vision the camera,
and the slightly
sample below
werethenotlens axis, illuminated
disassembled duringthethescene. The vision
experiments. system
Therefore,
andposition
the the sampleof the were not disassembled
sample, during and
illuminators, camera the experiments.
tripod remained Therefore,
the samethe position
during the
of the sample,
experiment. Theilluminators,
experiments camera
were and tripod remained
performed the same
without access during light
to natural the experiment.
that could
The experiments
have were performed
altered the illumination level without access
of the scene. to natural
Example light that
captured could
photos have
of an altered
unloaded
the illumination level of the scene. Example captured photos
and a loaded sample are shown in Figure 3a,b, respectively. In order to compute of an unloaded and a loaded
the
sample are shown in Figure 3a,b, respectively. In order to compute
deflection of the crane structure, pixel coordinates of the markers’ centers were detected the deflection of the
crane
in structure,image
the reference pixel coordinates
(unloaded state)of the markers’
and imagescenters were detected
of the structure in the
after load reference
application.
image (unloaded state) and images of the structure after load application.
Each marker’s center was detected using the Harris corner detector, and its consecutive Each marker’s
center was detected
displacement under the usingloadthewas
Harris corner
tracked by detector,
means ofand its consecutive
a digital displacement
image correlation (DIC)
under the load was tracked by means of a digital image
algorithm. The scale coefficient (mm/pix) was computed using the known distance correlation (DIC) algorithm.
The scalechosen
between coefficient (mm/pix)
markers on thewas computed
horizontal part using thecrane.
of the known Itsdistance
value was between
equal chosen
to 0.19
markers
mm/pix. on the horizontal part of the crane. Its value was equal to 0.19 mm/pix.
(a) (b)
Figure
Figure 3.
3. Images
Images of
of the
the structure
structure captured in the
captured in the tests:
tests: unloaded
unloaded state
state (a)
(a) and
and loaded state (b).
loaded state (b).
3.1.1.
3.1.1. Numerical
Numerical Model
Model Validation
Validation
According
According to the the presented
presentedsimulation
simulationalgorithm’s
algorithm’sdescription
description (Section
(Section 2), 2),
the the
de-
development
velopment ofof the
the simulationmodel
simulation modelbegan
beganwith
withthe
theCAD
CADmodel
modeldefinition.
definition. The modeled
geometry
geometry waswas consistent
consistent with
with the experimental
experimental sample,
sample, and
and the diagram is shown in
Figure 2. In
Figure In the
the next
next stage
stage of
of the
the process,
process, the
the FEM
FEM model
model was
was formulated.
formulated. Figure 4a
element mesh
presents a view of a finite element mesh in
in the
the area
area of
of the
the connection
connection of
of two
two steel
steel beams.
beams.
It should
It should be emphasized that
emphasized that thethe color of the elements used in the visualization is not
essential. As mentioned earlier, it is necessary to group finite elements due to the texture
applied to them later in the Blender program. In the presented case, this requirement was
achieved by renumbering the finite elements so that the relevant fragments of the examined
structure had ID numbers from known ranges. Owing to that, it was possible to export
selected parts of the mesh, on which different textures (white, black, metallic) were then
applied in the Blender graphics program.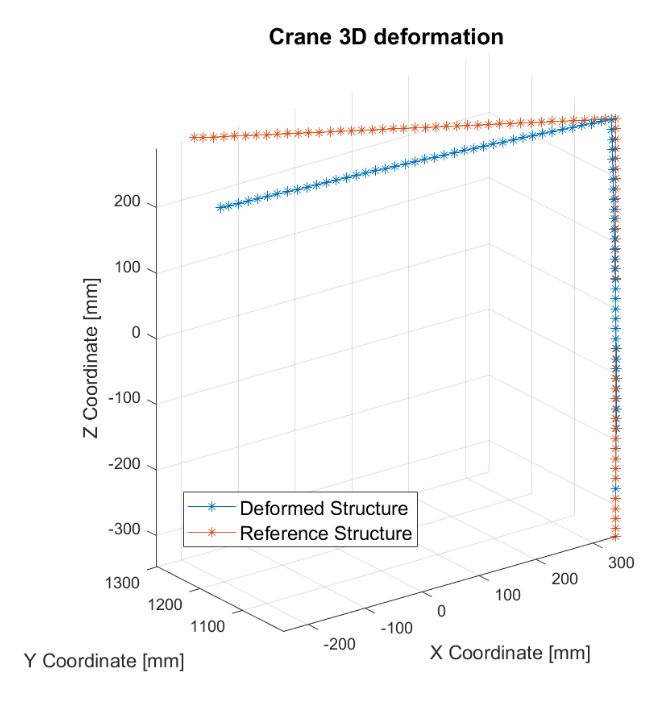
essential. As mentioned earlier, it is necessary to group finite elements due to the texture
applied to them later in the Blender program. In the presented case, this requirement was
achieved by renumbering the finite elements so that the relevant fragments of the
Sensors 2021, 21, 6046 examined structure had ID numbers from known ranges. Owing to that, it was possible 8 of 17
to export selected parts of the mesh, on which different textures (white, black, metallic)
were then applied in the Blender graphics program.
(a) (b)
Figure 4. FEM
Figure 4. FEM model:
model: close-up
close-up view
view of
ofaafinite
finiteelement
elementmesh
meshininthe
thearea
areaofof connection
connection of of a vertical
a vertical andand horizontal
horizontal beam
beam (a)
(a) and the results of deflection of the tested structure (b).
and the results of deflection of the tested structure (b).
The
The FEM
FEM model
model also
also defined material parameters
defined material parameters andand boundary
boundary conditions
conditions that
that
corresponded to the experiment. The conducted analysis was quasi-static.
corresponded to the experiment. The conducted analysis was quasi-static. Therefore, the Therefore, the
results of structure deformation were determined for two calculation steps:
results of structure deformation were determined for two calculation steps: before and before and
after
after the
the load
load application.
application. The
The displacement
displacement results
results are
are shown
shown in in Figure 4b.
Figure 4b.
According
According to to the
the simulation
simulation algorithm,
algorithm, the
the exported
exported FEM
FEM meshmesh was then imported
was then imported
into
into the
the model
model in Blender. White
in Blender. White and
and black
black textures
textures were
were applied
applied to the appropriate
to the appropriate
fragments
fragments of of the structure to model the proper proper places
places ofof the
the video
video markers.
markers. For the
remaining
remaining areas of the tower crane, a texture imitating the steel surface adopted
areas of the tower crane, a texture imitating the steel surface was with
was adopted
awith
gray color and increased reflectivity. Rendering was performed
a gray color and increased reflectivity. Rendering was performed using an using an Nvidia
GeForce
GeForce GTX GTX 1060
1060 6 GB graphics
graphics processing
processing unit
unit (GPU)
(GPU) and lasted
lasted 170 s for a single
Sensors 2021, 21, 6046 image.
image. Synthetically produced
producednondeformed
nondeformedand anddeformed
deformedstructure
structure renders
renders areare shown
shown in
9 of 17
in Figure
Figure 5a,b,
5a,b, respectively.
respectively.
(a) (b)
Figure
Figure 5.
5. Renders
Renders generated
generated using
using the
the proposed
proposed algorithm:
algorithm: unloaded
unloaded structure
structure (a)
(a) and
and loaded
loaded structure
structure (b).
(b).
The modeled camera had a sensor of 36 × 24 mm, and the utilized lens was set to a
focal length of 30 mm to keep the simulation consistent with the experimental setup. The
rendered image size was limited to 5616 × 3744 pix. Similar to the experimental case, the
synthetic images were processed in order to detect positions of markers in the reference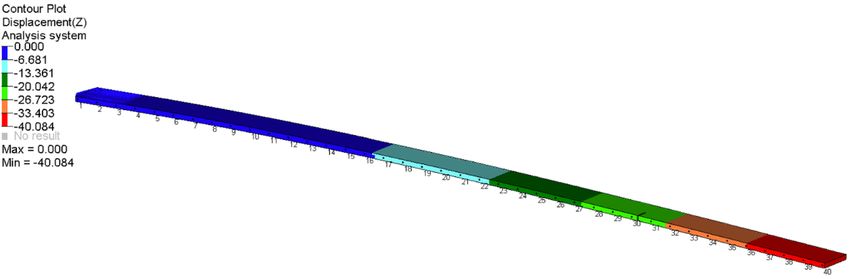
Sensors 2021, 21, 6046 (a) (b) 9 of 17
Figure 5. Renders generated using the proposed algorithm: unloaded structure (a) and loaded structure (b).
TheThe modeledcamera
modeled camerahad hada asensor
sensorofof36 36×× 24
24 mm,
mm, and
and the
the utilized
utilized lens
lens was
was setset to
to aa
focal length of 30 mm to keep the simulation consistent with the experimental
focal length of 30 mm to keep the simulation consistent with the experimental setup. The setup. The
rendered
rendered image
image size
size waswaslimited
limitedtoto5616
5616××3744
3744pix.
pix. Similar
Similar to
to the
the experimental
experimental case,case, the
the
synthetic
synthetic imageswere
images wereprocessed
processedininorderordertotodetect
detectpositions
positions of
of markers
markers in in the
the reference
reference
image
image andand imagesgenerated
images generatedafterafterload
loadapplication
applicationon onthe
thestructure.
structure. Initial
Initial positions
positions of of
markers (both in numerical and experimental cases) were found
markers (both in numerical and experimental cases) were found by the Harris corner by the Harris corner
detector
detector andandtracked
trackedbybymeans
meansofofthe theDIC
DICmethod.
method.The The computed
computed scalescale coefficient
coefficient was
was
equal to 0,21 mm/pix. The value was different than in the experimental case. The
equal to 0,21 mm/pix. The value was different than in the experimental case. The main
main
reason
reason forforthis
thisdiscrepancy
discrepancyisisthat thatthe
theposition
positionandandorientation
orientation ofof the
the camera
camera were
were notnot
exactly the same as in the real laboratory
exactly the same as in the real laboratory setup. setup.
Aftercomputation
After computationwas wascarried
carriedout,out,vision
visionmarker
marker positions
positions were
were obtained
obtained forfor the
the
experimental data (real images) and for synthetically simulated
experimental data (real images) and for synthetically simulated data (FEM + Blender data (FEM + Blender
approach).Results
approach). Resultsofofthe
thecrane’s
crane’sdeflection
deflectionarearepresented
presented inin Figure
Figure 6.6. The
The value
value of of the
the
maximum deflection for the experimental case was 32.68 mm, and that measured using
maximum deflection for the experimental case was 32.68 mm, and that measured using
synthetic
synthetic images
images amountedtotoa avalue
amounted valueofof32.76
32.76mm.
mm.TheThe relative
relative difference
difference between
between results
results
was 0.26%.
was 0.26%.
(a) (b)
Figure
Figure 6. 6.Results
Resultsofofthe
the comparison
comparison of
ofthe
thetower
towercrane deflection
crane lines
deflection for the
lines for experimental data (a)
the experimental and(a)forand
data the for
FEM +
the
Blender (b) simulation (renders).
FEM + Blender (b) simulation (renders).
It can be observed that the structure is deformed slightly differently in the absence of
load when comparing experimental and simulation results. This is due to the fact that the
FEM model ignored gravity and the fact that during the manufacturing of experimental
samples, there was material shrinkage in the welding process and no exact 90◦ angle
between the beams. It should also be emphasized that the conducted experiments and
simulations were carried out in the elastic (linear) regime of deformations. Nevertheless,
the most important parameter in this case study is the deformation after the load is applied,
and for this parameter, the simulation compliance with the experiment is very high (0.26%
error). Therefore, it can be concluded that a correctly adjusted method for synthetic images
creation allows obtaining realistic pictures of the analyzed structure. The method can
therefore be used to generate vision data without performing experiments.
3.2. Case Study: Tower Crane Structure with Complex Load Case
This example is presented to demonstrate the possibility of simulating the multicamera
system, which is necessary to be used to measure the deflection of a tower crane structure
with an applied complex load case. The resulting deflection, which occurs in the 3D space,
cannot be measured by a single camera system in this case. The shape of the sample is the
same as that introduced in Section 3.1, but the load acts in two directions: 192 N on the
Y-axis and 13 N on the Z-axis, according to Figure 2. Load is applied to the free end of
3.2. Case Study: Tower Crane Structure with Complex Load Case
This example is presented to demonstrate the possibility of simulating
multicamera system, which is necessary to be used to measure the deflection of a to
Sensors 2021, 21, 6046 crane structure with an applied complex load case. The resulting deflection, 10 of 17which oc
in the 3D space, cannot be measured by a single camera system in this case. The shap
the sample is the same as that introduced in Section 3.1, but the load acts in two directi
192 N on the Y-axis and 13 N on the Z-axis, according to Figure 2. Load is applied to
free end
the sample. Moreover, theof the sample.
sample is rotated 30◦ on the
Moreover, theZ-axis.
sample is rotated
This 30° onto the
is performed make Z-axis. Th
the analysis moreperformed
complex toand make the analysis
realistic. In this more complex
case study, and
only realistic.
the numericalIn this case study, only
approach
was considered, numerical
as describedapproach was
in Section 3.1.considered,
The method as was
described in Section
successfully 3.1. The
validated. Themethod
successfully
resulting magnitude validated. The
of displacement resulting
of the free endmagnitude
based on of the
displacement
FEM resultsof the free end based
equals
the FEM in
169.353 mm, as depicted results
Figureequals
7. The169.353
originalmm, as depicted
shape in Figurein7.the
of the structure Thereference
original shape of
structure in the reference
state is also depicted by thin lines. state is also depicted by thin lines.
7. Results
FigureFigure of theofdisplacement
7. Results of the
the displacement of tower crane
the tower structure
crane subjected
structure to to
subjected complex load.
complex load.
Sensors 2021, 21, 6046 The FEM analysis Theresults
FEMwere thenresults
analysis used towere
produce
then renders
used toaccording to the
produce renders11 ofproce-
17according to
dure introduced procedure
in Section 2. The multicamera system was composed of two cameras
introduced in Section 2. The multicamera system was composed of of
the same type as used in Section 3.1. The utilized lens was set to a focal length of 30 mm for
cameras of the same type as used in Section 3.1. The utilized lens was set to a focal len
Camera 1 and 32sample
and simulated mm
of 30 for
mm Camera
arefor
shown 2.inThe
Camera spatial
1 and
Figure 32 arrangement
8. mm
Bothfor Cameraof
cameras 2.the
wereThecameras and simulated
spatial arrangement
directed toward the of the cam
sample are shown
observed sample. in Figure 8. Both cameras were directed toward the observed sample.
Figure 8. Spatial arrangement of cameras and the tower crane sample in multicamera simulation.
Figure 8. Spatial arrangement of cameras and the tower crane sample in multicamera simulation.
As a result of the rendering procedure, the images obtained from the two virtual
cameras were generated for the reference (unloaded) and loaded states. The resulting
rendered images are presented in Figure 9a,b (loaded sample captured by Camera 1 and
loaded sample captured by Camera 2, respectively). Simultaneous deflection of theSensors 2021, 21, 6046 11 of 17
Figure 8. Spatial arrangement of cameras and the tower crane sample in multicamera simulation.
As aa result
As result of
of the
the rendering
rendering procedure, the images
procedure, the obtained from
images obtained from the
the two
two virtual
virtual
cameras were generated for the reference (unloaded) and loaded states. The resulting
cameras were generated for the reference (unloaded) and loaded states. The resulting
rendered images
rendered imagesare
arepresented
presentedininFigure
Figure 9a,b
9a,b (loaded
(loaded sample
sample captured
captured by Camera
by Camera 1 and1
loaded sample captured by Camera 2, respectively). Simultaneous deflection of the
and loaded sample captured by Camera 2, respectively). Simultaneous deflection of the
horizontal part and the twist of the vertical part can be easily observed.
horizontal part and the twist of the vertical part can be easily observed.
(a) (b)
Figure 9. Renders
Figure 9. generated using
Renders generated using the
theproposed
proposedalgorithm
algorithmofofthe
theloaded
loadedsample:
sample:rendered
rendered
byby Camera
Camera 1 (a)
1 (a) andand rendered
rendered as
as captured by Camera 2
captured by Camera 2 (b).(b).
The
The purpose
purpose ofof using two cameras is to carry out the 3D reconstruction of the tested
specimen.
specimen. ToTobebeable
abletotocarry out
carry this
out process,
this it isitnecessary
process, to compute
is necessary bothboth
to compute intrinsic and
intrinsic
extrinsic camera
and extrinsic matrices
camera thatthat
matrices describe thethe
describe projection
projection equation
equationand
andthe
the position
position and
orientation
orientation relationship
relationship between
between the
the two cameras, respectively. Pinhole camera models
were used to model both cameras in the system (Equation (2)).
λ1 x1 = K1 P0 X
(2)
λ2 x2 = K2 P0 GX
where, assuming that the 3D reconstruction will be carried out in the coordinate frame of
Camera 1: K1 , K2 —intrinsic camera matrices of Cameras 1 and 2; G–extrinsic matrix of
the camera system; X—3D coordinates of scene points; x1 , x2 —coordinates of image points
in the image planes of the two cameras corresponding to points X; λ1 , λ2 —corresponding
scales; P0 —standard projection matrix.
The calibration was carried out based on images of the standard calibration planar
target in the form of a chessboard table captured by two cameras simultaneously. In the
case of synthetic images, a calibration table model of 8 × 9 fields with dimensions of 40 × 40
mm was used. The computed set of renders, consisting of 21 calibration board images
for each of the cameras, was used as input data in the stereo camera system calibration
algorithm in the Computer Vision Toolbox of the MATLAB programming environment.
After the calibration, corresponding pairs of markers were detected on two images
using the Harris corner detection algorithm. With known internal and external parameters
of the two-camera system and a set of corresponding feature points, the metric 3D coordi-
nates of the markers were obtained in the first camera reference frame. Computation was
carried out using the direct linear transformation (DLT) algorithm [31] utilizing epipolar
constraints. The resulting 3D structure is shown in Figure 10a. Figure 10b,c presents the re-
construction projected on two perpendicular planes to better visualize the 3D deformation
of the specimen. The displacement of the free end of the crane structure obtained from the
vision method was equal to 169.908 mm. The error with respect to the true displacement
(obtained in the FEM method, equal to 169.353 mm) amounted to 0.32%.utilizing epipolar constraints. The resulting 3D structure is shown in Figure 10a. Figure
10b,c presents the reconstruction projected on two perpendicular planes to better visualize
the 3D deformation of the specimen. The displacement of the free end of the crane
structure obtained from the vision method was equal to 169.908 mm. The error with
Sensors 2021, 21, 6046 respect to the true displacement (obtained in the FEM method, equal to 169.35312 mm) of 17
amounted to 0.32%.
Sensors 2021, 21, 6046 13 of 17
(a)
(b) (c)
Figure
Figure 10.
10. Three-dimensional
Three-dimensional(3D)(3D)reconstruction
reconstructionof
ofthe
the crane
crane structure
structure obtained
obtained using
using image
image data
data from
from the
the two-camera
two-camera
system: reference case (red) and after application of the load (blue). (a) Three-dimensional (3D) reconstruction and two
system: reference case (red) and after application of the load (blue). (a) Three-dimensional (3D) reconstruction and two
projections; (b) projection on the XZ plane; (c) projection on the XY plane.
projections; (b) projection on the XZ plane; (c) projection on the XY plane.
3.3.
3.3.Case
CaseStudy:
Study:Cantilever
CantileverBeam
Beamwith
withDamage
Damage
The
The third analyzed example consists of
third analyzed example consists of simulating
simulating aa beam
beam with
with damage.
damage. The
Theanalysis
analysis
isis limited
limited to the simple type of defect, which is a discontinuity of the material (incision
to the simple type of defect, which is a discontinuity of the material (incision
introduction).
introduction).The Thedimensions
dimensionsof ofthe
thesimulated
simulatedstructure
structureare
areas
asfollows:
follows:800800mm
mmlength,
length,
40
40 mm wide, 4 mm thickness. Figure 11a shows the location of the modeled defects and
mm wide, 4 mm thickness. Figure 11a shows the location of the modeled defects and
the
theareas
areasof
of the
the constraint
constraint and
and load
load application.
application. The
Theassumed
assumed damages
damages werewere modeled
modeled as as
notches with a 1 mm width and a depth that corresponds to one-third of
notches with a 1 mm width and a depth that corresponds to one-third of the beam’s width the beam’s width
(13.33
(13.33mm).mm).In Inthis
thiscase
casestudy,
study, only
only synthetically
synthetically generated
generated images
images were
were considered.
considered. The
The
performed analysis was of the quasi-static type. The results were obtained
performed analysis was of the quasi-static type. The results were obtained for the unloaded for the
unloaded
case and aftercase the
andload
afterwas
theapplied.
load was Theapplied. The case
case without without
damage wasdamage was
treated as thetreated as
reference
the reference case. Figure 11b shows the deflection results of a beam with three defects
obtained by the FEM solution.is limited to the simple type of defect, which is a discontinuity of the material (incision
introduction). The dimensions of the simulated structure are as follows: 800 mm length,
40 mm wide, 4 mm thickness. Figure 11a shows the location of the modeled defects and
the areas of the constraint and load application. The assumed damages were modeled as
notches with a 1 mm width and a depth that corresponds to one-third of the beam’s width
Sensors 2021, 21, 6046 13 of 17
(13.33 mm). In this case study, only synthetically generated images were considered. The
performed analysis was of the quasi-static type. The results were obtained for the
unloaded case and after the load was applied. The case without damage was treated as
the
case.reference case.
Figure 11b Figure
shows the11b shows results
deflection the deflection results
of a beam with of a beam
three with
defects three defects
obtained by the
obtained by the FEM solution.
FEM solution.
(a)
(b)
Sensors 2021, 21, 6046 14 of 17
Figure
Figure 11.
11. Analyzed
Analyzed beam
beam structure:
structure: model
model scheme
scheme (a)
(a) and
and results of the
results of the beam
beam deflection
deflection under
under load
load (b).
(b).
The procedure
The procedurefor forgenerating
generatingsynthetic images
synthetic remains
images the same
remains as before.
the same The virtual
as before. The
camera was positioned centrally in front of the test sample. The modeled
virtual camera was positioned centrally in front of the test sample. The modeled camera camera had a
sensor
had of 36 ×
a sensor of 24
36 mm, which
× 24 mm, simulated
which the DSLR
simulated the DSLRCanon 5D 5D
Canon Mark II sensor
Mark sizesize
II sensor as as
in
previous case studies. The utilized lens was set to a focal length of 43 mm, and
in previous case studies. The utilized lens was set to a focal length of 43 mm, and the the rendered
image sizeimage
rendered was limited
size wasto 2560 × 600
limited pix. The
to 2560 × 600render shown
pix. The in Figure
render shown12inwas obtained
Figure 12 wasas
one of the results of the analysis.
obtained as one of the results of the analysis.
Figure 12.
Figure 12. Render
Render obtained for the
obtained for the adopted
adopted camera
camera system.
system.
Positions ofof markers
markerson onthe
the reference
reference image
image were were detected,
detected, as in as
theinprevious
the previous
exam-
ples, usingusing
examples, the Harris corner
the Harris detector.
corner The The
detector. displacement of all
displacement of markers
all markerscaused duedue
caused to
damage
to damage introduced
introducedtoto
the beam’s
the beam’sstructure
structurewas
wastracked
trackedusing
usingthe
theDIC
DICalgorithm.
algorithm. As a
result, deflection
deflection curves of the beam under load were were obtained.
obtained. Figure 13 presents the
scaled beam’s deflection for different levels of the introduced damage obtained by image
processing.
An impact of damage on the deflection curve can be seen in Figure 14. The curve
presents a difference between the deflection of the undamaged beam and the deflection
after the introduction of three damage scenarios. The ‘NO DEFECT’ line was introduced as
a reference. For all damage cases, the trends of difference deflection curves can be clearly
seen in the figure, despite the presence of noise. The ‘DEFECT 1’ line corresponds to the
damage introduced at a distance of 200 mm from the clamped side of the beam. In theSensors 2021, 21, 6046 14 of 17
camera frame, it corresponds to an x-distance equal to −200 mm. One can notice that the
red curve
Figure changes
12. Render character
obtained for thenear the camera
adopted x = −200 mm. The horizontal curve becomes
pointssystem.
inclined. Similar behavior can be seen by the difference in deflection curves corresponding
Positions
to the otherof damage
markers cases.
on the‘DEFECT
reference 2’image were detected,
and ‘DEFECT as in thetoprevious
3’ correspond damage at the
examples, using
distances of the
400Harris
mm and corner
600detector.
mm from Thethedisplacement
clamped end of of
allthe
markers
beam,caused due
respectively. The
to damage introduced to the beam’s structure was tracked using the DIC algorithm.
curves representing the difference in deflection of the beam change the slope approximatelyAs a
result, deflection
at points x = 0curves
mm andof thex =beam under
200 mm, load coincides
which were obtained.
with theFigure 13 presents
position the in the
of damage
scaled beam’s deflection for different levels of the introduced damage obtained
camera coordinate frame. This suggests that the change of the slope can be used as an by image
processing.
indicator of damage position.
Sensors 2021, 21, 6046 15 of 17
clearly seen in the figure, despite the presence of noise. The ‘DEFECT 1’ line corresponds
to the damage introduced at a distance of 200 mm from the clamped side of the beam. In
the camera frame, it corresponds to an x-distance equal to −200 mm. One can notice that
the red curve changes character near the points x = −200 mm. The horizontal curve
becomes inclined. Similar behavior can be seen by the difference in deflection curves
corresponding to the other damage cases. ‘DEFECT 2’ and ‘DEFECT 3’ correspond to
damage at the distances of 400 mm and 600 mm from the clamped end of the beam,
respectively. The curves representing the difference in deflection of the beam change the
slope approximately at points x = 0 mm and x = 200 mm, which coincides with the position
of damage in the camera coordinate frame. This suggests that the change of the slope can
Figure
be used
Figure 13.as anDeflection
13. indicator
deflection curve-based
of damage
curve-based deflection
position.
deflection on synthetic
on synthetic images images for different
for different damage damage conditions
conditions
introduced.
introduced.
An impact of damage on the deflection curve can be seen in Figure 14. The curve
presents a difference between the deflection of the undamaged beam and the deflection
after the introduction of three damage scenarios. The ‘NO DEFECT’ line was introduced
as a reference. For all damage cases, the trends of difference deflection curves can be
Figure 14. Difference in deflection of the beam under load for different damage conditions.
Figure 14. Difference in deflection of the beam under load for different damage conditions.
4. Conclusions
This paper presents a new computer simulation methodology for synthetic image
creation. The solution is dedicated to the presentation of mechanical structures under the
influence of external forces. This approach uses the FEM to determine the deformation ofSensors 2021, 21, 6046 15 of 17
4. Conclusions
This paper presents a new computer simulation methodology for synthetic image
creation. The solution is dedicated to the presentation of mechanical structures under the
influence of external forces. This approach uses the FEM to determine the deformation
of the tested system under the influence of loads acting on it. The resulting deformed
finite element mesh is imported into the Blender environment, and synthetic images are
rendered using a GPU. Camera and lens parameters, light source, reflections, material
textures and shadows are considered during the rendering process. The proposed approach
can produce synthetic data that can be used as the input data to test image processing
algorithms, and this is the main area of application of this approach. In some cases, the
proposed methodology can introduce a significant reduction in the time required to obtain
the data compared to the actual experiments. The authors are aware that the application
of the proposed approach does not allow for the omission of experiments but may, for
example, help in choosing the appropriate camera positioning during the actual experiment
and introduce significant time savings.
The aim of the proposed method, the same as for other simulation methods, is to
obtain certain results in a numerical manner with the use of computer resources. The
obtained video data can be further analyzed, depending on the specific need. The proposed
simulation approach can be used to generate synthetic data, e.g., to increase training sets
for neural networks to interpret data in images. It may also help in selecting components
of the target configuration of the vision measurement system in engineering operation
conditions. In such an application, it is necessary to predict the expected displacements
of the structure’s component, which is provided by our solution. It is also necessary to
adjust vision system settings to make the structure’s displacements observable by the
vision measurement system, which can also be simulated by the developed numerical
environment.
The presented application examples of the proposed algorithm at the moment are
limited to the simulation of static scenes, such as structural deflection under load. Sample
analyses were presented using generated synthetic vision data. The study focused on
determining the deflection of the tested structure with the introduced damage (limited
to material discontinuity) and simple and complex load conditions. The last case study
allowed generating images of the structure deflected in 3D. The obtained images allowed
for the 3D reconstruction of the sample in the simulated multicamera system. The selected
results in the paper have been successfully validated experimentally.
As part of the ongoing further work, the authors develop a simulation environment for
synthetic video sequence generation for dynamic phenomena. Such data are needed to test,
for example, motion magnification algorithms or normal modes identification algorithms
based on video sequences. The simulation setup will be also improved to include depth of
field effects in renderings. Initial work in this area has been undertaken, but it requires a
thorough quantitative analysis, which is a part of further research.
Author Contributions: Research conceptualization and project supervision, K.H.; method develop-
ment and software implementation, P.Z.; synthetic data generation, P.Z.; laboratory investigation, P.Z.
and K.H.; image processing and data presentation, K.H.; manuscript writing-literature review, K.H.;
method and investigation presentation, P.Z.; result discussion, P.Z. and K.H. All authors have read
and agreed to the published version of the manuscript.
Funding: The research was conducted within the scope of the project No. LIDER/26/0103/L-
9/17/NCBR/2018 financed by the National Centre for Research and Development in Poland.
Institutional Review Board Statement: This study did not involve humans or animals.
Informed Consent Statement: This study did not involve humans.
Data Availability Statement: The data presented in this study are available on request from the
corresponding author.
Conflicts of Interest: The authors declare no conflict of interest.You can also read