TRANSITIONING TO A LOW-CARBON IRISH ECONOMY: AN ANALYSIS OF REGIONAL LABOUR IMPACTS - EVI D
←
→
Page content transcription
If your browser does not render page correctly, please read the page content below
RESEARCH
SERIES
NUMBER 100      TRANSITIONING TO A LOW-CARBON IRISH
December 2019   ECONOMY: AN ANALYSIS OF REGIONAL
                LABOUR IMPACTS
                KELLY DE BRUIN, MARTINA LAWLESS, EOIN MONAGHAN AND
                AYKUT MERT YAKUT

                             ENCE FOR POL
                           ID            IC
                         EV                Y
Transitioning to a Low-Carbon Irish Economy: An Analysis of
                                Regional Labour Impacts

Kelly de Bruin
Martina Lawless
Eoin Monaghan
Aykut Mert Yakut

December 2019

RESEARCH SERIES
NUMBER 100

Available to download from www.esri.ie

©   The Economic and Social Research Institute
Whitaker Square, Sir John Rogerson’s Quay, Dublin 2

ISBN 978-0-7070-0514-0

DOI https://doi.org/10.26504/rs100

This Open Access work is licensed under a Creative Commons Attribution 4.0 International License (https://
creativecommons.org/licenses/by/4.0/), which permits unrestricted use, distribution, and reproduction in
any medium, provided the original work is properly credited.

                                                    1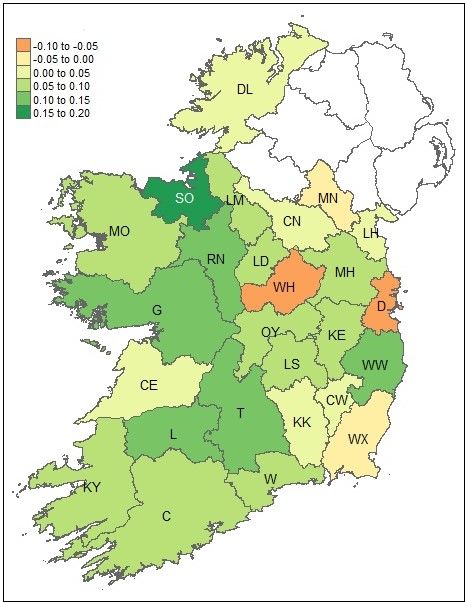
ABOUT THE ESRI

The mission of the Economic and Social Research Institute is to advance evidence-based policymaking
that supports economic sustainability and social progress in Ireland. ESRI researchers apply the highest
standards of academic excellence to challenges facing policymakers, focusing on 12 areas of critical
importance to 21st century Ireland.

The Institute was founded in 1960 by a group of senior civil servants led by Dr T. K. Whitaker, who
identified the need for independent and in-depth research analysis to provide a robust evidence base for
policymaking in Ireland.

Since then, the Institute has remained committed to independent research and its work is free of any
expressed ideology or political position. The Institute publishes all research reaching the appropriate
academic standard, irrespective of its findings or who funds the research.

The quality of its research output is guaranteed by a rigorous peer review process. ESRI researchers are
experts in their fields and are committed to producing work that meets the highest academic standards
and practices.

The work of the Institute is disseminated widely in books, journal articles and reports. ESRI publica-
tions are available to download, free of charge, from its website. Additionally, ESRI staff communicate
research findings at regular conferences and seminars.

The ESRI is a company limited by guarantee, answerable to its members and governed by a Council, com-
prising 14 members who represent a cross-section of ESRI members from academia, civil services, state
agencies, businesses and civil society. The Institute receives an annual grant-in-aid from the Department
of Public Expenditure and Reform to support the scientific and public interest elements of the Institute’s
activities; the grant accounted for an average of 30 per cent of the Institute’s income over the lifetime
of the last Research Strategy. The remaining funding comes from research programmes supported by
government departments and agencies, public bodies and competitive research programmes.

Further information is available at www.esri.ie

                                                    2
THE AUTHORS
Martina Lawless in an Associate Research Professor at the Economic and Social Research Institute
(ESRI). Kelly de Bruin and Aykut Mert Yakut are Research Officers, and Eoin Monaghan is a Research
Assistant at the ESRI.
ACKNOWLEDGEMENTS
The research carried out in this report was funded by the Department of Communications, Climate Action
and Environment (DCCAE) and is part of an ongoing modelling project.
This report has been accepted for publication by the Institute, which does not itself take institutional policy posi-
tions. The report has been peer reviewed prior to publication. The authors are solely responsible for the content
and the views expressed.
3Table of Contents
1 Introduction 6
2 Methods 7
2.1 The I3E Model . . . . . . . . . . . . . . . . . . . . . . . . . . . . . . . . . . . . . . . 7
2.2 Regional linking . . . . . . . . . . . . . . . . . . . . . . . . . . . . . . . . . . . . . . . 10
3 Scenario Design and Results 11
3.1 Macroeconomic Results . . . . . . . . . . . . . . . . . . . . . . . . . . . . . . . . . . . 12
3.2 Sectoral Results . . . . . . . . . . . . . . . . . . . . . . . . . . . . . . . . . . . . . . . 13
3.3 Regional Analysis . . . . . . . . . . . . . . . . . . . . . . . . . . . . . . . . . . . . . . 15
4 Conclusion 20
References 21
Appendix Lists of Sectors, Commodities, and Counties 22
4EXECUTIVE SUMMARY
Introduction
Ireland has legally binding emissions reduction targets for 2020 and 2030. To achieve these targets and to
become a low-carbon economy, the government uses carbon taxation as one of the primary policy tools.
In addition, ceasing of peat and coal, which are the most polluting energy commodities from electric-
ity production, is planned. However, given the concentration of specific production sectors in specific
regions, there is a concern that the labour impacts for certain regions/counties will be high, compared
to others. This report explores the projected county-level variation in labour demand impacts for 2030,
following an increase in the carbon tax and removal of coal and peat in electricity production. More
specifically, the electricity production sector will gradually phase out coal and peat from the production
process, their usages will be terminated in 2026 and 2029, respectively, and the carbon tax will increase
C6 annually starting from 2020 and reach C80 in 2029 per tonne CO2 -eq. We combine the labour demand
output from the Ireland Environment, Energy and Economy (I3E) computable general equilibrium (CGE)
model, with regional employment statistics to highlight sectoral and county-level variation. Firstly, we
assess the sectoral labour demand impacts, and these sectoral results are then “shared out” to evaluate
labour demand impacts for each county.
Main Findings
• Government-based sectors such as health, education and public administration face positive labour
demand impacts owing to an increase in government consumption due to the increased carbon tax.
• Meanwhile, carbon-intensive sectors like mining and transportation stand to face negative labour
demand impacts. However, these most-impacted sectors are not amongst the largest in the economy.
• The overall county-level results are positive for most counties, with Sligo, Roscommon, Galway
and Tipperary faring the best.
• Dublin and Westmeath face the most negative labour demand impacts, due to their comparatively
larger shares of employees in the most-impacted sectors. It must be said, however, that these
impacts are relatively small.
• Our results indicate the need to design climate change policy with adequate focus on those sectors
and regions which stand to face disproportionate labour impacts.
51 Introduction
Increased recognition of human-induced (anthropogenic) climate change and its impacts on societies has
led to global mitigation commitments to reduce greenhouse gas (GHG) emissions. In 2015, the Paris
Agreement1 was adopted, and to date, it has been ratified by 194 states and the European Union (though
the US has begun formal procedures to withdraw from the agreement). As an EU member state, Ireland
is committed to a 20% reduction in its GHG emissions compared to 2005 levels by 2020.2 Ireland also
faces a renewable energy target of 16% of final energy use and 10% of energy use in transportation. These
targets are legally binding, and Ireland will face fines should it not meet its targets, though the exact level
of these fines is uncertain.
The Irish government has confirmed its commitment to transitioning to a low-carbon economy, in
the recently published Irish All of Government Climate Action Plan (Government of Ireland, 2019).
Furthermore, the government increased the Irish carbon tax from C20 to C26 per tonne of CO2 in Budget
2020, with a view to subsequent annual C6 increases such that the tax will reach C80 per tonne by 2030.
A major concern with transitioning to a low-carbon economy is ensuring a fair distribution of the
associated costs across businesses and households. A core focus of a just transition relates to jobs and
livelihoods. Given the concentration of specific production sectors in specific regions, there is a concern
that the labour impacts for certain communities will be high.3 The Irish government has emphasised the
need for a just transition, meaning that the government is committed to making changes while ensuring
that no member of society gets left behind.
Most of the existing literature on environmental taxation is concerned only with national, macro
and micro levels, including households’ and firms’ results. For example, early work from FitzGerald &
McCoy (1992) uses the ESRI’s HERMES model to investigate the economic effects of the introduction
of a combined carbon/energy tax in Ireland. It finds that unemployment initially increases following the
imposition of the tax, but after that decreases as emigration increases. Kato et al. (2013) uses a vector
autoregression method to analyse the impacts of a carbon tax increase in the German economy. It finds
that employment and output increase whenever the revenue from the tax is used to subsidise less carbon-
intense industries. IILS (2011) finds, intuitively, that energy tax reforms are most supportive to less
carbon-intensive jobs while being less supportive to more carbon-intense industries, though the level of
impact in these sectors depends on the level of substitution of factor inputs to more renewable sources.
Only a handful of other papers evaluate regional-level variation. In Belgium, Vandyck & Regemorter
(2014) employs a CGE model to evaluate the regional effects of an increase in oil excise. It finds variable
regional macroeconomic effects depending on the energy-intensity of a region’s industries, and these
effects change with the choice of the revenue recycling scheme. In the case of China, Zhang et al. (2019)
finds regional disparity which changes depending on the recycling scheme: when a carbon tax is used to
1 https://bit.ly/2Kke05A
2 https://bit.ly/2CH76Di
3 Throughout the text, the terms “region” and “county” are used interchangeably.
6cut production tax, the more affluent regions of China are made better off, whereas this case is reversed
if the revenue is instead used as a transfer to low-income households. Elsewhere, Ciaschini et al. (2012)
also use CGE modelling to analyse regional disparity in Italy, finding positive effects for the North-Centre
region, but potentially negative impacts on employment in the South-Islands area. Lastly, Hassett et al.
(2009), in contrast, finds that average tax burdens from carbon taxes in the USA have fluctuated, but that
by 2003 the variation had subsided.
This report investigates the potential impact of a transition to a low-carbon economy on labour de-
mand across counties in Ireland. We do this by augmenting the labour demand results of our CGE model
with county-level employment statistics. The key findings at a sectoral level are that government-based
sectors like education, health services and public administration will have positive labour demand im-
pacts, while the mining and transportation sectors will have negative impacts. However, the latter sectors
are not amongst the largest in the economy as a whole. At a regional level, we find that the majority of
counties see overall positive labour demand impacts, the main exceptions being Dublin and Westmeath,
owing to their relatively larger shares of workers in the negatively impacted sectors.
The report is structured as follows. Section 2 outlines the I3E model which underpins this analysis,
while also outlining the methodology used to apply county-level analysis to our results. Section 3 presents
the results of the paper, beginning firstly with sectoral-level results, before showing how these sectoral
results are “shared out” across the country. Section 4 concludes.
2 Methods
In this report, we apply the I3E model to investigate the impacts of climate policy on wage rates and
labour demand across production sectors. We then use Central Statistics Office (CSO) data concerning
the location of firms in the various production sectors to examine the spread of labour impacts across
counties. In this section, we will first introduce the I3E model and then discuss how the I3E results are
distributed across regions.
2.1 The I3E Model
The I3E model is the first fully dynamic, i.e. intertemporal, CGE model for the Irish economy. Pertinently,
each production activity in the model has associated GHG and related output, thereby directly linking the
economic and environmental aspects of the economy.
In the following subsections, the economic agents defined in the model and the interactions across
these agents are discussed in a non-technical manner. The technical details of the model economy are
provided in de Bruin & Yakut (2019b). The model parameters are calibrated by using an energy social
accounting matrix (ESAM). The data sources and the details of the construction process of the ESAM are
available in de Bruin & Yakut (2019a).
71. Households: The I3E model includes ten representative household groups (RHGs). The RHGs
with the abbreviations u1 to u5 are the urban resident households, where u1 (u5) represents the
poorest (richest) RHG. Similarly, the RHGs with the abbreviations r1 to r5 are the rural resident
households, and r1 (r5) represents the poorest (richest) RHG. The RHGs are constructed by using
the Household Budget Survey (HBS) of 2015–2016. Each household in the survey is uniquely as-
signed to a RHG; household-level values of all income items and private consumption expenditures
by commodities are then summed to generate the RHG aggregates. In this way, the RHGs defined in
the I3E model have distinct compositions of disposable income and private consumption, resulting
in heterogeneous policy impacts across household types. As the HBS does not provide individual-
level data, the Survey on Income and Living Conditions (SILC) is used to obtain the composition
of household wage income regarding the types of labour (i.e. low-, medium- and high-skilled).
Households determine their optimal level of composite (total) consumption by maximising their
utilities subject to their budget constraint. The budget constraint of a RHG equates disposable in-
come – the sum of wage income, dividend income, welfare transfers and pension income from the
government, and net factor income from abroad – to the sum of total consumption expenditures
and savings. The equilibrium between total income and expenditures must hold in every period of
time. Household savings are determined as a residual, i.e. what households do not spend is saved.
2. Firms and Production: The production sector comprises 32 representative activities/firms which
represent the different industries in the Irish economy. A list of the different sectors is presented
in the Appendix. Each firm uses material inputs, energy inputs, labour and capital to produce a
specific good. Firms are allowed to produce multiple product types, i.e. a firm can produce two
or more products which are either secondary outputs of the primary production process or entirely
different products. The I3E model models the interactions between different production sectors
through the flow of inputs and outputs between sectors. The main data source to replicate inter-
sectoral linkages in the Irish economy is the Supply and Use Tables (SUTs) provided by the CSO.
The original SUTs provide information on which industry produces which products, the monetary
value of production of each product, the cost of intermediate inputs, the value of gross value-added
(payments to the factors of production), production taxes paid to the government, etc. The Labour
Force Survey (LFS) is used to disaggregate the sectoral labour demand into types of labour. The
bulk of activities determine the level of physical investment by maximising the value of the firm in
an intertemporal manner.4
3. Commodities: There are 39 commodities or goods in the I3E model: two of them are entirely
imported (crude oil and coal), 33 are both domestically produced and imported, and the supply
of four commodities is entirely provided by domestic producers. The energy/carbon commodities
included in I3E are peat, coal, natural gas, diesel, gasoline, kerosene, LPG, crude oil, fuel oil,
4 Having an intertemporal investment decision of firms allows the I3E model to explore economic dynamics in a more real-
istic framework. In the absence of such a feature, the model dynamics would only rely on the consumption smoothing of
households, as households seek to achieve a stable level of utility over time.
8other petroleum products, and electricity. The total domestic demand for a commodity is equal
to the sum of six items: intermediate input demand, household demand, government demand,
investment demand, trade and transportation margin demand, and finally export demand. The SUTs
provide data on the sources of supply (domestic production and import) and the sources of demand.
From the supply side, domestic production and import are assumed to be imperfect substitutes for
each other, i.e. a final consumer cannot substitute its domestic demand for import in a one-to-one
manner. Each component of demand results from the optimisation of a user: intermediate input
demand results from production cost minimisation by firms; household demand results from utility
maximisation, government demand is a fixed share of the total government demand, investment
demand is a fixed fraction of the total investment expenditures, trade and transportation margin
demand is a fixed fraction of output, and export demand results from revenue maximisation by
firms. For each commodity, an equilibrium condition is defined and associated with the price of the
commodity, i.e. the commodity prices are endogenously solved in the model.
4. Labour Types: There are three types of labour in the I3E model: low-skilled, medium-skilled, and
high-skilled. For the fixed supply of each type of labour, the labour market equilibrium conditions
solve for the optimal wage rate. The SILC and LFS are utilised to get the compositions of wage
income of households and labour demand of sectors, respectively.
5. Enterprises: The model includes an “enterprises” account, where a representative enterprise is
assumed to be the owner of all firms. The account collects all gross sectoral profits and receives
transfers from the government, which are fixed in nominal terms, and pays corporate tax to the
government. The remaining amount is either saved by the enterprise account (fixed fraction of
net-of-tax profit receipts) or paid to households as dividend payments.
6. Government: The I3E model has an explicit representation of the government sector. The govern-
ment collects direct taxes on labour incomes and sectoral profits (corporate tax), indirect taxes on
sales of commodities, the carbon tax on energy commodities, the export tax on exported electricity,
production tax on production activities, and half of the cost of ETS due to the EU legislation. The
carbon tax, which is exogenously determined by the government, is implemented as a fixed price of
per-tonne equivalent of carbon and collected on the domestic consumption of energy-commodities.
The government allocates its total revenues to the consumption of commodities, welfare transfers
and pension payments to households (fixed in real terms - indexed to the average wage), transfers to
enterprises (fixed in nominal terms), and interest payments over the outstanding foreign debt stock.
The difference between total revenues and expenditures of the government is public saving which
drives changes in the foreign debt stock, i.e. as public saving increases (decreases), the government
debt stock becomes lower (higher).
7. Rest of the world: All monetary flows between the rest of the world and Ireland are traced within
the RoW account. The sources of the foreign exchange supply are exports of commodities and
9the net factor income of households. The sources of foreign exchange demand are imports of
commodities, the interest payments of the government over the outstanding foreign debt stock, and
half of the cost of ETS due to the EU legislation. The difference between the totals of foreign
exchange supply and demand is covered by foreign savings, i.e. the current account balance. The
foreign market closure rule implies that for the given level of foreign savings, the equilibrium in
the rest of the world account is ensured by the exchange rate adjustment.
8. Emissions Trading Scheme (ETS): This is the primary environmental policy tool of the European
Union (EU), where sectors covered by the system have to buy allowances if their emissions exceed
their free allowances.5 The combustion-related emissions of the manufacturing sectors are partially
and the emissions of energy production sectors are fully subject to the EU-ETS legislation. The I3E
model has an explicit representation of the ETS: each activity takes into account its composition of
energy demand, the activity emissions subject to the ETS, and free allowances to reduce its ETS
emissions and thus the cost of the ETS. In this respect, each activity pays the same purchaser, i.e.
retail, price to buy an energy commodity but the perceived cost of unit demand is a function of the
activity’s ETS coverage, free allowances, and the EU-ETS price which is an exogenous variable.
2.2 Regional linking
In this section, we outline the method used to calculate the county-level labour demand impacts based on
the I3E’s sectoral-level labour demand results. The I3E model results show the level of labour demand,
per sector and skill-type, for each year under different experimental scenarios. The issue with the I3E
results is that they represent sectoral labour demand change for the whole of Ireland and cannot, by
themselves, inform us of any regional implications.
The county-level sectoral employment data is applied to supplement the I3E output to undertake
a regional impact assessment. The CSO Business Demography dataset provides sectoral employment
statistics for each of the 26 Irish counties. Importantly, the county-level breakdown is determined by
the address at which an enterprise is registered. This is not necessarily the same as where the business
conducts its day-to-day operations. It also means that, for an enterprise with multiple businesses located
in different counties, all workers are counted as being registered in the single county from where the main
office operates. Furthermore, the regional employment data is only available for 16 aggregated production
sectors. The I3E model outputs, however, include a high level of detail. The production sector comprises
32 representative activities that represent the different industries. Using the NACE sector codes, the I3E
sectors are mapped to the broader CSO sectors, and the requisite I3E labour demand results are aggregated
to the broader CSO sectors using this mapping.
The regional employment data is applied to calculate county-level sectoral labour shares, by dividing
the number of workers in sector x in county y by the total country-level number of workers in sector x,
thus giving us the proportion of workers in each county for each production sector. We assume that these
5 For more information, see EPA (2018).
10county-level proportions are fixed over time. As the CSO Business Demography dataset does not include
employment data for the agriculture and public administration sectors, additional datasets are utilised to
calculate the county-level shares for these sectors.6
The relevant country-level I3E sectoral labour demand results are distributed across counties using
the computed county-level shares to obtain the future regional impacts of a policy. For example, if the I3E
model computed that 100,000 people are working in sector x in 2030 in a specific policy scenario, those
100,000 workers are distributed to each county according to their calculated 2017 county proportions.
The total county-level labour demand is then calculated, by aggregating the labour demand from each
sector in a county, representing the county’s projected labour force size under a policy. This figure is then
compared to the business-as-usual (BaU) scenario results, to provide overall county-level percentage
changes in terms of labour demand.
3 Scenario Design and Results
This paper presents a policy scenario in which an increase in the carbon tax and a shift away from coal
and peat usage in electricity production are jointly considered. A positive linear trend is assumed for the
carbon tax: its level will increase C6 annually starting from 2020 and reach C80 in 2029. Furthermore,
the electricity production activity will gradually phase out coal and peat from the production process, and
their usages will be terminated in 2026 and 2029, respectively.7 The results will be summarised compared
to the BaU scenario in which the abovementioned policy changes are assumed not to be realised. Along
the path of BaU, the total share of peat and coal in the total energy demand of the electricity production
sector decreases from 23% in 2014 to 13.8% and 13.6% in 2020 and 2030, respectively. In the scenario
analysis, on the other hand, the total share of peat and coal will be 9.7% in 2020 and zero in 2030,
respectively. As the current version of the I3E model does not include renewable energy sources, it is
assumed that the electricity production sector substitutes natural gas for peat and coal.8 The share of
natural gas gradually increases from 34.4% in 2014 to 43.2% and 43.5% in 2020 and 2030 along BaU.
However, in the scenario analysis, its share will be 47.4% and 54.9% in 2020 and 2030, respectively.
6 In the case of the agriculture sector, two datasets are combined, one which contains updated 2017 employment data, but
only at a regional (i.e. West, East, Midlands, etc.) level and one with county-level employment data for 2010. The 2010
county-level shares are used to disaggregate the 2017 regional labour data into the respective counties, to obtain the 2017
share parameters. For public administration, we use the “Population Aged 15 Years and Over in the Labour Force” CSO
dataset.
7 Note that the Electricity Supply Board (ESB) has indicated that two of its peat plants in the Midlands will close at the end of
2020.
8 The absence of renewable energy sources has repercussions mainly on the emissions figures and the cost of electricity
production. If there were renewables in the model, the electricity production sector would switch its demand from coal
and peat either entirely to renewables or to a mix of renewables and natural gas. Since renewables are entirely indigenous
production and their marginal cost is virtually zero, the cost of electricity production and thus the cost of production in other
sectors will be lower, and the improvements in the trade balance and real GDP will be higher. Moreover, since natural gas
is also a fossil fuel, increasing the share of renewables will have higher impacts on the emissions reduction process. The
disaggregation of the electricity production sector into conventional and renewable-based sectors is in progress.
11In this section, we present the results concerning the county-level labour impacts. Firstly, we present
the sectoral labour demand results from the I3E model. These results are then combined with county-level
production statistics to determine county-level regional variation in labour demand impacts as a result of
the tax. The results will concentrate on comparisons across production sectors.
It is important to note that the representation of the labour market in the I3E model is such that labour
supply is given exogenously. Labour supply is assumed to grow at the pace of population growth. Hence,
total labour demand will be equal in the BaU case and in the case of policy changes considered in this
report. The relative shares of labour demand in each production sector, however, will change due to
policies. A repercussion of this structure on the sectoral composition of the labour demand is that if a
sector is negatively affected by a shock, its employees will be displaced from this sector. Their wage rate
will decline, and as there is no unemployment in the model yet, they will be employed in another sector
which is affected either less adversely or positively.
It should also be noted that the following subsections will focus only on the results of the year of
2030, although the I3E model allows us to explore the joint impacts of policy changes for the entire
model horizon, which is the year of 2055. The reason is that this paper focuses on the regional impacts,
and the data used to disaggregate the macroeconomic aggregates to the regional figures is available only
for 2017. In other words, as the regional analysis is static under the assumption that there will be no
changes in the future regarding the shares of counties in total employment, providing the results for
multiple periods would not add much to understand the regional impacts better.
3.1 Macroeconomic Results
The macroeconomic results are mainly driven by the phasing out of fossil fuels from the electricity pro-
duction process due to the lower cost of electricity production, which eliminates the adverse economic
impacts of increasing the carbon tax. The mechanism can be summarized as follows. The commodity
coal is entirely imported, and the major portion of its total supply is demanded by the electricity pro-
duction sector. As it is phased out from the production process, the import demand for coal shrinks by
96%, compared to BaU. As the sector switches its demand from coal to natural gas, which is both pro-
duced domestically (63% of the total domestic supply) and imported (37% of the total domestic supply),
demand for natural gas increases, which, in turn, invokes its domestic production as well as its import.
However, since the international price of coal is lower than that of natural gas, there is an improvement
in the trade balance. In addition, the cost of electricity production declines, which, in turn, lowers the
cost of production and thus, domestic commodity prices. Lower domestic prices lead to lower inflation
and lower the wage rate (by around 2.5%).9 Lower commodity prices induce final demand of all agents
in real terms, and the impact is the highest for the government (2.2%), which is followed by the trade
balance (0.9%) in 2030, compared to BaU. As a result, real gross domestic product (GDP) will be 0.65%
higher than its BaU level in 2030. Without phasing out coal and peat, increasing the carbon tax would
9 The low-skilled workers are hit the hardest concerning the decline in the wage rate, but the differences across the labour types
are negligible.
12lead to a 0.6% decline in real GDP, compared to BaU. Therefore, transitioning to a low-carbon electricity
production leads to a one percentage point increase in the level of real GDP in 2030, compared to BaU,
due to the decline in the cost of production.
3.2 Sectoral Results
Figure 1 presents the changes in labour demand in percentage terms compared to BaU as a result of the
climate policies for the aggregated production sectors.10 Impacts are largest in the mining sector, which
faces an almost 8% decrease in labour demand, and the transportation sector with a 5% decrease. Several
Figure 1: Labour demand in 2030 for aggregated production sectors, percentage change w.r.t. BaU
sectors face increases in labour demand such as agriculture, education, health, and public administration.
As real government consumption increases, this leads to increases in labour demand in sectors with higher
levels of government consumption for the commodities produced by sectors such as public administration,
education, and health.
While Figure 1 depicts the sectoral-level labour demand changes, a number of these sectors are com-
prise multiple sectors. In order to illuminate the underlying results which drive the labour demand results
for these composite sectors, the labour demand results for those disaggregated sectors are given below.
For the manufacturing sector, there is a variety of results, depicted in Figure 2. We see comparatively
larger negative labour demand impacts for the petroleum and basic metal manufacturing sectors, with
other smaller negative labour demand impacts for the pharmaceuticals, chemical and other manufacturing
sectors. These negative labour demand impacts can be explained by the associated high levels of carbon
used to maintain these industries. In contrast, there are larger positive labour demand impacts for the
10 Sectoral abbreviations are as follows: ACC Accommodation and Hotel Services; AGR Agriculture; CON Construction; EDU
Education sector; ENG Electricity and Natural Gas; FSR Financial Services; HHS Health sector; ICT Telecommunication
services; MAN Manufacturing; MIN Mining; PUB Public sector; RES Real estate services; SER Other services; T RD Trade;
T RP Transportation; WAT Water and sewage. Full details are provided in the Appendix.
13Figure 2: Labour demand in 2030 for disaggregated manufacturing sector, percentage change
w.r.t. BaU
textiles and wood product sectors, and small labour demand increases in the high-technology and other
industrial products sectors. Likewise, these impacts can be explained by the low carbon-intensive nature
of these industries.
With regards to the mining sector, shown in red in Figure 3, it is unsurprising to see that the impacts
in the aggregate mining sector are almost entirely driven by labour demand reductions in the peat sector.
The results imply a more than 30% decrease in labour demand in the peat sector, compared to the BaU
scenario. As demand for peat in the economy declines (owing to the lack of availability of peat), the
amount of labour required to meet that demand will also decline. One would expect such a large labour
demand impact for the peat sector, given the plans to phase out the use of peat in the economy gradually
starting from 2019. However, it should be noted that the share of the peat sector in economy-wide
employment was 0.05% in 2014.
The electricity and natural gas sector demonstrates interesting and contrasting results, depicted in
green in Figure 3. We see that the labour demand of the electricity sector goes down, due to the increase
in electricity price. On the other hand, the gas sector’s labour demand goes up, since natural gas replaces
coal and peat in electricity generation and is, therefore, more demanded.
Lastly, for the transportation sector, shown in blue in Figure 3, there are associated labour demand
decreases for all types of transportation. However, the most impacted sector is the air transportation
sector, since this sector is the most carbon-intensive. The land and water transportation sectors also face
labour demand decreases, being a little more than half as impacted as the air transportation sector.
It is also worth evaluating the relative importance of these impacted sectors by considering their
respective sectoral value-added. As it transpires, the most affected sectors are comparatively small in
terms of their value-added, namely the peat, electricity production, petroleum and multiple manufacturing
sectors. The sectors with the largest value-added are comparatively less negatively or even positively
14Figure 3: Labour demand in 2030 for disaggregated mining, electricity and natural gas, and
transportation sectors, percentage change w.r.t. BaU
affected. These include the services sectors, as well as education, health, and public administration.
Finally, how do these labour demand impacts affect on the worker? As described in section 2.1, the
I3E model includes three labour skill types. For each labour type, supply and demand determine the
equilibrium wage rate. As the most impacted sectors have relatively higher shares of medium-skilled
(MSL) and particularly low-skilled labour (LSL), these labour types face larger wage decreases, though
the differences are minimal. Note that the modelling framework applied does not include the explicit
modelling of new technologies or industries and hence, only captures changes in labour demand in ex-
isting production sectors. It can well be argued that investments in new green technologies will create
additional labour demand and push wages up.
3.3 Regional Analysis
Having presented the sectoral labour demand impacts from the increased carbon tax, we can now evaluate
how these impacts will be spread across counties. We look firstly at the most impacted sectors, before
presenting the overall results.
We highlighted that the production sectors which are most likely to be negatively impacted in terms
of labour demand change are the mining and transportation sectors. To illustrate which counties may be
most affected by employment changes in these sectors, we map the county-level employment shares, i.e.
which share of the counties’ labour force works in the sector, for each of these vulnerable sectors. These
results are presented in Figures 4 and 5.11
In the mining sector, we see that Roscommon and Carlow are likely to face the most significant nega-
tive labour demand impacts since a comparatively more substantial share of their workforce is employed
11 County abbreviations are given as the nationally recognised vehicle registration plates. A full list of the abbreviations is given
in the Appendix in Table 3.
15in these sectors. However, note the relatively small value of these shares; around 1% of the total work-
force in these counties. Indeed, when looking again at the overall county-level labour demand impacts,
we see that Roscommon has an overall positive labour demand impact, due to its share of positively
impacted sectors, while Carlow sees only a minimal negative impact.
For the transportation sector, counties in the Midlands and the East are more impacted than those
in the West and the South. The two most impacted counties are likely to be Monaghan and Dublin, for
which the transportation sector accounts for around 6% of the total workforce. In the case of Dublin, this
is due to its large share of air transportation employment in the country.
Figure 6 presents the projected 2030 labour demand impacts, compared to the BaU scenario. These
impacts reflect the total aggregated sectoral-level labour demand impacts. As can be seen on the map,
there is a moderate level of county-level variation, with a mixture of positive and negative impacts. In
terms of overall positive labour demand impacts, Western and Southern counties fair better, on average,
than Eastern and Border counties. We project that Sligo will have the greatest positive overall labour
demand impact at around 0.15%. This can be explained by Sligo’s very low share of workers in the
most negatively impacted sectors, namely mining and transportation, and its higher share of workers in
positively impacted sectors, such as the aforementioned government-based jobs. Despite its high national
share of workers in the mining sector, Roscommon is projected to have one of the most significant overall
positive labour demand increases, along with Tipperary and Galway. Similarly, the reasons for these
counties’ positive outlook is their relatively higher share of employees in the health services, education
and public administration sectors.
Only a handful of counties are projected to have overall negative labour demand impacts. The two
most impacted counties are Dublin and Westmeath, whose overall labour demand is projected to decrease
by around 0.1% and 0.06% respectively. For the former, these results can be explained by Dublin’s larger
comparative share of workers in negatively impacted sectors like transportation and trade. In the case of
Westmeath, the overall negative impact seems to mainly be derived from that county’s very low share of
workers in the health service (the most positively impacted) sector. Note, of course, that the large Dublin
workforce will account for a more significant number of people than other counties, which is not reflected
in the percentage-based analysis. Also, as our analysis is conducted based on the location of firms, the
reduction in Dublin labour demand could have spillover impacts on surrounding commuter counties.
16Figure 4: County-level shares of sectoral employment in total employment, transportation
17Figure 5: County-level shares of sectoral employment in total employment, mining
18Figure 6: Labour demand in 2030 for aggregated production sectors, percentage change w.r.t. BaU
194 Conclusion
In conclusion, we have outlined the projected sectoral labour demand impacts from an increase in the
carbon tax, and a shift away from coal and peat use in electricity production. These sectoral impacts were
then used to evaluate the likely regional impacts at an Irish county level, in order to accurately assess
which counties may be disproportionately affected by the tax increase.
We established, as would be expected, that the mining and transportation sectors are most negatively
affected, owing to their higher levels of carbon consumption. Meanwhile, government-based sectors like
education, public administration and health services are likely to be the most positively affected in terms
of labour demand. However, these most-impacted sectors have a comparatively lower value-added, and
the sectors with the most value-added are mostly unaffected.
At a regional level, we find a moderate level of county variation in terms of overall labour demand
impacts resulting from the environmental policies. Our paper projects that Sligo, Galway, Roscommon
and other Western counties will have the most considerable positive labour demand impacts, owing to
their higher share of workers employed in government-based jobs. Meanwhile, Westmeath and Dublin
are likely to face the most substantial negative labour demand impacts, due to their comparatively larger
shares of employees in the most negatively impacted sectors.
Within the most negatively impacted sectors, we find that Roscommon and Carlow are likely to face
the most significant negative impacts in the mining sector, while in the transportation sector, Dublin and
Monaghan are likely to be most negatively affected. These results are due to the size of the share of their
workforce in these industries. It must be added, however, that these percentages are not large, and indeed
Roscommon’s negative labour demand impacts for mining are outweighed by positive labour demand
impacts in other sectors.
Our study provide informative results for policy designers with regards to the carbon tax. In particular,
it highlights the possible disproportionate impacts of the tax. A properly designed carbon tax policy, as
well as the movement towards decarbonisation in these negatively affected sectors, may help to alleviate
any possible negative labour demand impacts in the relevant sectors and counties and thus facilitate a
“just transition” towards a non-carbon economy.
20References
Ciaschini, M., Pretaroli, R., Severini, F., & Socci, C. (2012). Regional Double Dividend from Environ-
mental Tax Reform: An Application for the Italian Economy. Research in Economics, 66, 273-283.
doi: 10.1016/j.rie.2012.04.002
de Bruin, K. C., & Yakut, A. M. (2019a). Construction of the Energy Social Accounting Matrix for
Ireland (ESRI Survey and Statistical Report Series No. 78). Economic and Social Research Institute
(ESRI). doi: 10.26504/sustat78
de Bruin, K. C., & Yakut, A. M. (2019b). Technical Documentation of I3E Model, Version 2 (ESRI
Survey and Statistical Report Series No. 77). Economic and Social Research Institute (ESRI). doi:
10.26504/sustat77
Environmental Protection Agency (EPA). (2018). Who Needs a Permit? https://bit.ly/2XaOqoV.
FitzGerald, J., & McCoy, D. (1992). The Economic Effects of Carbon Taxes. The Economic and Social
Research Institute.
Government of Ireland. (2019). Climate Action Plan 2019 To Tackle Climate Breakdown. https://
bit.ly/2O6Uj2u.
Hassett, K. A., Mathur, A., & Metcalf, G. E. (2009). The Incidence of a U.S. Carbon Tax: A Lifetime
and Regional Analysis. The Energy Journal, 30, 155-177.
IILS. (2011). The Double Dividend and Environmental Tax Reforms in the European Union (EC-IILS
Joint Discussion Paper No. 13). International Institute for Labour Studies.
Kato, M., Mittnik, S., Samaan, D., & Semmler, W. (2013). Employment and Output Effects of Climate
Policies (Tech. Rep. No. 12). Center for Quantitative Risk Analysis (CEQURA).
Vandyck, T., & Regemorter, D. V. (2014). Distributional and Regional Economic Impact of Energy Taxes
in Belgium. Energy Policy, 72, 190-203. doi: 10.1016/j.enpol.2014.04.004
Zhang, K., Xue, M.-M., Feng, K., & Liang, Q.-M. (2019). The Economic Effects of Carbon Tax on
China’s Provinces. Journal of Policy Modeling, 41, 784-802. doi: 10.1016/j.jpolmod.2019.02.014
21Appendix
Lists of Sectors, Commodities, and Counties
Table 1: Sectors
Activity NACE Codes Aggregate Sector
ACC Accommodation & hotel services 55–56,79 ACC
AGR Agriculture 1-3 AGR
CON Construction 41–43 CON
ELC Electricity ENG Electricity and
NGS Natural gas supply ENG Natural Gas
FSR Financial services 64–66,77 FSR
PUB Public sector 84 PUB
TRD Trade 45–47 TRD
BFM Basic metal manufacturing 24–25 MAN
BPP Basic pharmaceutical products 21 MAN
CHE Chemicals and chemical products 20 MAN
FBT Food, beverage and tobacco 10–12 MAN
HTP High-technology products 26–28 MAN
OIN Other industrial products 17,18,33 MAN
ONM Other non-metallic products 23 MAN Manufacturing
OTM Other manufacturing 31–32 MAN
PET Petroleum MAN
RUP Rubber and plastic products 22 MAN
TEX Textile 13–15 MAN
TRE Transportation equipment 29–30 MAN
WWP Wood and wood products 16 MAN
OMN Other mining products MIN
Mining
PEA Peat MIN
ATS Air transportation 51 TRP
LTS Land transportation 49 TRP Transportation
WTS Water transportation 50 TRP
WAT Water and sewerage 36,37–39 WAT
EDU Education sector 85 EDU
HHS Health sector 86–88 HHS
RES Real estate services 68 RES
SER Other services remaining* SER
TEL Telecommunication services 61 ICT
*: It excludes NACE codes 5-9 (Mining, Quarrying and Extraction), 19 (Petroleum Products), and
35 (Electricity and Gas Supply).
Note: The activities without NACE codes are further disaggregated sectors.
22Table 2: Commodities
AGR Agriculture BFM Basic metal manufacturing
PEA Peat HTP High-technology products
COA Coal TRE Transportation equipment
CRO* Crude oil ELC Electricity
OMN* Other mining products NGS Natural gas supply
FBT Food, beverage and tobacco WAT Water and sewerage
TEX Textile CON Construction
WWP Wood and wood products TRD Trade
OIN Other industrial products LTS Land transportation
GAL Gasoline WTS Water transportation
KRS Kerosene ATS Air transportation
FUO* Fuel oil ACC Accommodation and hotel services
LPG Liquid petroleum gas TEL Telecommunication services
DIE Diesel FSR Financial services
OPP Other petroleum products RES Real estate services
OTM Other manufacturing PUB Public services
CHE Chemicals and chemical products EDU Education sector
BPP Basic pharmaceutical products HHS Health sector
RUP Rubber and plastic products SER Other services
ONM Other non-metallic products
*: Not subject to private consumption.
Table 3: County Abbreviations
Abbreviation County Abbreviation County
C Cork LM Leitrim
CE Clare LS Laois
CN Cavan MH Meath
CW Carlow MN Monaghan
D Dublin MO Mayo
DL Donegal OY Offaly
G Galway RN Roscommon
KE Kildare SO Sligo
KK Kilkenny T Tipperary
KY Kerry W Waterford
L Limerick WH Westmeath
LD Longford WW Wicklow
LH Louth WX Wexford
23Whitaker Square, Sir John Rogerson’s Quay, Dublin 2 Telephone +353 1 863 2000 Email admin@esri.ie Web www.esri.ie Twitter @ESRIDublin ISBN 978-0-7070-0514-0
You can also read