INVESTOR UPDATE Delivering value - ASX: OEL
←
→
Page content transcription
If your browser does not render page correctly, please read the page content below

INVESTOR
UPDATE
Delivering value

ASX: OEL

Disclaimer and important notices
Forward Looking Statements

This presentation contains "forward-looking statements" that are subject to risk factors that are associated with oil and gas businesses. It is believed that the targets reflected in these
statements are reasonable but they may be affected by a variety of variables and changes in underlying assumptions which could cause actuals to differ materially, including but not
limited to: results or trends for future operations, drilling results, projections, intentions, or beliefs about future events may, and often do, vary from actual results and the differences
can be material. Some of the key factors which could cause actual results to vary from those Otto expects include changes in natural gas and oil prices, the timing of planned capital
expenditures, availability of resources, uncertainties in estimating proved reserves and resource potential and forecasting drilling and production results, operational factors affecting
the commencement or maintenance of producing wells, the condition of the capital markets generally, as well as the Company’s ability to access them, and uncertainties regarding
environmental regulations or litigation and other legal or regulatory developments affecting Otto’s business. Statements regarding future production are subject to all of the risks and
uncertainties normally incident to the exploration for and development and production of oil and gas.

Disclaimer

This presentation includes certain estimates of proved, probable and possible reserves that have been prepared by the Company and are by their nature more speculative than
estimates of proved reserves and accordingly are subject to substantially greater risk of being actually realized by the Company.

We cannot assure you that all of our prospects will ultimately be prospective in all or any of the targeted zones, or that such acreage will ultimately be drilled or included in drilling
units. Type curve metrics described herein refer to the Company’s internal estimates of average per well hydrocarbon quantities and production profiles that may be potentially
recovered from a hypothetical future well developed generally from the most analogous information available based on the average offset well performance of third-party operator
wells. These quantities do not necessarily constitute or represent reserves. There is no assurance that the Company will achieve comparable results on its acreage and individual
well results will vary.

Further, Otto expresses no view as to whether its joint venture participants will agree with and support Otto’s assessment of these opportunities presented within this presentation.

Terms used

All references to dollars, cents or $ in this presentation are to US currency, unless otherwise stated. See Appendix for Peer Group used.

                                                                                                                                                                                             2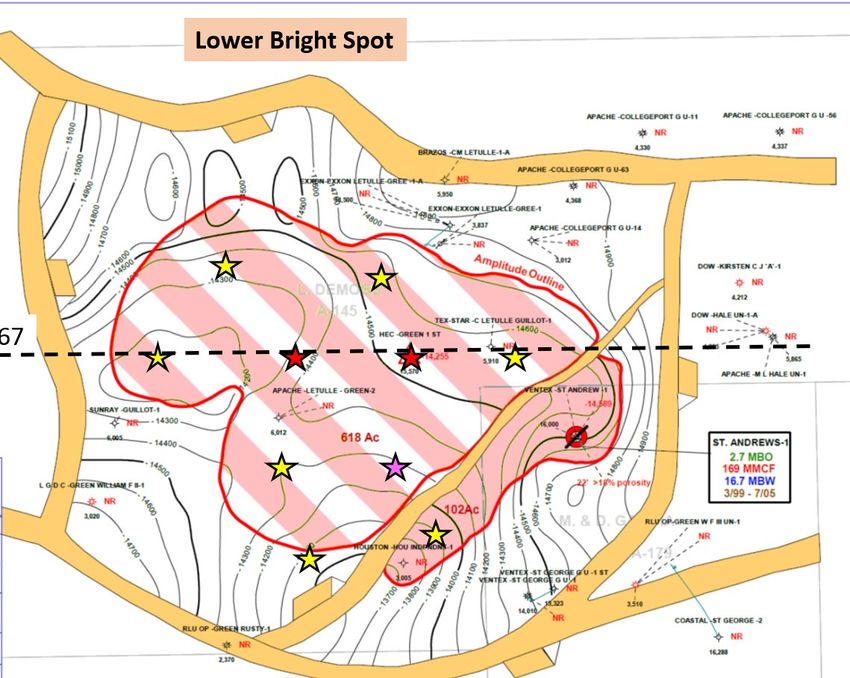
Our Experienced and proven management
Gulf of Mexico onshore/offshore conventional oil and gas player
focus Disciplined strategic and fiscal strategy:
– An excellent base business (3 quality fields)
– Invest to optimize existing fields – progress resources to
production investment to accelerate value creation
– Invest in inorganic growth opportunities to create future
value through growth and deliver returns
Cost base of the company and underlying balance sheet strength
Forward view – Otto and the industry – Why Otto? – Why Now?
Otto: Delivering value for the shareholder
3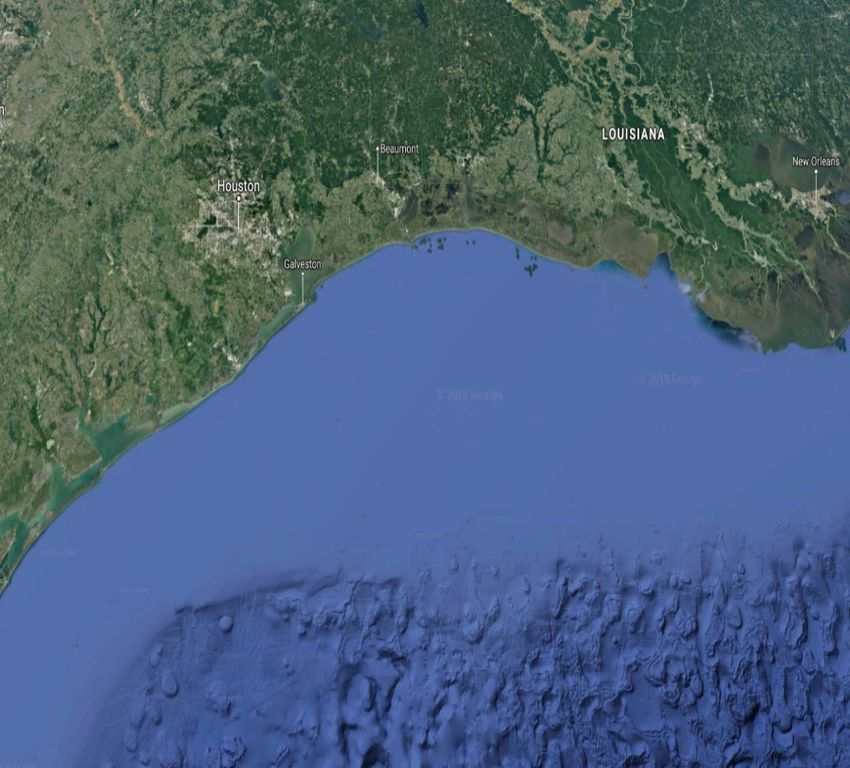
About Otto
Gulf of Mexico Basin
Operating Partner
Hilcorp Energy
A proven, large-scale hydrocarbon basin Byron Energy
Talos Energy
Most prolific hydrocarbon basin in US, with rich liquid content
Cumulative basin production of 22,463 MMBbl and 191,774 Bcf
Average shelf discovery is 6.3 MMBbl and 54 Bcf
Average deepwater discovery is 20 MMBbl and 52 Bcf
Miocene Trend
A superior place to operate
Low royalty rates, 12.5% royalty on new leases (18.75% on
existing) Lightning
Pliocene Trend SM71
37.5% WI
Some existing leases with royalty reduction and/or suspension (Producing)
50% WI
(Producing)
Stable political environment, low Federal and State regulations
GC21
A premium product type 16.67% WI
(Production started
Typical GoM shelf production is Light Sweet Crude October 2020)
Typical US$2-5/Bbl premium to WTI in US domestic market
4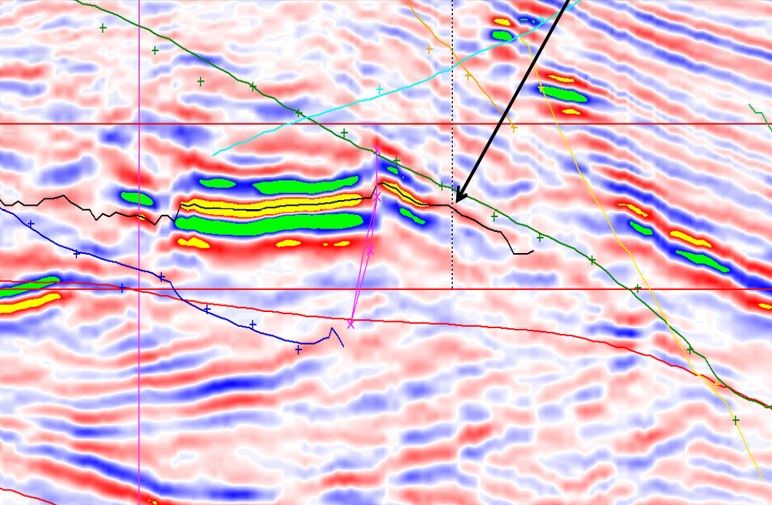
Corporate snapshot (ASX: OEL)
CAPITAL STRUCTURE                      FUNDING POSITION                                      SHARE REGISTER COMPOSITION
Shares on issue             4,795 M    Cash (31 Mar 2021)                    US$7.8 M        Corporate/strategic                   49%

Share price (27 Apr 2021)   A$ 0.011   Debt - drawn (31 Mar 2021)           US$13.8 M        Retail                                47%

Options and share rights       66 M         - undrawn (31 Mar 2021)         US$10.0 M        Institutional/broker                   4%

Market capitalisation        A$53 M

SHARE PRICE CHART                                                   BOARD OF DIRECTORS
                                                                    Executive Chairman and Chief Executive Officer   Mike Utsler

                                                                    Non-Executive Director                           John Jetter

                                                                    Non-Executive Director                           Geoff Page

                                                                    Non-Executive Director                           Paul Senycia

                                                                                                                                         5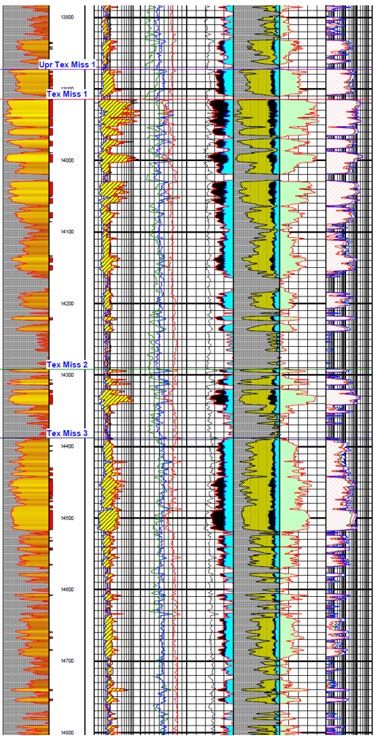
Management team
Mike Utsler, Executive Chairman and CEO Sergio Castro, Chief Financial Officer Will Armstrong, Vice President, New Ventures Philip Trajanovich, Senior Commercial Manager
Appointed Chief Executive Officer and Appointed Chief Financial Officer in December Appointed Vice President, New Ventures August Philip was engaged by Otto as Senior Commercial
Managing Director of the Company on 11 2019. 2018 Manager in July 2016 and has worked in both the
September 2020, and Executive Chairman on Perth and Houston offices since that time.
Prior to joining Otto, Mr. Castro was Vice Prior to joining Otto Will worked with Tri-C
19 November 2020. Resources, a privately owned Houston based oil Prior to joining Otto, Philip was Commercial
President and Treasurer of Contango Oil & Gas
Mr Utsler is an oil and gas executive with more Company for over 13 years. and gas company, developing Gulf Coast Manager at Aurora Oil and Gas and its
than 40 years of experience in senior conventional prospects for drilling. Prior to joining subsequent acquirer Baytex Energy for over four
From April 2004 to April 2006, Mr. Castro was a Tri-C Resources, Will screened Gulf Coast, years, focused on the Eagle Ford shale
international oil and gas sector roles, including
consultant for UHY Advisors TX, LP. From Offshore GOM, and Deepwater GOM prospects for unconventional play. Philip has also worked with
15 years in the Gulf of Mexico.
January 2001 to April 2004, Mr. Castro was a lead Continental Land & Fur between 2007 and 2014. ConocoPhillips as an Asset Manager for nearly
Chief Operating Officer with New Fortress credit analyst for Dynegy Inc. From August 1997 Between 1999 and 2007, Will worked as a three years and Woodside Energy for over seven
Energy for 18 months , 5 years as Chief to January 2001, Mr. Castro worked as an auditor geophysical consultant, generating Offshore and years. Philip has gained extensive experience in
Operating Officer of Woodside (9th largest LNG for Arthur Andersen LLP, where he specialized in Gulf Coast prospects on behalf of Houston Energy, all facets of upstream oil and gas operations and
producer globally) in Australia. energy companies. Honorably discharged from Westport Resources, and Petroquest Energy. Prior commercial structures internationally and within
the U.S. Navy in 1993 as an E-6, where he served to consulting, Will had generated prospects for the USA.
President of BP’s Gulf Coast Restoration onboard a nuclear-powered submarine.
Organization and unified commander of several Houston-based independent oil & gas
Philip graduated with a B.Com with First Class
Deepwater Horizon cleanup for 3.5 years. Mr. Castro received a BBA in Accounting in 1997 companies, including being a founding member of
Honors from the University of Western Australia in
from the University of Houston graduating summa Newfield Exploration. Will began his career at
Prior to this he held senior management 2001.
cum laude. Mr. Castro is a CPA and a Certified Tenneco Oil Company in 1987 in Lafayette.
executive roles with Amoco and BP globally. His
Fraud Examiner. Will graduated with a B.S. in Geology, minor in
career has encompassed senior executive,
leadership and board roles globally. Mathematics, from Grand Valley State College in
1985. He also graduated from Wright State
Holds a B.S. in Petroleum Engineering from the University with a M.S. in Geology, emphasis in
University of Oklahoma. Geophysics and Hydrogeology, in 1987.
6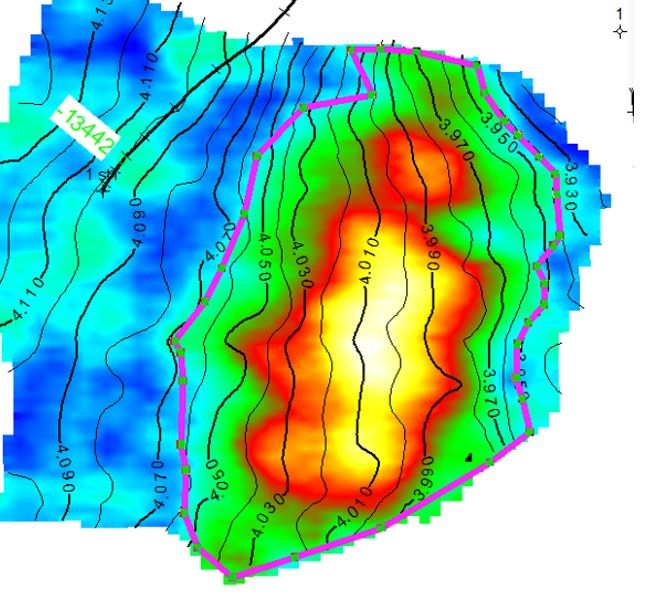
Additional members of
the management team
Kevin Small, Chief Geophysicist Mike Smith, Chief Geologist Ed Buckle, Reservoir Engineer
Appointed Chief Geophysicist during October 2019. Appointed Chief Geologist during September 2018. Joined Otto September 2018.
Prior to joining Otto Kevin worked with Tri-C Resources, a Prior to joining Otto Mike employed as a Petroleum Geologist Prior to joining Otto, Ed was employed by a number of oil and
privately owned Houston based oil and gas company, for Marlin Energy. Prior to Marlin Energy, Mr. Smith worked gas companies ranging from small private companies to
developing Gulf Coast conventional prospects for drilling. for Ocean Energy from 1996 to 2003 as a Petroleum major international oil and gas producers.
Between 2003 and 2012, Kevin worked for Bluestreak Geologist. He worked both deep water and the shelf of the 35+ years experience in the upstream oil and gas business,
Exploration Group developing prospects exclusively for LLOG Gulf of Mexico along with the gulf coast of Louisiana. with primary expertise in reservoir and production analysis.
Exploration which resulted in successful discoveries on the Prior to Ocean Energy, Mr. Smith worked for Placid Oil Co Ed has worked fields and trends across the continental U.S.,
Gulf of Mexico Shelf and Deepwater. Kevin was the and CNG Producing as a Petroleum Geologist in the Gulf of with a focus on the Gulf of Mexico and Texas/Louisiana gulf
Exploration Manager and a founding member of the Houston Mexico (deep water and shelf) and Gulf Coast. coast.
office of Westport Oil and Gas Company between 1996 and
2003, ultimately helping them go public in October 2000. Mr. Smith received a B.S. in Geology from the University of Mr. Buckle graduated Magna Cum Laude from Texas A&M
Kevin also has worked for the Superior Oil Company and New Orleans in 1982. He is a certified Petroleum Geologist University with a B.S. in Chemical Engineering (1985). He is
McMoran Oil and Gas, starting his career in 1978. During his with the AAPG (#8813) and a certified Professional Geologist a member of the SPE.
time with LLOG, Westport, and McMoran, he has drilled wells with the AIPG (#5573).
with cumulative production of over 692 BCFG and 82 MMBO.
B.S Geophysical Engineering from the Colorado School of
Mines.
7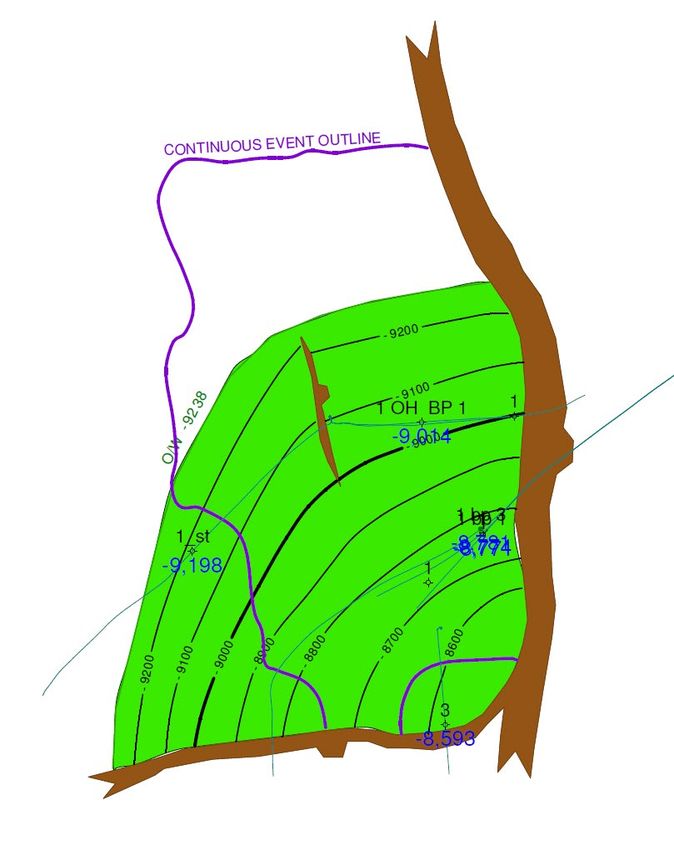
Otto’s mission, vision and values
 Maximising a robust base business while creating future value

   MISSION                                                                                                             Total shareholder return
                                                                                                                       (TSR) versus Australian
   Deliver superior shareholder value                                                                                  and US peers

   VISION                                                                                                              Delivery on KPIs:
                                                                                                                       + Reserve/Output Growth
                                                                                                                       + Scale
   Achieve outstanding business delivery as a partner of choice in the Gulf of Mexico

               Integrity                   Discipline                  Excellence               Teamwork                       Partner of choice
VALUES

         We say what we will do       We set ourselves            We plan, do, measure,    We challenge with respect      We will be recognised and
         and do what we say and our   challenging goals, we       learn and consistently   but deliver as one team        valued for our competency
         actions re-enforce that      define our boundaries and   strive to continuously                                  and expertise in how and
         culture                      earn our space through      improve                                                 what we deliver
                                      consistent delivery

                                                                                                                                                      8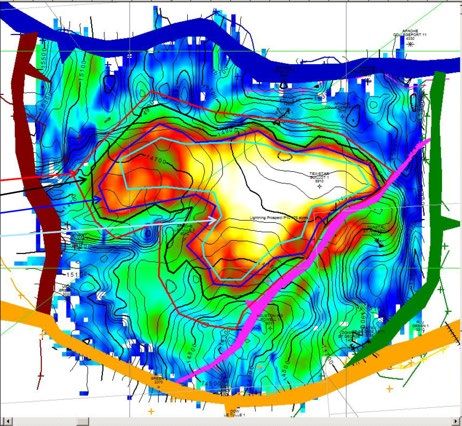
Otto’s                                  Environmental

Environmental,
                                                                                     Multi-year BDO audited
                                        reportable releases                          financials
                                        tracked Weekly
                                        Monthly and                                           Board committees

Social and                              Annually                                              including Audit &
                                                                                              Risk and
                                                                     Active                   Remuneration and

Corporate
                                                                  whistleblower               Nomination
                    TRIR and DAFWC tracked
                                                                     policy
                    Weekly Monthly and Annually                                               Annual third-party engineered

Governance
                 COVID-19 stats tracked in                                                    reserve reports by Ryder Scott
                 office building locations and                                                   KPI based performance
                 amongst staff                                                                   evaluation practices

(ESG)            COVID-19 procedures
                 resulted in minimal
                                                                                                            Delegation of Authority
                                                                                                            (DOA) approved by the
                                                                                                            Board
                 impacts and
                 interruptions                                                            Procedures              Majority
                                                                                          for Selection           Independent
                                                                                          and Appointment         Directors
                                      SEMS evaluation in
                                                                                          of Directors
                                       partner selection
                                                                                  Multi Year Special Situations
                                    Risk Management Policy
                                                                                  Planning and Risk Register

                                                                    Continuous Disclosure and
                                      Securities Trading Policy
                                                                    Shareholder Communication Policy

                                                      Anti Bribery and Corruption Policy

                                                                  Diversity Policy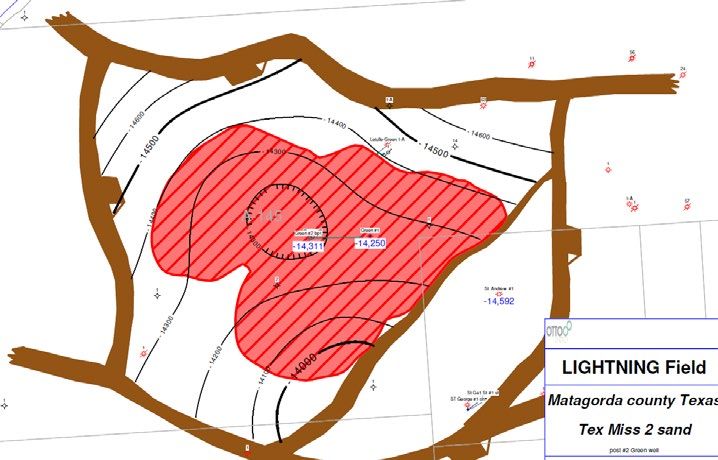
01
An excellent
base business
                10
An excellent base business
SOUTH MARSH ISLAND BLOCK 71 MATAGORDA COUNTY “LIGHTNING” GREEN CANYON 21 “BULLEIT”
Top 10 largest shelf discovery in Largest onshore Texas discovery Deepwater pliocene reservoirs on
last ten years on GoM shelf in the last 10 years salt supported structure
Geologically complex salt dome, Stratigraphically complex depositional Located in 771 feet of water
steeply dipping (>50 degree bed dip), system that is not laterally continuous
with updip unconformity GC 21 discovery announced in June
Risk mitigated using proprietary PSTM 2019, first production in October 2020
Risk mitigated using technologically seismic and patented e-seis technology
advanced RTM seismic data and Four previously drilled wells between
gather analysis Discovered 330’ of pay in three “Tex 1984 and 1996
Miss” age sands previously unseen with
Discovered 120 acre reservoir prior technology Infrastructure creates opportunity to
previously unidentified with prior develop previously uneconomic
technology reserves
Located in 131 feet of water Targeted reservoirs have been
penetrated, but never produced by
F-1 discovery well drilled in 2016 prior wells
Cumulative production has been 3.2 Risk mitigated using vintage public
MMBbl & 3.6 Bcf domain seismic and two high
resolution PSTM datasets
Three producing wells drilled to date
11South Marsh Island Block 71
Flagship GoM Shelf asset that has created strong base for current and future growth
Salt dome structure located in liquid-rich corridor of Gulf of Mexico shelf
Located in 131 feet of water
F-1 discovery well drilled in 2016
Cumulative production has been 3.2 MMBbl & 3.6 Bcf
Three producing wells drilled to date
Technology driven prospect identified in 2015 using RTM seismic
Otto/Byron Joint Venture Partnership spuds: F-1 in 2016, F-2 in 2017, F-3 in 2018
Offshore lease map showing SM71 salt dome and structural contours Platform set in 2018
‒ Current production ~ 2,600 bopd & 2,200 Mcfpd
‒ Estimated 1P/2P/3P Reserves =3.5/5.4/9.3 MMBoe (8/8ths, 87% oil)
Top 10 largest shelf discovery in last ten years on GoM shelf
Geologically complex salt dome, steeply dipping (>50 degree bed dip), with updip unconformity
Risk mitigated using technologically advanced RTM seismic data and gather analysis
Discovered 120 acre reservoir previously unidentified with prior technology
Structural contour map of D-5 Sand
12Matagorda County “Lightning”
Onshore gas asset offering both product and geographic diversification
Deep seated structure trapping “Tex Miss” channel-levee complex sands
Located south-central Matagorda County, Texas
Green No. 1 discovery well drilled in 2019
Cumulative production has been 11.5 Bcf & 346 MBbl
Technology driven prospect identified using proprietary PSTM seismic data
Structural contour map of Tex Miss-2 Sand Amplitude map of Tex Miss 2 Sand Otto/Hilcorp Joint Venture Partnership spuds:
‒ Green No. 1 discovery and Green No. 2 development wells drilled in 2019
Facilities and flowline installed in 2019
‒ Current production ~ 20 MMcfpd & 600 bopd
‒ Estimated 1P/2P/3P Reserves = 8.9/14.2/20.5 MMBoe (8/8ths, 85% gas)
Largest onshore Texas discovery in last 10 years
Stratigraphically complex depositional system that is not laterally continuous
Risk mitigated using proprietary PSTM seismic and patented e-seis technology
Discovered 330’ of pay in three “Tex Miss” age sands previously unseen with prior technology
Seismic line through Green No. 1 Discovery Well
13Green Canyon 21 “Bulleit”
Deepwater GoM development that leveraged infrastructure for early 1st production
DTR-10 Deepwater pliocene reservoirs on salt supported structure
MP
SAND
SAND Located in 771 feet of water
GC 21 discovery announced in June 2019, first production in October 2020
Four previously drilled wells between 1984 and 1996
Technology driven by integrating multiple recent PSTM seismic datasets
Otto/Talos/Enven Development (Ps=70%) Joint Venture Partnership spuds:
‒ No. 1 well spuds on 4/30/19
‒ No. 1 well reaches final TD on 8/1/19
Structural contour map of DTR-10 Sand Structural contour map of MP Sand
Subsea tieback to Talos GC18 platform and facilities completed September 2020
‒ Currently producing from MP Sands on a managed basis. Pressure and
performance data indicate a smaller reservoir than originally anticipated
‒ The currently favoured path is to move away from the MP Sand and recomplete in
the shallower DTR-10 Sand (est. mid CY 2022)
‒ Estimated 1P/2P/3P Reserves = 4.4/8.1/9.3 MMBoe (8/8th’s, 90% oil)
Infrastructure created opportunity to develop previously uneconomic reserves
Targeted reservoirs have been penetrated, but never produced by prior wells
Risk mitigated using vintage public domain seismic and two high resolution PSTM
DTR-10 Sand Amplitude map MP Sand Amplitude map datasets
14Asset performance to date
A track record of strong returns from development
SM 71 LIGHTNING GC-21
DOFP CY2018 CY2019 CY2020
COMMODITY WEIGHT 86% Oil 85% Gas/Cond. 90% Oil
NET CAPEX REQUIRED US$27.6M US$19.4M US$44.9M
NET IP (BOEPD/MMCFD) 1800 BOEPD 8 MMCFED 600 BOEPD
NET 2P RESERVES 3.3 MMBOE 26.1 BCFE 1.1 MMBOE
ALL IN F&D US$11.30/BOE US$1.04/MCFE US$40.80/BOE
GROUP
SUCCESS CASE FULL CYCLE
IRR % 86 34
ROI (disc) 2.0 1.5
Historical costs/prices to December 2020 US$62.6M US$33.3M
PV (15)
and US$50/Bbl oil and US$2.50/mcf gas
prices forward. Payout 4.3 yrs 5.3 yrs
Reserves and economic data on 2P basis. 31.7/8.8 31.7/8.8
Gross/Net MMBOE
1502
Maximising the
existing base
16Optimising captured resources
Creating value through leveraging organic options
1P Reserves: 4,051 MBoe 2P Reserves: 6,359 MBoe 3P Reserves: 8,874 MBoe
Six wells (five are PDP Adds one additional well Adds one additional well
and one, Green #3, is a (Green #4) plus 2,308 Boe (Green #5) plus 2,515 Boe
PUD) of probable reserves of Possible Reserves
Six recompletions Six recompletions above Additional wells possible
anticipated also adds to Probable with continued
Reserves development at Lightning
9-year estimated life of
Reserves 13-year estimated life of 14-year estimated life of
Reserves Reserves
17SM 71 upside: D Sand
Potential to add 2.8 MMBbl (2P) through production without any additional capital
Current production from F-Platform
F-1: 800 bopd
F-2: 20 bopd
F-3: 1800 bopd
A F-4 well (Non-Otto participation)
A’ F-5 – Temporarily abandoned
Volumetrics
Proved: 3.1 MMBbl
Structural contour map of D-5 Sand Probable: 1.7 MMBbl
Possible: 3.2 MMBbl
Future work
No future capex currently required for recovery of 2P reserves
Probable and Possible reserves are incremental and will be realized
through production
Potential for F-2 uphole recompletion and F-5 sidetrack (no reserves
currently booked – Performance driven)
D-5 Sand Structural Cross-Section
18Lightning upside: development of Tex Miss 2/3
Potential to add +/- 66 Bcf via drilling and development
GREEN No. 1 Structure Map of Tex Miss 2/3
Current production From Green #1 & #2
TEX MISS
20 MMcfpd + 600 Bcpd
1 SAND
Production logs indicate only 1 MMcfpd from Tex Miss 2/3
Volumetrics
Tex Miss 1: 300-acre amp, 100’ pay
Tex Miss 2/3: 600-acre amp, 100’ pay
Tex Miss 2/3 is essentially UNDEVELOPED at this time
TEX MISS
2 SAND
Structural contour map of Tex Miss-2 Sand
Future work
TEX MISS
3 SAND
Lower Permeability in Tex Miss 2/3 will require hydraulic
stimulation or some other enhancement to achieve a commercial
production rate
Five or more locations may ultimately be required to fully develop
the Tex Miss 2/3
Petrophysical log of Tex Miss Reservoir Section
from Green No. 1 Well
19GC 21 “Bulleit” upside
Potential to increase production via recompletion
DTR-10 MP Future work
SAND SAND Rig recompletion to recomplete to DRT-10 Sand.
Anticipated in mid CY 2022
Structural contour map of DTR-10 Structural contour map of MP Sand
Sand
20
Gamma Ray/Resistivity log of DTR-10 Sand Gamma Ray/Resistivity log of MP SandBase plus infill upside potential outcomes
Production and capital expenditure profiles
Otto production outlook: Base plus organic options Otto capital expenditure outlook: Base plus organic options
(Mboe) (US$’000)
30,000
1,600
1,400 25,000
1,200
20,000
1,000
800 15,000
600
10,000
400
5,000
200
- -
FY20 FY21E FY22E FY23E
FY20 FY21E FY22E FY23E
Base (SM71, Lightning, GC21) - oil /liquids
Base (SM71, Lightning, GC21) - gas Base (SM71, Lightning, GC21)
Note: Assumes GC 21 is recompleted in the DTR-10 Sand in mid CY 2022 and production from the DTR-10 Sand begins in mid CY 2022 2103
Creating
future value
22Future value Prospect portfolio generation/access
creation Asset evaluation
Acquisition of underdeveloped and under-valued
Driven by a highly
disciplined approach to Divestment of existing/swap
capital management
Company evaluation
Sale of Otto
Merge with aligned company
Acquire
Dividend return to shareholders
Recurring
Special
Share Buybacks
23Otto’s shareholding in Pantheon Resources Plc
Material value holding in Alaska pure play E&P
Otto holds 14,272,592 shares in Pantheon Resources Plc (LSE:
PANR) currently valued at approx. A$ 8.9 MM / US$ 6.9 MM as at 3 Pantheon acreage map
May 2021. 1,2
In addition to our Pantheon shareholding Otto Energy also holds a
0.5% of 8/8ths ORRI in any future oil and gas production from the
Talitha Unit.
Pantheon Resources Plc holds a large acreage position of
approximately 160,000 acres on the Alaskan North Slope with 9+ year
lease terms.
This high potential acreage is adjacent to TAPS infrastructure. Close
proximity to TAPS means connecting into third party host facilities is
not required as well as shorter pipeline tie-in distance (lower capex).
Recently drilled Talitha #A well successfully logged 3700 feet of oil pay
across 4 play intervals (Shelf Margin Deltaic, Slope Fans, Basin Floor
Fan and Kuparuk) compared to pre-drill expectation of 2000 feet.
Pantheon plans to test Shelf Margin Deltaic, Slope Fans and Basin
Floor Fan intervals next season using existing Talitha #A well bore.
Source: Pantheon Resources Investor Presentation April 2021
Post drilling of the Talitha #A well, the Basin Floor Fan play within
Talitha West Area is Pantheon’s largest project. Pantheon has
committed to have resource estimate finalised during May 2021.
1 These shares are subject to lockup until 30 June 2021.
2Valuation is based on a 3 May 2021 closing PANR share price of 34.90 Pence, AUD:GBP exchange rate of 1.793
and a USD:GBP exchange rate of 1.391. 24Otto opportunity screening history (2018-21)
A conservative evaluation track record
280 individual prospects reviewed
2700-Block area of GoM shelf with highest liquid
content
Seismic amplitude-supported, Stacked-Tertiary-
280 individual prospects age reservoirs
reviewed Low-cost operating environment (WD < 250’)
Producing property evaluations
Evaluate properties with PDP value
Pursuing undervalued 2P upside
Producing asset
evaluations Pursuing exploration or low-risk, step-out drilling
Diversified opportunities
Opportunity
Internally generated opportunities
Hopper
Currently underway; targeted search for
previously undrilled amplitude supported
Internally generated prospects
opportunities Integrate well log and field production data
Company sale / merger opportunities
Volatile market has led to significant numbers of
smaller oil and gas companies to be in distress
Company sale / merger Evaluating sale, mergers or acquisitions
opportunities
25Otto performance objectives
Maximise our base business while creating future value
INORGANIC GROWTH
BASE AND ORGANIC GROWTH OPTIONS
OPPORTUNITIES
PERFORMANCE OBJECTIVES
Facilitated by underlying base business
Base business + organic options (3-year group targets)
Key targeting criteria
Base business outcome Base outcome incl. exercise of organic options
Year on year metrics
(3 years forward) (3 years forward)
ROACE > 20% ROACE > 17.5% ROACE > 15%
IRR > 75% (Success case) IRR > 75% (Success Case) ROE > 15%
IRR > 25% (Full cycle) IRR > 25% (Full Cycle) DROI (15) > 25%
FCF > US$40M FCF > US$40M NAV growth > 10% CAGR
Gearing –GoM shelf/onshore: salt dome driven basin
Geological characteristics drive substantial opportunity set
Geological attributes
OTTO’S SM 71 DISCOVERY
Geologically complex salt dome structures
Miocene and Pliocene-aged reservoirs with varied sand depositional histories
Extensive sand/shale cycles create stacked reservoirs
Technical attributes
Public domain seismic data, and privately marketed high quality seismic data
available throughout shelf region
PSTM and PSDM seismic data can be used to identify seismic amplitude-supported
targets
Ideal rock properties for using seismic gather data to further mitigate prospect risk
Lowest of operating costs for new developments
250’ water depth and lower allow for cheaper drilling, completions, and facility costs
Nearby available infrastructure and pipeline options lowers minimum reserve
requirements, and maintains competition for product marketing
Key example is Otto’s SM71 F-Platform, discovered in 2016, commenced
production in 2018, F&D of US$8.2/BOE, opex of US$6.00/BOE
27Otto’s disciplined opportunities assessment process
A detailed, technically driven filter
Central GOM Shelf selected as opportunity area
2,700-Block area of GOM shelf with highest liquid content
Central GOM shelf
Stacked Miocene/Pliocene-aged reservoir package – seismic amplitude-supported and multiple
vintages of seismic data available
Low cost operating environment (WD < 250’)
69 salt domes identified to have:
Strong and diverse production histories with favourable geologic growth histories
69 salt domes identified
Salt dome anomalies (i.e. salt overhangs or poorly imaged portions of salt dome)
Purchase seismic data
Utilized over 3,000 blocks of vintage, public domain seismic data to identify leads
Purchased 100 blocks of Fairfield PSTM/PSDM seismic data to refine leads to prospects
Purchase seismic data Purchased 50 blocks of Fairfield Hidden Treasure RTM data to sharpen prospect imaging
17 salt domes Identified for detailed evaluation
Currently underway; pursuing opportunities on both leased and open acreage
17 salt domes Leased acreage includes financially stressed operators, operators willing to consider joint
ventures, as well as companies that are not applying newest technologies
2804 Cost base and balance sheet strength 29
Strong outcomes in a challenged macro environment
Delivering financial performance against a volatile energy market
  Operating Performance
                                                223% (FY19) and 4% (FY20) increase in crude oil production
                                                790% (FY19) and 102% (FY20) increase in natural gas production
                                                26% decrease in FY20 average prices led to sales revenue decline

  Financial Performance (US$‘000)

                                                93% increase in NPAT for FY20
                                                154% increase in EBITDA2 for FY20
                                                105% increase in EBIT2 for FY20

  Balance Sheet3
                                                94% increase in Return on Equity for FY20
                                                103% increase in ROACE for FY20
                                                95% increase in Earnings Per Share for FY20
                                                Debt forecast to be paid off by September 2022
                                           1.   Refer to Otto Energy ASX Announcement released 25 September 2020 and 11 March 2021
                                           2.   Excludes the effects of the $12.9 million impairment related to GC 21. Refer to Otto Energy ASX Announcement released 11 March 2021
                                           3.   Includes the effects of the $12.9 million impairment related to GC 21. Refer to Otto Energy ASX Announcement released 11 March 2021   30
Commodity Price Risk Management (CPRM)
Proactive oil price hedging policy
Balanced hedge strategy provides meaningful downside protection while allowing some upside participation with higher oil prices.
Average 2021 (Apr - Dec) hedge price of US$51.08/bbl on 714 BOPD using LLS Swaps.
Average 2022 (Jan - Sep) hedge price of US$49.92/bbl on 349 MBOPD using LLS Swaps.
Disciplined hedge strategy with rebalancing in line with revised productions forecasts, various structures considered (Swaps, Collars, Put Options), results in hedge value
that protects balance sheet and capital program.
Hedge using LLS price marker to minimise basis risk.
Since 2019 Otto has executed 880,548 bbl of hedges (LLS Swaps and LLS Put Options) with multiple counterparties (investment grade credit rating minimum) to manage
both counterparty risk and commodity price exposure.
Otto has hedged 80% of PDP forecast production in 2021 and 75% in 2022 (Jan through Sept)
Current hedge profile (US$)
900 $70.00
800 $60.00
700
$50.00
600
$40.00
BOPD
500
400 $30.00
300
$20.00
200
100 $10.00
0 $0.00
Q2 21 Q3 21 Q4 21 Q1 22 Q2 22 Q3 22
BOPD Hedged Price Strip Price
Current 2020 and 2021 hedges enable realisation of ~ US$16.4 MM of Oil Sales Revenue
31Substantial cost reductions delivered
On track to reduce FY21 office operating costs by 40% - with further cost efficiencies targeted
Indirect operating expenses
Historical fully costed Targeted 3-year fwd. Actual costs
Targeting further reductions in payroll and service provider costs
US$31.00/Bbl average costs H1 FY21
US$16.50 - $20.50/Bbl US$17.08 Targeting reductions through “rightsizing” infrastructure footprint (office size,
rent, utilities)
Optimizing public entity cost structures
Cost of indirect Direct operating expenses
operating expenses Facility sharing costs expected to decrease overall Otto costs
(G&A)
Working with all operators to support cost efficiency improvement efforts
Targeting reduced Leveraging Post-Covid-19 changes in operating structures/supply chain
costs for FY 2021 volatility
38% reduction in
Cost of direct operating
NFLC per Bbl vs PY Finding and development
expenses (LOE)
Working closely Working with operators to drive securing reduction in risked exposure to rig
with operators to rates and equipment installation costs (turnkey and/or contracting)
identify efficiencies 68% reduction in
FLC per Bbl vs PY Leveraging learning curves within existing assets on future drilling/re-entry
costs
Cost of finding &
development Costs to convert Capital disciplined decisioning on forward investment options to accelerate
PUDs & probable 53% reduction in PUD, probable and possible captured resource developments.
into proved F&D per Bbl vs PY
32Debt-driven leverage profile
High confidence in abilities to service/reduce
Production Available debt facilities (at 31 March 2021)
1,101
Mboe 946 US$25 M – Tranche A1
742
US$10 M – Tranche A21
US$20 M – Facility B (terms to be determined)
194
Debt balance (at 31 March 2021)
Tranche A1 fully drawn US$ 25.0 M
FY18 FY19 FY20 FY21E Amount repaid US$(11.2) M
SM 71 Lightning GC 21 Remaining debt balance US$ 13.8 M
Cash from operations Cash uses Remaining US$13.8 M of debt due progressively over the next 24 months
GC 21
Debt can be fully serviced through existing cash flows
Lightning Free cash Early payment of debt is possible to allow access to lower cost of capital
flow
Liquidity (at 31 March 2021)
Development Tranche A-2 available1 US$10.0 M
SM 71
Cash2 US$ 7.8 M
G&A Available liquidity US$17.8 M
Opex
1 Subject to certain restrictions. Requires a structuring fee of US$0.6 million and the issuance of 42,500,000 stock options at (A$0.08) 33
2 Includes US$5.4 million in Debt Service Reserve AccountOtto Energy: delivering value
1 The GoM 4 External assessment
A mature, opportunity-rich environment Creating growth access through rigorous
inorganic opportunities evaluation
2 Our base
A diverse, liquids-rich, high-margin
5 Shareholder returns
portfolio Against a highly disciplined approach to
capital management
3 Internal levers
Leveraging a strong balance sheet to
deliver organic growth
34The relative value opportunity (AUS)
Substantial potential upside implied
Current EV
Indicative EV
Range - AUS Peers
1P Reserves (mmboe)
2P Reserves (mmboe)
Q2 FY21 Daily
Production (boe/d)
FY20 Revenue (AUD)
FY20 EBITDA (AUD)
0 50 100 150 200 250 300 350 400
Indicative Enterprise Value (A$m)
Source: See “Peer Group (AUS)” appendix slide for more details 35The relative value opportunity (US)
Substantial potential upside implied
Current EV Indicative EV
Range - US Peers
1P Reserves (mmboe)
Q2 FY21 Daily
Production (boe/d)
FY20 Revenue (AUD)
FY20 EBITDA (AUD)
0 50 100 150 200 250 300 350 400
Indicative Enterprise Value (A$m)
Source: See “Peer Group (US)” appendix slide for more details 36Appendix
Regulatory Agencies GoM and Texas
Status and updates
GoM Agency Regulatory status Otto impact Regulatory
Texas Party Otto status
status
Paused new lease
Existing Federal Leases are Individual
Leasing BOEM sales in Federal Existing State Leases are
Held By Production Leasing Mineral No Change
Jurisdiction Held By Production
Owners
BOEM re-delegated
Exploration Do not expect any required
BOEM authority to
Plans (EPs) for 2021
approve all plans
Application
Plans and Permits
for permit to
Plans and Permits
Exploration Sent to DOI for
Do not expect any required drill, No change to Approval of any required
Well BSEE review and final
for 2021 recomplete, TRRC drilling permit 2021 permits is expected
Permits approvals
or re-enter approval process
Development BOEM re-delegated (W-1)
Do not expect any required
Plans BOEM authority to
for 2021
(DOCD) approve all plans
No change. BSEE
Development continues to review Approval of any required
BSEE
Well Permits and approve 2021 permits is expected
permits.
Possible future capital expenditure activity: Possible future capital expenditure activity :
GC 21 recompletion in DTR-10 targeted for mid 2022 (April – July) Green #3 development well
F2 recompletion in J1 sand possible when B55 sand stops producing
F5 sidetrack
38Peer Group (AUS)
Peer Company Source Data
• 1P and 2P Reserves as per “Annual Report to shareholders”, released 24 September 2020
Central Petroleum Limited
• Q2 FY21 daily production as per “Quarterly Activities Report & Appendix 5B”, released 29 January 2021
• 1P and 2P Reserves as per “Annual Report to shareholders”, released 27 August 2020
Horizon Oil Limited
• Q2 FY21 daily production as per “Quarterly Activities Report”, released 28 January 2021
• 1P and 2P Reserves as per “Annual Report to shareholders”, released 24 August 2020; and “Senex to expand
Senex Energy Limited Atlas production with new acreage award”, released 21 September 2020
• Q2 FY21 daily production as per “December 2020 Quarterly Report”, released 22 January 2021
• 1P and 2P Reserves as per “Annual Report to shareholders”, released 28 September 2020
Cue Energy Resources Limited
• Q2 FY21 daily production as per “Quarterly Activities Report”, released 28 January 2021
• 1P and 2P Reserves as per “30 June 2020 Reserves & Resources Report”, released 10 September 2020; and
Byron Energy Limited “Reserves and Business Update”, released 23 February 2021
• Q2 FY21 daily production as per “Quarterly Activities and Cashflow Report”, released 28 January 2021
• 1P and 2P Reserves as per “Correction undeveloped oil reserves”, released 21 October 2020
Cooper Energy Limited
• Q2 FY21 daily production as per “Q2 FY21 Quarterly Activities Report”, released 28 January 2021
• 1P and 2P Reserves as per “Annual Report to Shareholders and Appendix 4E”, released 23 February 2021
Australis Oil and Gas Limited
• Q2 FY21 daily production as per “Quarterly Activities Report”, 29 January 2021
39Peer Group (US)
Peer Company Source Data
Talos Energy Inc. • Q4 2020 Production and Proved Reserves as per Form 10-K SEC filing released 11 March 2021
Contango Oil & Gas Company • Q4 2020 Production and Proved Reserves as per “Contango Investor Presentation” released 10 March 2021
Range Resources Corporation • Q4 2020 Production and Proved Reserves as per Form 10-K SEC filing released 23 February 2021
W&T Offshore, Inc. • Q4 2020 Production and Proved Reserves as per Form 10-K SEC filing released 4 March 2021
Kosmos Energy Limited • Q4 2020 Production and Proved Reserves as per Form 10-K SEC filing released 23 February 2021
40You can also read