Distributional Effects of Trade Shocks: Evidence from China's Tea Trade in the Early Twentieth-Century
←
→
Page content transcription
If your browser does not render page correctly, please read the page content below
Distributional Effects of Trade Shocks: Evidence from China’s

                Tea Trade in the Early Twentieth-Century

                                               Cong Liu∗
                      Department of Economics,University of Arizona
                                          Very Preliminary

                                         November 9, 2014

                                               Abstract

          How do negative trade shocks affect regional welfare? This paper examines the
      impact of declining tea export on input prices and civil conflicts in early twentieth-
      century China. I conduct a difference-in-differences analysis and find that the change
      in prices of two major inputs, land and labor, led to different regional responses. When
      a negative shock on the tea trade took place, land owners in areas suitable for tea
      production were worse off. This finding is in accord with theoretical predictions for
      immobile factors. Surprisingly, farm laborers were worse off only if they were far from
      ports, probably due to the fact that being closer to ports meant more job opportunities.
      This finding suggests that farm laborers could arbitrage within areas that had similar
      distance to ports, although they cannot fully migrate between areas with different access
      to ports. This fact might have caused higher income volatility for wage earners who
      lived further from ports. I also find that places that experienced a relatively higher
      decrease in income had more conflicts. These results suggest that the decline in tea
      export was followed by heterogeneous welfare responses by different regions in China.
      It might have had a more destructive impact by stimulating more civil conflicts in areas
      that were relatively worse off.

   ∗
     Email: congliu@email.arizona.edu. I am indebted to my advisor Price Fishback for his invaluable
guidance. I benefit from suggestions and comments by Cihan Artunç, Shiyu Bo, Ashley Langer, Derek
Lemoine, Mo Xiao, Se Yan, and participants of the University of Arizona empirical lunch. I also thank Ying
Xu for her an excellent job on data collection, Quyen Nguyen for proofreading, and Shiyu Bo for help on
ArcGIS. All the errors are my own.

                                                    1
1 Introduction
Recent decades have witnessed a rapid increase in trade liberalization. This process
brings in cheaper products for consumers, but also increases competition among produc-
ers. A number of studies have focused on the economic consequences due to increased
competition, such as improvements in productivity and the exit of firms (e.g., Pavcnik,
2002), poverty (Winters et al, 2004), income volatility (Goldberg and Pavcnik, 2007), and
increased unemployment and expenditure on social security program (Autor et al., 2013).
Most economists agree that the overall effect of increased competition is beneficial for a
country. However, as some studies notice, factor immobility would prevent inputs from
adjusting and thus lead to short-term efficiency loss. (Toplova, 2010; Autor, et al., 2013).
This paper examines the responses of two inputs with different factor mobility: labor
and land. I consider a historical setting: the decline of tea export in China in the early
twentieth-century. China was the largest tea exporter before the nineteenth century, yet,
starting from the late nineteenth century, India experienced a rapid increase in tea export
and gradually took China’s leading position. The expansion of Indian tea export was
partially attributed to the expansion of world demand, mainly in Britain, but also due to
the substitution for Chinese tea. In addition, high freight rates caused by the First World
War worsened China’s situation: The black tea export value shrank by 80% from 1915 to
1918. In 1932, China’s black tea export value was only one fourth of its export value in
peak years. In the market for green tea, Japan also arose and competed with China. This
was a big trade shock to China. However, at the same time, new opportunities also emerged
in China, such as the increased number of manufacturing firms and increased exports in
other commodities at the treaty ports. Given this situation, a total welfare analysis could
not affect the welfare change due to the shock of the tea trade.
In this paper, I examine the impact of this drop on rural input prices and civil con-
flicts in early twentieth-century China. The rural income is measured by survey data on
rural land values and rural labor wages in 104 counties in China, ranging from 1901 to
1933. Presumably, since labor was mobile and land was not, land owners would have expe-
rienced a relatively larger negative income shock. I combine multiple data sets to capture
2diversified local conditions, including soil suitability and access to foreign markets. The
decline in tea production is instrumented using the total import of United Kingdom and
the eruption of the First World War. I conduct a difference-in-differences analysis and con-
trol for county-level time-invariable characteristics and national shocks. The results show
that, in accord with theoretical predictions, land owners in areas relatively suitable for tea
production experienced a greater loss. However, labor wages present a different pattern:
laborers at places far from ports had larger decrease in their wages. This pattern implies
that labor was mobile within regions at a certain distance to ports but not fully mobile
between regions far from ports and close to ports. Since labors close to ports had more job
opportunities, these workers could offset the negative shock from trade. I then use data
on small-scale conflicts from 1902 to 1911 in 1594 counties to examine the impact on the
social environment, measured by the number of local conflicts. Conflicts have a long-lasting
impact on society and they are likely to erupt when people experience negative income
shocks (Blattman and Miguel, 2010). My paper shows that, along with the decline in tea
exports, counties that experienced negative income shocks tended to have relatively more
conflicts than their counterparts. It suggests that the shock from the declining tea trade
was probably more severe than previously stated by the literature. These findings are also
in accord with previous literature and suggest that factor immobility increased the cost of
trade adjustments and harmed local economies.
This paper belongs to a group of papers that evaluates the impact of trade on pre-modern
China. Most quantitative studies with this aim consider total welfare change (Mitchener
and Yan, 2014; Keller, Shiue and Li, 2011, 2012, 2013) and omit heterogeneous responses
from different regions. This paper, instead, considers the impact of national shocks on
individual counties. I find that counties with different geographic conditions had very
different welfare response to trade shocks. Areas more suitable for tea production and areas
far from the ports were relatively worse off than other areas. This provides an explanation
for why studies on rural areas in the early twentieth-century seem to contradict each other.
The overall welfare analysis usually suggests a positive picture (Myers, 1970; Rawski, 1989;
Brandt, 1989), while the individual experience does not always prove it (Fei, 1939; Chen,
1940).
3This paper also relates to a group of literature that explores the reasons behind civil
conflicts. Similar to the previous literature, I exploit the variation in geographic conditions
and find that negative world price shocks would lead to more conflicts. This is in accord
with the previous literature that uses world prices as a measure of income shock (Bruckner
and Ciccone, 2010; Dude and Vargas, 2013). In addition, I find that income shocks on wage
earners were more likely to increase conflicts than shocks on land owners. This finding
suggests that people with a more stable source of income may be less sensitive to negative
shocks.
2 Background
China was the sole exporter of tea in the world market in the eighteenth century. Most
of the tea was imported by the European countries, including Russia, Netherland, Britain,
French, Sweden, and Denmark, but most of the consumption demand came from Britain
and Russia. Tea was also the main traded commodity between China and the European
countries in the eighteenth century. In 1716, the export value of tea from China to Britain
was 35085 pounds, which was 80% of the total import value of the East India Company from
China. In 1784, the tariff of tea in Britain was lowered to 12.5% from 100%. It stimulated
direct tea trade between Britain and China: The value of tea imported to Britain was
doubled in 1785. 1 It continually increased after China was opened to foreign trade in
1842.
It is worth noting that during that period, the foreign trade of China took place mostly
in the only opened port, Canton, located in the southern coast of China. Most part of
China was not involved in the world market. Tea was a main export commodity before
the 1840s, whose export value was 94.5 million silver coin, which was about 70% of the
total export value of China. Another major export was silk. The globalization process
of China started from 1842, when China was defeated in the Opium War and forced to
sign the Treaty of Nanking. Later, more treaties were signed to open more ports, establish
foreign-governed Maritime Customs, and set tariff rates (the 1858 Treaty of Tientsin). By
1
Pritchard, 1936, The crucial years of early Anglo-Chinese relations, 1750-1800. Cited from Zhuang,
1995.
4the 1930s, fifty ports were opened to trade, and China’s total trade value increased from
94,137 Haikwan taels in 1864 to 2.2 million Haikwan taels in 1930 (Hsiao,1974). Figure 1
depicts the adjusted import and export values from 1864 to 1933.
[Figure 1 about here.]
Thanks to the increased tea consumption in Britain, tea exported from China first
increased along with the globalization process. The average export value of tea from 1870
to 1875 is four times as the one before China’s openness in 1842.2 Meanwhile, more ports
were involved in the tea trade. Other than Canton, Shanghai, Hankow, Foochow, and other
ports in the southern part of China also exported a large amount of tea. It suggests that tea
producers in China were more closely connected to the world market and British consumers.
The expansion stopped in 1876: first, the price of Chinese tea in the world market dropped
despite its increased quantity. Later, the quantity itself also started to decline. This change
took place when most other traded commodities of China were experiencing rapid expansion.
At 1930, the main exports of China were beans, coal, cotton products, animal products,
and oil crops, while the total value of black tea exported was only one fourth of the value
at the 1870s. Figure 2 shows the export value of black tea as well as the calculated ratio of
black tea export value to total export value.
The decline of China’s tea trade was not due to decreased consumption in Britain.
Increased competition from India was the main reason. Tea trees were introduced to India
by the East Indian Company after Britain’s taking over of India, in the aim of breaking
China’s monopoly position. The suitability in soil and the adoption of large scale plantations
led to rapid development in tea production in Assam and other parts of India. By the end
of the nineteenth century, India became a major producer of black tea.
China lost its competition with India for several reasons. Heavy taxation and malprac-
tice in the foreign market contributed, but according to the Decennial Reports of China
Maritime Customs in 1911, the main reason was the farmers’ unawareness of arising compe-
titions overseas. The farmers who grew their tea “followed the rough and ready methods of
local tradition” and had “no scientific knowledge of cultivation or preparation of the leaf”.3
2
Yan, 1955.
3
China Maritime Customs: Decennial Reports 1902-1911, Vol.1, page 342.
5This is compared to deliberate choice by the Indian cultivators who chose in the density
of plants and the timing to picking leafs to protect the tea tree and its productive power.
In addition, the Indian producers put more efforts on packing and advertising, while the
Chinese paid little attention on it.
In fact, the deep reason behind this sharp comparison was the contrast between the
decentralized production that was based on individual farms in China and centralized large-
scale plantations in India. The Chinese farmers had to compete with his neighbors when
selling their tea leaves. To increase their revenue, farmers from small tea gardens would
rather increase quantity and receive lower unit price. This practice overtime lowered the
average quality of Chinese tea and finally led to a change of taste of British merchants and
consumers. While China used to provide 86 percent of the tea supply in the world market
in the 1870s, the number dropped to 25 percent at the end of the nineteenth century.4
[Figure 2 about here.]
Since black tea faced the most furious competition, the ratio of black tea export value
to total tea export value also decreased after the twentieth century, as shown in Figure 3).
The export of green tea, brick tea, and tea dust was relatively stable compared with the
export of black tea. However, when one compares the total tea export value to total export
value, it is clear that the total tea export also experienced a dramatic drop (see Figure 4).
In fact, similar as the situation on the black tea market, Chinese green tea faced increased
competition from Japan. Despite the worldwide spread of tea, the total value of tea export
from China was never back to its peak in 1870.
[Figure 3 about here.]
[Figure 4 about here.]
The decline of tea trade caused negative income shocks on tea production areas. If one
assumes that tea producers–land owners and farm laborers–received their marginal revenue
product, the decreased tea price would have decreased their income. As Gardella (1994)
4
China Maritime Customs: Decennial Reports 1902-1911, Vol.1,pages 342-344.
6quoted Somerset Maugham’s story in 1922, based on the latter’s tour of the Chinese coast:
“[T]he merchant princes of that day built magnificently. Money was made easily then and
life was luxurious....But this agreeable life was a thing of the past. The port lived on its
export of tea and the change of taste from Chinese to Ceylon had ruined it. For thirty years
the port had lain a-dying.”5 However, Gardella also distinguished the declined tea trade
with increased total exports, transportation conditions, and new roads in the same area.
He argued that around the port of Foochow, the declined tea trade was accompanied by an
increased total export of this port. The port was no longer dominated by one commodity
but “a diversified array of commodity exports”.6 As many scholars, he believed that the
declining tea trade was only a minor factor that would affect local economy compared with
other factors, such as political conditions and social instability.
3 Data
In the empirical analysis, I collect historical data to assess the impact of trade shocks on
different regions in China. I consider the eighteen inner provinces that were the core areas of
pre-modern China with dense populations and extensive commercial activities. It is worth
noting that I am not aiming at estimate the overall welfare change of the whole country.
Instead, I focus on the relative welfare change between areas with different geographic
conditions.
3.1 Outcome variables: Input price and social conflicts
The first set of outcome variables are farm land value indices and farm labor wage indices
from 1901 to 1933 for 104 counties in 18 provinces. These data come from a nationwide
survey by John Buck, who was a professor in the Department of Agricultural Economics
in Nanking University from the 1920s to the 1940s. He started a field survey project to
examine multiple aspects of Chinese society in the 1920s, asking his students to conduct
surveys near their hometowns during their vacations. By 1933, he and his students had
already completed a nationwide dataset involving 16,786 farms and 38,256 farm families in
5
Maugham, 1922, pages 109-110. Cited from Gardella, 1994, page 116.
6
Gardella, 1994, page 163.
722 provinces, which covered most of the populated area. The survey includes many variables
describing climate, population, agriculture, health, farm labor and other variables related
to farm production. The original survey was at the household level, but only the county
level statistics were published and are still available.
The land value indices and labor wage indices were collected from recalled information.7
In the published data, the value in each county was normalized relative to the value in
1926. In the regression analysis, I take logs and use county-level fixed-effects to take care
the impact of normalization in each county.8
Table 1, Table 2, and Figure 5 report the descriptive statistics of the input prices index.
The basic statistics are generally similar across different production areas. However, some
areas had larger standard deviations, which suggests the existence of heteroskedasticity in
different areas. The general trend shows that both land prices and labor wages increased
over time.9
To measure the real prices, I also calculated deflated input prices using an agricultural
price index from Brandt (1989). As Figure 5 shows, the price index of agricultural goods
increased at a slower speed than the input prices indices. It indicates that the real input
prices tended to increase between 1901 and 1933.
The survey is considered to be of high quality and is widely used by other scholars
(for example, Myers, 1970; Brandt, 1989). However, it does have some weakness in terms
of representativeness. Since students who were able to go to college in early twentieth-
century China came from relatively wealthy families and had better transportation access,
the sample groups may be more responsive to trade flows.
[Table 1 about here.]
[Table 2 about here.]
7
For two counties (Gaolan in Gansu and Tonglu in Zhejiang), there are two observations for each year.
8
One limitation of the data is that there are some missing values in their report. Since all the missing
values are missed continuously, it minimizes the impact of this problem.
9
After calculating the log change, the mean and median indicates that for each year, there were some
fluctuations in the input prices in each year, but also a large portion of counties had their input prices stable.
Since the yearly change in input prices is the source of variation, I examine the 25th and 75th percentiles of
log change in input price indices. It suggests in each year, most of sampled counties had their input prices
changed.
8[Figure 5 about here.]
The second set of outcomes I examine are social conflicts. The information is collected
by historians from five major newspapers, three official records, and other fifteen archives.
It covers social conflicts for the last ten years of the Qing dyansty, from 1902 to 1911. Most
incidence has detailed record on the time and location when this incidence took place(lunar
date and western date), its leaders, activities, and reason. For example, the first recorded
conflict in 1902 was a strike led by merchants in Wuhu county, Anhui province. The reason
is to against a particular form of tax. The incidence happened at February 18, 1902 (western
date). It does not consider conflicts and revolutions led by revolutionary parties. I also drop
large-scale revolutions in the analysis to ensure that the observed conflicts were driven by
local economic conditions. There are 1280 conflicts left in 1594 counties. Figure 6 depicts
changes in the total number of conflicts overtime.
[Figure 6 about here.]
3.2 Measure of tea trade
The dramatic decline in total tea export of China provides me rich time-series variations.
To measure the decline of tea trade, I use total value of tea exported from 1901 to 1933 from
Hsiao (1974). The original information comes from annual records of the China Maritime
Customs. Figure 4 depicts total value of total black tea exported from China.
The national value of tea export is unlikely to be determined by local economic shocks in
small production areas. However, it may still correlate with local economic shocks and input
prices in large tea production areas. For example, lower input prices might have boosted
tea production and increased tea export. Bad shocks might have affected both input prices
and tea trade. The recorded tea export value may also have the issue of measurement error
due to chaotic local conditions in China. To exclude other shocks from China, I use the
total value of import by Great Britain and the shock of the First World War to instrument
tea exported in China. The total value of import by Great Britain can capture demand
shocks on Chinese tea. The shock of the First World War largely increased transportation
cost between China and Britain, and thus decreased bilateral trade. Neither of these two
9sides were likely to correlate with local shocks in China.
[Figure 7 about here.]
3.3 Measure of suitability for tea production
The cross-sectional variation comes from soil suitability for tea production. This in-
formation comes from the Global Agro-Ecological Zones (GAEZ) database from Food and
Agriculture Organizations. This database divides the entire globe into 2.2 million grid cell-
s, with each cell covers around 50 kilometers × 50 kilometers. In my sample, the average
number of cells covered by each county in China is 40. Most counties cover 6 to 98 cells. It
provides information on the potential yields of 154 crops on each zone. I pick “tea” as the
crop type, with “intermediate” input level, and “rain-fed” level for water supply.
The potential yields are measured using eight classes, ranges from “very high” to “not
suitable”. I use digit numbers (with “very high” is eight and “not suitable” is zero) to denote
each class. Then I take the mean of each county as a measure of average soil suitability for
tea production.
Figure 8 illustrates the suitability for tea production. The production zones are classified
into eight zones. Darker areas are relatively suitable for tea production. White areas are
fully unsuitable for tea production or unassessed.10 Suitable regions are located along the
southeast coast and southwest mountainous areas.
[Figure 8 about here.]
3.4 Access to international trade
I use distance from each county to its closest port as a measure of the access to interna-
tional trade for each county. The distance is calculated based on information from the China
Historical Geographic Information System (CHGIS). This database provides county-level
longitude and latitude information on the years 1820, 1911, and 1990. I use the information
in 1911.
10
Only three cells are unassessed in my sample.
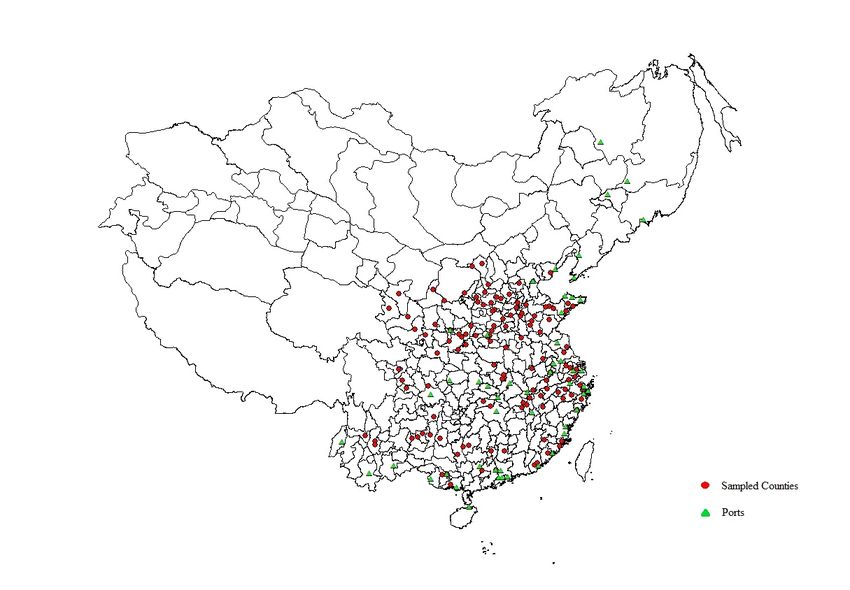
10Figure 9 depicts the location of treaty ports and the examined counties. Table 3 shows
the distribution of distance from each county to its nearest port. Nearly half of the examined
counties had their closest ports located within 100 kilometers. About twenty percent of
counties were farther than 300 kilometers from their closest ports. In this analysis, I use
distance in the 1000-kilometer unit.
[Figure 9 about here.]
[Table 3 about here.]
4 Empirical strategy
The empirical analysis aims to examine the impact of tea export decline on input
prices and social conflicts in counties with heterogenous geographic conditions. I use cross-
sectional information on soil suitability and access to the world market to measure local
geographic conditions.
The baseline regression is
yit = β0 + β1 ln(T radet )Soili + β2 ln(T radet )Disti + β3 ln(T radet )Soili Disti + µt + σi + it ,
(4.1)
where yit is the outcome variable for county i at year t. T radet is total tea exported from
China at time t. Soili is soil suitability at county i. Disti is the distance from county i to
its closest port. µt and σi control for time dummies and county fixed-effects.
The outcome variable yit can denote for log input prices or social conflicts. If yit stands
for the former, since input prices are in index and normalized to 100 in 1926, only results
after controlling for county fixed-effects make sense. The county-level fixed effects could
also control for many other baseline differences that might have correlated with the outcome
variables, such difference in population density before the examined period. The µt aims to
control for national shocks, such as the Xinhai revolution in 1912. If yit stands for conflicts,
the regressions have similar forms but with t ranging from 1902 to 1911.
The endogeneity issue arises in the baseline regression. One potential problem is reverse
causality. For example, lower input prices in a year might have lad to a boost in tea
11production and tea export. In this case, the OLS regression will bias the result against
finding the positive relationship between tea export and input prices. In addition, since tea
export is dominated by several major ports in China, the tea exported from China is likely
to correlate with local supply shocks around major ports. These local shocks, on the other
hand, also correlate with outcomes for counties around the major ports. In addition, the
measurement error issue in tea export is also likely to arise because the constant chaos took
place in China might have affect the accuracy of China Maritimes Customs’ records.
To solve these issues, I consider use total import of all commodities from Great Britain
to measure demand shocks from the world tea market. Britain is a major consumer of black
tea. It was also a big economy whose total import is not likely to be driven by tea import. I
also use shock from the First World War as an instrument for world freight rate and change
in trade values. The First World War increased transportation cost dramatically which
hindered trade between China and Britain. It seems that the British started to rely more
on Indian tea during the war, and the pattern continued after the war. Therefore, the First
World War can be viewed as a turning port on British dependence on the Chinese tea.
The instrument for T radet is constructed using
IV = GBImportt × W W It (4.2)
where GBImportt is total import of Britain at year t. W W I is a dummy variable which
equals 1 if t ≥ 1915. It aims to capture the impact of First World War and the impact
remains after the war.
5 Results on Input prices
Table 4 presents results for the baseline regression. The output variable is nominal land
values. The baseline group is counties just around ports and not suitable for tea production.
The coefficient of tea export on land values is negative and statistically significant, which
suggests that the value of tea export is negatively correlated with land values. However,
this relationship may only reflect the trend that tea export decreased while land values
12increased overtime. I control for national shocks to pick up this trend and other nationwide
shocks in later regressions.
In Column (1) and Column (5), I estimate the average impact of soil suitability on
land values. The results show that areas suitable for tea production were more responsive
to shocks on tea export. As expected, the coefficients after using the IV increased, which
suggest that the OLS coefficients are biased downward. Since both sides are in logs, the
regression results suggest that 1% drop in tea export would lead to a 0.0577% decrease
in land values if the soil suitability for tea improved for one class. In other words, if we
consider the extreme case and compare areas very suitable for tea production versus areas
very unsuitable for tea production (such as the most northern part of China), a 20% drop
in tea export would result in a 4.6% decrease in land values in areas very suitable for tea
production.
There is no significant difference between rural areas close to ports and far from ports.
This result suggests that on average, access to the world market did not affect land owners’
income. It is probably due to the fact that soil condition was the primary determinant in
agricultural production. Access to market might have brought in more information, but it
did not seem affect land values much.
The interaction term of trade, distance, and soil is not statistically significant. It implies
that counties suitable for tea production and close to ports responded in the same way as
counties suitable for tea production but far from ports.
[Table 4 about here.]
Table 5 shows results for labor wages. Different from the result for land values, the
labor wages were indifferent with soil suitability. This result is reasonable because hired
farm laborers were not skilled workers who were only specialized in a certain kind of work.
In addition, I find that distance to ports played a key role in determining nominal wage
levels. Counties far from ports tended to have lower labor wages. For example, after ruling
out the endogeneity issue, on average 1% drop in tea export would cause a 0.18% drop
in labor wages for counties 200 kilometers away from the ports compared with counties
around the ports. Similar as in the previous regression, the last interaction term shows
13that counties suitable for tea production and close to ports responded in the same way as
counties suitable for tea production but far from ports.
The increased drop of wage in remote areas in response to negative trade shocks seem
counter-intuitive. Why didn’t areas close to ports experience larger wage losses? One
explanation is that ports were usually also urbanized areas. Farm workers close to ports
could always move to cities and find another job. The availability of this alternative choice
prevented their wages from dropping. On the contrary, farmers live far from ports might
have relatively fewer other options and had to bear more of the negative trade shocks.
[Table 5 about here.]
Table 6 presents results of real input prices. Since the price index is a national index for
six agricultural products, this only provides a very crude measure of changes in individual
welfare. For the same reason, I cannot control for national shocks in this regression. Results
on soil suitability and distance are in accord with the nominal changes, but the coefficients
are smaller than the nominal changes. This implies that the real shocks were less severe
then nominal shocks, probably due to decreased agricultural commodity prices.
I also find that counties far from ports and suitable for tea production tended to have
relatively less drop in real land values than counties closer to ports and suitable for tea
production. This result might due to the fact that tea production areas far from ports were
more flexible in adjusting their consumption expenditures. Being far from ports, most of
their productions might have not been market-oriented. They probably could easily switch
to make their daily consumptions if a negative shock came.
Another relationship suggested by the last interaction term is that counties far from
ports and suitable for tea production also had less drop than counties unsuitable for tea
production in real labor wages. One possible explanation is that, as a response to negative
trade shock, people might have moved from tea production areas far from ports to areas
unsuitable for tea production and far from the ports. This increased relative labor supply
in areas unsuitable for tea production and far from ports. In the future work I need more
evidence to prove both these two guesses.
[Table 6 about here.]
146 Results on conflicts
In the previous section, I explore the impact of declining tea trade on input prices in
104 counties from 1901 to 1933. In this section, I examine the social consequences measured
using the number of civil conflicts. The civil conflicts data is available from 1902 to 1911. I
match this information with geographic conditions of 1594 counties. Among these counties,
534 of them ever had at least one conflict.
6.1 Conflicts as a response to trade shocks
Table 7 presents the impact on social conflicts. I expect negative tea trade would have
led to more local conflicts. However, local conflicts are also very likely to affect tea trade.
One possibility is that more conflicts would hinder the tea export, which would bias the
result upward. On the other hand, the measurement error issue in tea export would bias
the result downward.
After using instrumental variables, the results show that most places experienced nega-
tive income shocks tended to have more conflicts. If one compares counties very suitable for
tea production and around ports with counties unsuitable for tea production and around
ports, 1% drop in the total tea export would have caused a (0.141 × 8 =)1.12 increase in
the number of conflicts. This is large increase because on average counties had fewer than
one conflict took place. Distance also had a impact on the number of conflicts. Counties
unsuitable for tea production areas had a (2.085 × 2) = 0.417 increase in the number of
conflicts than counties with same production conditions but 200 kilometers closer to ports. I
also find that counties suitable for tea production and far from ports tended to have smaller
increase than counties unsuitable for tea production at the same distance to ports. One
exception is the average result for tea producers. It seems that on average, counties suit-
able for tea production did not have larger increase in the number of conflicts. It partially
due to the positive coefficient of counties that are remote and suitable for tea production.
However, it is also clear that in general, the coefficients of soil suitability is much smaller
than the coefficients for distance. It seems to suggest that land owners were less likely to
start conflicts, probably because they usually had a relatively secured source of income.
15[Table 7 about here.]
Since this analysis covers a larger sample than the previous analysis on input prices, I have
to be cautious when I use the previous results to interpret results in this section. To check
the representativeness, I also run the same regression with John Buck’s sample. Table 8
presents the results. The sample size of this regression is only less than one tenth of the
previous one. The coefficients are not statistically significant probably due to this reason.
However, the coefficients of the IV regression have similar magnitude and value as the ones
in Table 7. Given these results, it seems reasonable to extend the conclusion from John
Buck’s sample to 1594 counties in 18 provinces.
[Table 8 about here.]
6.2 Conflicts as a response to price changes
Since previous literature considers the impact of world price on conflicts, I also run the
same regression using export prices to replace export values. The value and the price should
give similar results if changes in tea trade were mainly driven by demand-side shocks instead
of domestic technical progress. Table 9 shows the results using tea prices instead of total
export values. All the coefficients are statistically significant and have similar values as the
ones in Table 7. For example, if one compares counties very suitable for tea production
and around ports with counties unsuitable for tea production and around ports, the result
suggests that a 1% increase in tea price would have led to a (0.134 × 8) = 1.072 increase in
the number of conflicts. The estimated increase using total tea export is (0.141 × 8 =)1.12.
[Table 9 about here.]
6.3 Results on conflict leaders
I also use the identity information of conflict leaders to further examine the impact
on conflicts. In the recorded conflicts, conflict leaders include farmers, worker, merchants,
gentries, soldiers, revolutionary parties, students, and monks. There are 526 conflicts led by
farmers or workers. If the tea trade shock only affected farmers and farm laborers, I should
16observe a similar increase in the number of conflicts led by these two group of people as
the increase of conflicts by leaders with any identify. On the contrary, if the coefficients are
smaller when I only consider these two groups of people, it may suggest that the negative
impact of trade might have spread to other groups.
Table 10 shows the results on conflicts led by farmers and workers. All the coefficients
are much smaller than in Table 7. Comparing the impact on counties around the ports but
with different soil suitability, the coefficient has only one half of the original value and is
not statistically significant. It suggests that the negative impact of tea trade was probably
more than income shocks on people who were directly involved in tea production process.
For example, merchants who used to be involved into tea trade might have found it less
profitable. For local governments, since tariff on tea was a important source of revenue, the
decreased tea trade might have reduced public funds and lowered the level of public goods
provided, such as social security and local defense.
[Table 10 about here.]
7 Conclusion
The increased competition in the tea market in the early twentieth century has an
influential impact on the world tea market. Today, the top three largest tea exporters are
Sri Lanka, China, and India. Indian tea broke China’s monopoly, increased the average
quality, and lowered the price for tea. This is beneficial for the consumers.
This paper has examined the other side of the story: how did the declining tea export
affect regional welfare in China in the early twentieth-century? Using input price indices
from 104 counties from 1901 to 1933, I find that decreased tea exported lowered land values
more in areas suitable for tea production than in areas unsuitable for tea production. It
also created a negative shock on farm labor wages in counties far from ports. These results
suggests a heterogeneous regional response of this negative trade shock within a big country.
In addition, I use conflict information from 1902 to 1911 in 1594 counties and find that the
negative trade shock also increased local conflicts. Although counties experienced income
loss tended to have more conflicts, results using conflict leaders suggests that people who
17experienced the negative impact was not only tea producers.
Standard trade theory suggests that country should export products with compara-
tive advantages on technology or factor endowments. In the light of this argument, the
transition of China from a tea exporter to a manufactured product producer is beneficial.
The transition also happened naturally. However, this paper suggests that this transition
might have worsened regional welfare and increased local conflicts, which was an essential
problem in China in the early twentieth century. Although I do not estimate the change
in total welfare and it is possible that all the regions were better off with different levels,
anecdotal evidence suggests that negative trade shocks were likely to cause negative impact
on producers and the undesirable consequences tended to last. For example, Fei (1939)
documented life experience of silk producers in a villages, who had received similar negative
trade shocks. The silk producers’ income was largely decreased for more than a decade
and hardly came back. This created shortage of funds and affected consumption budgets,
marriage arrangements, and land distribution in the village. Combined with findings of this
paper, it suggests that negative trade shocks might have caused serious social problems in
the countryside in early twentieth-century China.
References
[1] Loren Brandt. Commercialization and Agricultural Development: Central and Eastern
China, 1870-1937. Cambridge University Press, 1989.
[2] Markus Brückner and Antonio Ciccone. International commodity prices, growth and
the outbreak of civil war in sub-saharan africa*. The Economic Journal, 120(544):519–
534, 2010.
[3] Han-sheng Chen, Wong Yin-Seng, Chang Hsi-Chang, and Huang Kuo-kao. Industrial
Capital and Chinese Peasants: A Study of the Livelihood of Chinese Tobacco Cultiva-
tors. Kelly & Walsh, Limited, 1940.
[4] Harvard Yan ching Library. China Historical GIS. http://www.fas.harvard.edu/
~chgis/.
18[5] China Maritime Customs. Decennial reports 1902-1911. Vo1. I. Shanghai: the Statis-
tical Department of the Inspectorate General of Cusloins, 1(91):3.
[6] China Maritime Customs. Returns of trade and trade reports, 1909-1930.
[7] H David, David Dorn, and Gordon H Hanson. The china syndrome: Local labor market
effects of import competition in the united states. The American Economic Review,
103(6):2121–2168, 2013.
[8] Oeindrila Dube and Juan F Vargas. Commodity price shocks and civil conflict: Evi-
dence from colombia. The Review of Economic Studies, 80(4):1384–1421, 2013.
[9] Xiaotong Fei. Peasant Life in China: A Field Study of Country Life in the Yangtze
Valley. Routledge & Kegan Paul, 1939.
[10] Robert Gardella. Harvesting mountains: Fujian and the China tea trade, 1757-1937.
University of California Press, 1994.
[11] Pinelopi Koujianou Goldenberg and Nina Pacnik. Distributional effects of globalization
in developing countries. Journal of Economic Literature, 45:39–82, 2007.
[12] Liang-lin Hsiao. China’s foreign trade statistics, 1864-1949. Number 56. Harvard Univ
Asia Center, 1974.
[13] IIASA/FAO. Global Agro-ecological Zones (GAEZ v3.0). http://www.fao.org/nr/
gaez/en/, 2012.
[14] Ruixue Jia. The legacies of forced freedom: China’s treaty ports. Review of Economics
and Statistics, 96(4):596–608, 2014.
[15] Wolfgang Keller, Ben Li, and Carol H Shiue. Chinas foreign trade: Perspectives from
the past 150 years. The World Economy, 34(6):853–892, 2011.
[16] Wolfgang Keller, Ben Li, and Carol H Shiue. The evolution of domestic trade flows
when foreign trade is liberalized: Evidence from the chinese maritime customs service.
Institutions and Comparative Economic Development, 150:152, 2012.
19[17] Wolfgang Keller, Ben Li, and Carol H Shiue. Shanghai’s trade, china’s growth: Conti-
nuity, recovery, and change since the opium wars. IMF Economic Review, 61(2):336–
378, 2013.
[18] William Somerset Maugham. On a Chinese screen, volume 17. George H. Doran
Company, 1922.
[19] Kris James Mitchener and Se Yan. Globalization, trade, and wages: What does history
tell us about china? International Economic Review, 55(1):131–168, 2014.
[20] Ramon Hawley Myers. The Chinese peasant economy: agricultural development in
Hopei and Shantung, 1890-1949, volume 47. Harvard University Press Cambridge,
Mass., 1970.
[21] Nina Pavcnik. Trade liberalization, exit, and productivity improvements: Evidence
from chilean plants. The Review of Economic Studies, 69(1):245–276, 2002.
[22] Thomas G Rawski. Chinese dominance of treaty port commerce and its implications,
1860–1875. Explorations in Economic History, 7(1):451–473, 1970.
[23] Thomas G Rawski. Economic growth in prewar China, volume 245. University of
California Press Berkeley, 1989.
[24] Petia Topalova. Factor immobility and regional impacts of trade liberalization: Evi-
dence on poverty from india. American Economic Journal: Applied Economics, 2(4):1–
41, 2010.
[25] L Alan Winters, Neil McCulloch, and Andrew McKay. Trade liberalization and poverty:
the evidence so far. Journal of Economic literature, pages 72–115, 2004.
[26] Zhongping Yan. Zhongguo Mianfangzhi Shi Gao (A History of Chinese Cotton Spinning
and Weaving). Science Press, 1955.
[27] Weimin Zhong. Chaye yu Yapian: shijiu shiji jingji quanqiuyua zhong de zhongguo
(Tea and opium: China in the process of Economic Globalizaiton in the Nineteenth
century). Sanlian chubanshe, 2010.
20[28] Guotu Zhuang. Chaye, maoyi yu yapian tea, silver, and opium). Zhongguo jingjishi
yanjiu, 3, 1995.
21Figure 1: Trade Expansion of China (in Haikwan Tael ), 1864 to 1932
Source: Hsiao (1974), pages 22-24, 117-119
Figure 2: The Decline of China’s Black Tea Export (in Haikwan Tael ), 1867-1932
Source: Hsiao, 1974, pages 22-24, 117-119
22Figure 3: Black Tea Export and Total Tea Export (in Haikwan Tael ), 1987-1932
Figure 4: The Decline of China’s Tea Export (in Haikwan Tael ), 1867-1932
Source: Hsiao, 1974, pages 22-24, 117-119
23Figure 5: Average input prices
Source: Input prices come from Buck (1937). Agricultural commodity price index comes from Brandt (1989)
Figure 6: Total number of conflicts
Source: Zhang and Ding, 1982.
24Figure 7: The Ratio of Black Tea Exported from China (in Haikwan Tael ) to Black Tea
Imported to Great Britain (in million pounds)
Figure 8: Potential yields for tea production
Source: Global Agro-Ecological Zone database, Food and Agricultural Organization)
25Figure 9: Location of Ports and Sampled Counties
26Table 1: Summary Statistics on Land Price
district mean sd max min count
Spring Wheat 77.0732 28.21 150 8 205
Winter Wheat-millet 88.6241 35.7842 321 15 423
Winter Wheat-kaoliang 68.7269 32.2746 199 16 520
Yangzi Rice-wheat 79.3902 37.5098 201 11 387
Rice-tea 84.6073 26.76 192 31 354
Sichuan Rice 74.3621 27.7151 150 17 116
Double Cropping Rice 85.8409 23.7903 157 32 220
Southwestern Rice 97.6 59.7519 353 18 155
Table 2: Summary Statistics on Labor Wages
district mean sd max min count
Spring Wheat 98.7919 26.7464 175 19 197
Winter Wheat millet 88.9148 42.7346 661 25 399
Winter Wheat kaoliang 83.2075 43.5035 319 17 535
Yangzi Rice-wheat 88.0458 28.5046 193 30 371
Rice-tea 84.1307 26.5611 200 25 352
Sichuan Rice 110.232 51.2833 225 40 69
Double Cropping Rice 84.8015 24.6369 179 32 136
Southwestern Rice 79.3714 37.8907 183 19 175
Table 3: Number of Counties with the Nearest Ports Located in Given Distance (kilometer)
500
46 24 19 9 4 4
27Table 4: Impact of Tea Export on Log Land Values, 1901-1933
(1) (2) (3) (4) (5) (6) (7) (8)
VARIABLES OLS OLS OLS OLS IV IV IV IV
log(total tea export) -0.164*** -0.480***
(0.0494) (0.103)
log(total tea export)× soil 0.0248** 0.0211 0.0270* 0.0577** 0.0669* 0.0748***
(0.00900) (0.0157) (0.0137) (0.0227) (0.0395) (0.0286)
log(total tea export)× distance -0.346* -0.0862 -0.220 -0.255 0.323 0.0504
(0.190) (0.240) (0.213) (0.696) (0.541) (0.456)
log(total tea export)× distance × soil -0.00108 -0.0724 -0.181 -0.227
(0.0745) (0.0581) (0.269) (0.165)
28
Constant 3.197*** 4.020*** 5.856*** 3.588***
(0.141) (0.298) (0.256) (0.412)
Observations 2,341 2,341 2,341 2,341 2,341 2,341 2,341 2,341
R-squared 0.489 0.488 0.026 0.490 0.484 0.488 -0.026 0.485
Number of county code 103 103 103 103 103 103 103 103
County FE Y Y Y Y Y Y Y Y
Time dummies Y Y Y Y Y Y
Kleibergen-Paap F stat 1017 284.2 531 1433
Standard errors are clustered at province level
*** pTable 5: Impact of Tea Export on Log Labor Wages, 1901-1933
(1) (2) (3) (4) (5) (6) (7) (8)
VARIABLES OLS OLS OLS OLS IV IV IV IV
log(total tea export) -0.150*** -0.386***
(0.0322) (0.110)
log(total tea export)× soil -0.00339 0.00658 0.0100 -0.0280 0.0253 0.0217
(0.00504) (0.00984) (0.00955) (0.0270) (0.0430) (0.0304)
log(total tea export)× distance 0.104 0.297** 0.135 0.925** 0.807* 0.493**
(0.120) (0.114) (0.127) (0.442) (0.413) (0.229)
log(total tea export)× distance × soil -0.0595 -0.103* -0.224 -0.253
(0.0521) (0.0493) (0.251) (0.197)
29
Constant 3.740*** 3.540*** 5.411*** 3.499***
(0.0725) (0.198) (0.133) (0.246)
Observations 2,222 2,222 2,222 2,222 2,222 2,222 2,222 2,222
R-squared 0.573 0.573 0.016 0.573 0.570 0.558 -0.021 0.570
Number of county code 99 99 99 99 99 99 99 99
County FE Y Y Y Y Y Y Y Y
Time dummies Y Y Y Y Y Y
Kleibergen-Paap F stat 573.9 304.1 1468 2257
Standard errors are clustered at province level
*** pTable 6: Impact of Tea Export on Real Input Prices, 1902-1933
(1) (2) (3) (4) (5) (6)
VARIABLES land values land values land values labor wages labor wages labor wages
log(total tea export) -0.115** -0.0661 -0.291*** -0.0936** -0.0586* -0.276***
(0.0449) (0.0503) (0.0619) (0.0339) (0.0318) (0.0690)
log(total tea export)× soil 0.0332** 0.0258* 0.0625*** 0.0106 0.0115 0.0255
(0.0136) (0.0124) (0.0230) (0.00942) (0.00964) (0.0257)
log(total tea export)× distance -0.140 -0.222 -0.0143 0.207 0.166 0.555**
(0.196) (0.196) (0.308) (0.127) (0.133) (0.239)
log(total tea export)× distance × soil -0.109** -0.389** -0.115** -0.123** -0.298**
(0.0509) (0.177) (0.0455) (0.0473) (0.151)
year 0.0123*** 0.00960**
(0.00394) (0.00443)
30
log(tea export)× distance × soil -0.165***
(0.0527)
Constant 1.144*** -22.74*** 0.681*** -18.03**
(0.245) (7.752) (0.143) (8.572)
Observations 2,225 2,225 2,225 2,111 2,111 2,111
R-squared 0.030 0.102 -0.013 0.012 0.076 -0.039
Number of county code 103 103 103 99 99 99
County FE Y Y Y Y Y Y
IV Y Y
Kleibergen-Paap F stat 3173 2625
Standard errors are clustered at province level.
*** pTable 7: Impact of Tea Export on Social Conflicts, 1902-1911
(1) (2) (3) (4) (5) (6) (7)
VARIABLES OLS OLS OLS OLS IV IV IV
log(tea export)× soil -0.00605 -0.00214 -0.0260 -0.0503 -0.141**
(0.0130) (0.00156) (0.0279) (0.0352) (0.0659)
log(tea export)× distance -0.443 -0.0565** -0.577 -1.362* -2.085*
(0.334) (0.0260) (0.447) (0.803) (1.074)
log(tea export)× distance × soil 0.00170 0.0975 0.530**
(0.00619) (0.122) (0.240)
Constant 0.139 0.686 0.155** 1.131
31
(0.200) (0.476) (0.0556) (0.890)
Observations 15,940 15,940 15,940 15,940 15,940 15,940 15,940
R-squared 0.015 0.016 0.034 0.016 0.012 0.012 0.006
Number of counties 1,594 1,594 1,594 1,594 1,594 1,594
County FE Y Y Y Y Y Y
Time dummies Y Y Y Y Y Y Y
Kleibergen-Paap F stat 8.270e+14 1.290e+14 5.010e+13
Standard errors are clustered at province level.
*** pTable 8: Impact of Tea Export on Social Conflicts (use John Buck’s sample), 1902-1911
(1) (2) (3) (4) (5) (6) (7)
VARIABLES OLS OLS OLS OLS IV IV IV
log(total tea export)× soil suitability -0.0614 -0.00113 -0.0787 -0.0704 -0.159
(0.0599) (0.00163) (0.123) (0.0878) (0.187)
log(total tea export)× distance -0.355 -0.0654** -0.699 -0.984 -1.622
(0.723) (0.0232) (0.955) (1.159) (1.511)
log(total tea export)× distance × soil -0.00112 0.0212 0.543
(0.00832) (0.610) (0.962)
year==1911 = o, - - - -
Constant 0.843 0.719 0.219*** 2.272
32
(0.749) (1.290) (0.0709) (2.412)
Observations 1,030 1,030 1,030 1,030 1,030 1,030 1,030
R-squared 0.038 0.036 0.062 0.039 0.038 0.035 0.037
Number of county code 103 103 103 103 103 103
County FE Y Y Y Y Y Y
Time dummies Y Y Y Y Y Y Y
Kleibergen-Paap F stat 4.860e+13 1.520e+13 9.180e+12
Robust standard errors in parentheses
*** pTable 9: Impact of Tea Price on Social Conflicts, 1902-1911
(1) (2) (3) (4) (5) (6)
VARIABLES OLS OLS OLS IV IV IV
log(price of tea) × tea -0.0138* -0.0536*** -0.0479*** -0.134***
(0.00771) (0.0136) (0.00947) (0.0168)
log(price of tea) × distance -0.725*** -0.999*** -1.299*** -1.988***
(0.137) (0.153) (0.169) (0.188)
log(price of tea) × tea × distance 0.219** 0.505***
(0.0985) (0.121)
Constant 0.106*** 0.346*** 0.600***
33
(0.0365) (0.0581) (0.0840)
Observations 15,940 15,940 15,940 15,940 15,940 15,940
R-squared 0.015 0.017 0.018 0.014 0.016 0.014
Number of object id 1,594 1,594 1,594 1,594 1,594 1,594
County FE Y Y Y Y Y Y
Time dummies Y Y Y Y Y Y
Kleibergen-Paap F stat 28298 28298 9431
Standard errors in clustered at province level
*** pTable 10: Impact of Tea Export on Social Conflicts’ Leaders, 1902-1911
(1) (2) (3) (4) (5) (6) (7)
VARIABLES OLS OLS OLS OLS IV IV IV
log(total tea export)× soil suitability -0.0165 -0.00124* -0.0339 -0.0302 -0.0605
(0.0132) (0.000664) (0.0214) (0.0227) (0.0369)
log(total tea export)× distance -0.283 -0.0156* -0.467* -0.480* -0.802*
(0.165) (0.00836) (0.257) (0.278) (0.438)
log(total tea export)× distance × soil 0.00207* 0.0605 0.106*
(0.00119) (0.0369) (0.0634)
Constant 0.284 0.551* 0.0595** 1.293*
34
(0.207) (0.307) (0.0250) (0.708)
Observations 18,540 18,540 18,540 18,540 18,540 18,540 18,540
R-squared 0.019 0.020 0.024 0.022 0.019 0.019 0.020
Number of object id 1,854 1,854 1,854 1,854 1,854 1,854
County FE Y Y Y Y Y Y
Time dummies Y Y Y Y Y Y Y
Kleibergen-Paap F stat 1.480e+15 4.950e+14 4.030e+13
Standard errors in clustered at province level
*** pYou can also read