Supporting the Implementation of Cross-Border Collaborative Frameworks: Newry-Dundalk Sub-Region - Working Paper 2 Regional Profile and the ...
←
→
Page content transcription
If your browser does not render page correctly, please read the page content below
Supporting the Implementation of
Cross-Border Collaborative Frameworks: Newry-
             Dundalk Sub-Region

                     Working Paper 2

      Regional Profile and the Socio-Economic Context

                        19 June 2008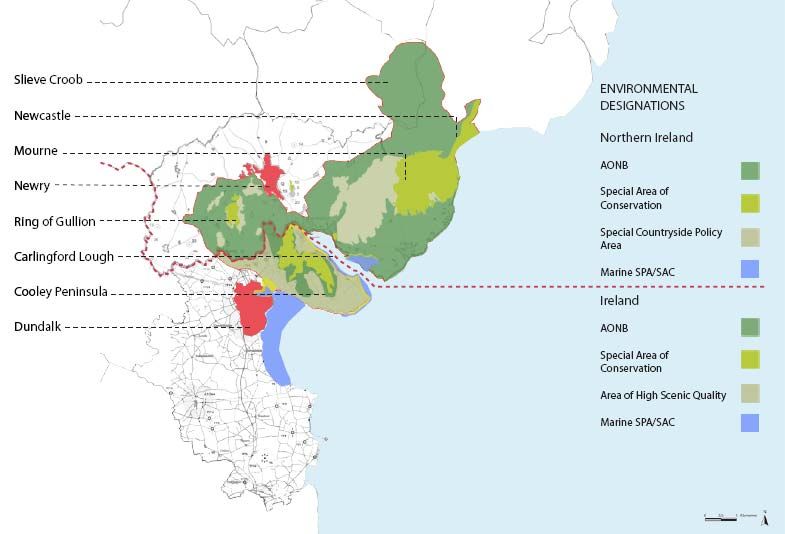
Working Paper 2

                        Regional Profile and the Socio-Economic Context

Table of Contents

Introduction .......................................................................................................................................... 1
Defining the Sub-Region ..................................................................................................................... 3
   Shared Environment & Infrastructure .............................................................................................. 4
Population ............................................................................................................................................ 5
Population Projections ......................................................................................................................... 6
Housing ................................................................................................................................................ 9
   Social and Affordable Housing ...................................................................................................... 10
Education ........................................................................................................................................... 11
Economy ............................................................................................................................................ 12
Unemployment and Social Issues ...................................................................................................... 15
Planning Strategies............................................................................................................................. 16
Key issues and Conclusion ................................................................................................................ 18

                                     International Centre for Local and Regional Development
Introduction
Located at the centre of the Dublin-Belfast corridor, the Newry and Dundalk sub-region benefits
from its proximity to Belfast and Dublin and to neighbouring towns, such as Banbridge to the north
and Drogheda to the south. The increasing mobility along the corridor and to the surrounding
districts and counties, including Armagh and Monaghan, is impacting the regional dynamics and the
choices business and residents make in location decisions.

This review focuses primarily on Dundalk Town, Newry City, County Louth, and the Newry and
Mourne District. Examining the two cities in relation to each other and to their more rural regions
provides valuable insight into the sub-region's current and future profile. The working paper draws
on various statistical sources as well as structured discussions with stakeholders in Newry and
Dundalk. Many figures and insights derive from the following sources:

   •   Republic of Ireland Census (2002 and 2006)
   •   Northern Ireland Census (2001 and projections)
   •   Newry & Mourne Area Draft Plan (2015)
   •   Louth County Council Development Plan (2003-2009)
   •   Newry and Mourne in Focus: Economic Profile, September 2007 Draft, Regional Forecasts

Incompatible data complicate the development of a joined-up socio-economic profile of the sub-
region. As noted in the recently published Atlas of the Island of Ireland, census and other data
collected in Northern Ireland and the Republic of Ireland “have often been collected using different
questions, at different time intervals, and aggregated into different spatial units.” Given the rapid
change that has occurred in the last five years, the 2001 census for Northern Ireland and the 2002
census for the Republic of Ireland, while offering a comparable time frame, cannot offer an up-to-
date picture of the socio-economic dynamics of the Newry and Dundalk sub-region. Furthermore,
this paper makes projections into the future based on limited points in time, available local
government projections, and a variety of assumptions. They should not be read as a prediction of
the future, but rather as a set of potential outcomes for the sub-region based on stated assumptions.
Often small variances in assumptions will produce dramatic differences in outcomes when
projected out for 15 years. Initial findings are helpful for underpinning the choice of projects for
co-operation:

           •   Regional Environmental Management: The sub-region shares important
               environmental amenities that require collective management to protect them and to
               maximize tourism and recreation benefits.
           •   Sustainable Energy: Pollution, Greenhouse Gas Emissions and rising energy prices
               do not respect national borders. A joined-up approach to sustainable energy can help
               the sub-region to acquire funding and can help it to emerge as a leader in
               sustainability.
           •   International Services Zone: This globally growing industry needs a critical mass to
               develop in the sub-region and cooperation to attract firms.
           •   Up-skilling the workforce: Similar to trends in other EU counties, the Newry and
               Dundalk region is experiencing a decline in agriculture and manufacturing jobs
               needs to prepare its workforce for the 21st century global economy.
           •   Shared Infrastructure: The sub-region shares important road, port and air
               infrastructure. Co-operation can help it to make the highest impact investments at the
               lowest cost.

                        International Centre for Local and Regional Development
                                             Working Paper 2
                                                  1 of 18
• Urban Regeneration: Both Newry and Dundalk are expected to absorb significant
population growth in the near future to create a more sustainable region and a pole to
counterbalance Belfast and Dublin. This countervails the recent trend of most growth
occurring in rural areas. The sub-region will have to work together to encourage
urban rather than rural population growth.
The shared environmental and infrastructural resources and mutual goals of more spatially balanced
growth argue for closer co-operation and more integrated development within the sub-region.
Newry and Dundalk on the Dublin Belfast Corridor
Note: Travel times and distances are from each urban centre to the next, travel
times based on schedules and Google map for road travel. Average home
prices and commercial rents are drawn from various internet sources.
International Centre for Local and Regional Development
Working Paper 2
2 of 18Newry and Dundalk: Regional Context
Defining the Sub-Region
To provide a regional context, the map above provides some key indicators of recent data including
population, jobs, travel distances and time between the urban centres along the corridor. As cross-
border urban centres, Newry and Dundalk are 23 km from each other, centre to centre. With the new
A1/M1 improvements, you can now travel between the two towns in 25 minutes. Their respective
train stations are 19 minutes apart and a bus ride now takes anywhere from 20 to 30 minutes
depending on the time of day.
Both the National Spatial Strategy and the Regional Development Strategy project strong
population and job growth for the Newry and Dundalk sub-region and try to concentrate this growth
within existing urbanized areas, particularly the cities of Newry and Dundalk. One way to
determine the regional influence of the existing sub-region is to examine travel to work data. Other
methodologies can also be used to determine regional influence and travel-to-work data do not
capture catchment areas for retail or tourism, which would be larger given the location on the
M1/A1. Using a travel-to-work-based methodology indicates that Newry and Dundalk exert a
strong localized regional attraction.
According to the 2001 Census in Northern Ireland, 83% of work trips from Newry and Mourne stay
within the district. 63% more trips come into Newry and Mourne from Banbridge than vice versa,
but the absolute difference of 370 tips is not large. Armagh, on the other hand, attracts 138 more
work trips from Newry & Mourne than it sends. Although the district has a net out-commute of
1000 work trips, this difference is almost entirely accounted for by the strong draw of Belfast,
which received 1,398 commuters from Newry and Mourne according to the census. Given the total
International Centre for Local and Regional Development
Working Paper 2
3 of 1830,106 trips originating in Newry & Mourne, trips to Belfast represent just fewer than 5% of the
total.
In Dundalk, 71% of work trips from the 2006 Census were under 10 km, compared to less than 50%
for the RoI leading the a conclusion that most workers stay within the city. Again, however, the
regional draw of the national capital is apparent; 12% of work trips from Dundalk were over 50
kilometres. The vast majority of these likely went to Dublin.
Given these commuting patterns, the district of Newry & Mourne and County Louth provide a good
approximation of the extents of the sub-region. Drogheda exerts its own influence and can be netted
out of sub-regional calculations. Using this methodology for assessing the sub-region also
facilitates the use of census and other district/county level data.
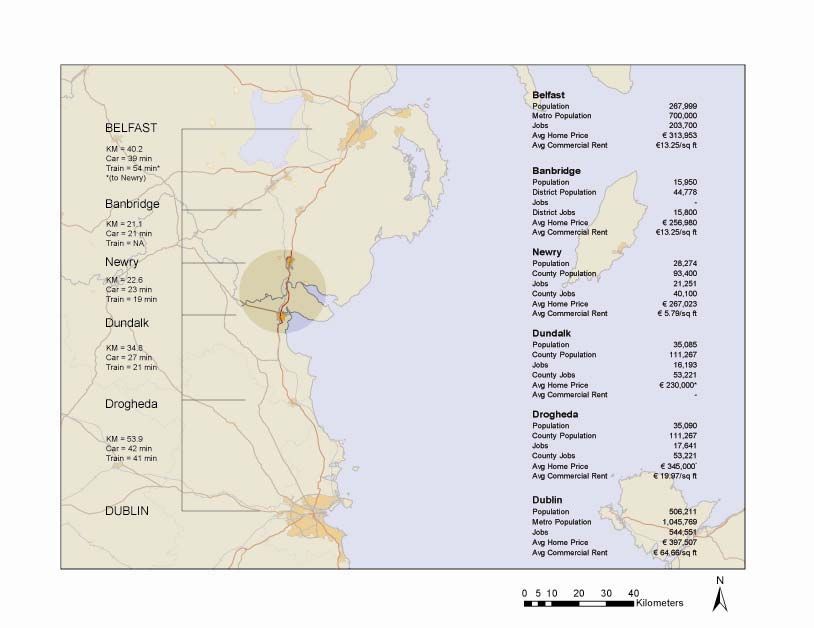
Shared Environment & Infrastructure
Newry and Dundalk share the same ‘back yard’, which includes unique amenities as Carlinford
Lough, Mourne, Cooley Peninsula and the Ring of Gullion. This shared natural heritage both
unites and physically separates the sub-region. It unites by the shared benefits that can come from
tourism and recreation and the need to coordinate resource protection. It separates the two urban
centres by encouraging growth in Newry and Dundalk to move away from one another. Geography
is such that the two centres will not grow into one urban entity. The map below shows important
environmental designations in the sub-region and illustrates how they both join and separate Newry
and Dundalk.
International Centre for Local and Regional Development
Working Paper 2
4 of 18The sub-region also shares important transportation infrastructure, such as the roads, train and ports,
including Warrenpoint, which ships 48% of its freight to the Republic of Ireland. Greenore Port,
north of Dundalk, is being considered as a deep water port that could take some of pressure of
Dublin port.
Road, train and bus connections also provide Newry and Dundalk with convenient access to the two
capitals and their airports. These shared resources create much of the impetus for joint planning
within the sub-region to maximize the benefit of new infrastructure, generate new employment and
protect a shared environmental resource.
In the context of absorbing projected job and population growth numbers, managing these resources
in a sustainable manner will be a key issue in border planning in the next 10 and 15 years. The
working paper on Infrastructure looks more closely at the infrastructure required to support the
implementation of cross-border collaboration in the Newry-Dundalk Sub-Region.
Population
In 2006, there were an estimated 63,360 residents living in the combined cities of Newry and
Dundalk and an estimated 204,670 residents in the larger areas of Newry and Mourne District
Council and County Louth.
IDA Ireland officials have estimated that the Newry Dundalk catchment area includes about
170,000 persons, the number of persons within 20 km. This figure corresponds roughly to the
combined population of Newry and Mourne District Council and County Louth minus the
population of Drogheda, although the 20km radii from each town include areas of Armagh and
Monaghan. Twenty km also corresponds to the approximate distance to the next major urban
centres, Banbridge and Drogheda, which exert their own regional influences.
Table 1 shows the populations of Newry and the Newry and Mourne District for 2001 and 2006 and
for Dundalk and County Louth for 2002 and 2006. 1 The last row shows the growth rate for the sub-
region. In 2006, Newry and Dundalk each had about one-third of the population of their respective
Council and County. From 2001 to 2006, Newry and Mourne grew at an average annual rate
(AAGR) of 1.42% while County Louth grew by 2.24%.
Table 1 also compares growth rates with national rates and other urban and regional rates. All rates
are given in average annual growth rates for easy comparison and to normalize differences in
census years. Over the last five years, both Newry and Dundalk have grown more slowly than the
averages for Northern Ireland and the Republic of Ireland. Newry & Mourne and Louth, on the
other hand, have grown more quickly. Put another way, the urban areas have been growing more
slowly than the national averages while the regions have been growing more quickly than the
national average.
Newry & Mourne has grown at a similar rate to its neighbouring districts of Banbridge and Down,
while Louth has grown more slowly than the neighbouring counties of Meath and Cavan. On both
sides of the border, the counties and councils abutting the Dublin and Belfast have seen the fastest
rates of population growth. This fast growth can be attributed to the expansion of the two cities’
metropolitan areas and to the increased distances travelled by commuters. Within Louth, Drogheda
appears to be influenced by its proximity to Dublin and has a higher growth rate than Louth.
1
The 2005 estimates are taken page 27 of the Newry and Mourne in Focus: Economic Profile, September 2007 Draft
prepared by Regional Forecasts.
International Centre for Local and Regional Development
Working Paper 2
5 of 18Table 1: Population and Recent Annual Average Growth Rates
2001/2002 2006 AAGR
Newry 27,433 28,274 0.61%
Lisburn 108,694 112,900 0.76%
Derry 105,066 107,900 0.53%
Newry and Mourne 87,058 93,400 1.42%
Banbridge 41,392 45,500 1.91%
Down 63,828 68,300 1.36%
Northern Ireland 1,685,267 1,742,000 0.66%
Dundalk 32,505 35,085 1.93%
Drogheda 31,020 35,090 3.13%
Galway City 66,163 72,729 2.39%
Towns over 10,000 551,863 615,925 2.78%
Louth 101,821 111,267 2.24%
Meath 134,005 162,831 4.99%
Cavan 56,546 64,003 3.15%
Rep. Ireland 3,917,203 4,239,848 2.00%
Sub-Region 157,859 169,577 1.61% 2
Sources: NI and RoI Censuses, Regional Forecasts.
In Newry & Mourne, growth has been led by international migration, the third highest increase in
the net inflow of international migrants as a proportion of the population in Northern Ireland. In
fact, without immigrants there was a net out-migration of Northern Irish. 3 It is estimated that 85%
of the migrants are from Poland and Lithuania. Dundalk is also experiencing growth through
international migration. According to the 2006 census, 11% of Dundalk's population is from another
country, primarily European. Migrants make up an important part of the sub-region’s population
and economy. Migrants make up a relatively larger portion of the urban centres than the sub-region
as a whole.
Population Projections
The Newry Dundalk sub-region is projected to continue to grow rapidly over the next decade
although there are major differences between the projections for each jurisdiction. Based on
projections in the Newry and Mourne Area Plan, the District is projected to grow by 8,600 persons
by 2015 while Louth’s projections are significantly higher with an estimated increase of 60,700
residents by 2020. Louth’s projections, however, are based on assumptions in the National Spatial
Strategy and regional planning guidelines, which want the Dundalk and Drogheda to
counterbalance Dublin to some extent. It must be noted that these are more normative than
quantitative. Nearly three-quarters of the projected 60,700 person growth in Louth is allocated in
Dundalk and Drogheda, nearly doubling the size of the two towns. Although official documents list
these high growth number as estimations, they should be viewed as targets or aspirations. Table 2
shows the projected population of the sub-region based on projections for Newry & Mourne and
Louth. It is expected to increase from 169,577 persons in 2006 to 224,115 in 2020. As illustrated in
Graph 1, the majority of the population in 2006 is in Newry & Mourne. Based on higher projected
growth rate in the Republic, however, the majority of the population is projected to be in Louth by
about 2017.
2
Rate is calculated by projecting Newry & Mourne calculation into 2002, using the district’s AAGR, and assessing
the AAGR from 2002 to 2006 for the sub-region as a whole.
3
In 2006 there was a net external in–migration of 1,241 and a net domestic out-migration of -112. These figures are
cited from Regional Forecasts page 18. RoI, Great Britain and the rest of the world are included in external
migration counts.
International Centre for Local and Regional Development
Working Paper 2
6 of 18Table 2: Population-Existing and Local Government Projections 4
2001/2002 2006 2015 2020
Newry 27,000 28,000 33,000 37,000* 5
Dundalk 33,000 35,000 50,000* 60,000
Total 60,000 63,000 83,000 97,000
Newry and Mourne 87,000 93,000 102,000 107,000
Louth 102,000 111,000 147,000* 172,000
Drogheda (31,000) (35,000) (47,000)* (55,000)
Sub-Region 158,000 170,000 202,000 224,000
Sources: RoI Census; Regional Forecasts Study for Newry and Mourne; Louth
County Development Plan and Newry & Mourne Area Plan.
Graph 1: Local Government Projected Sub-Regional Growth by Area
Sources: RoI Census; Regional Forecasts Study for Newry and Mourne; Louth
County Development Plan and Newry & Mourne Area Plan.
Table 3 gives the average annual growth rates for the purpose of comparing regions and analysing
the projected shift in growth patterns in the coming years. Not unlike other jurisdictions where
suburban growth rates are higher than their core urban area, Newry and Mourne and County Louth
have grown at a faster annual rate in the last five years than the respective urban areas of Newry
and Dundalk. The shift of relative importance in observed rural and urban growth rates to future
projected rural and urban growth rates anticipates a desired change in the patterns of human
settlement in the sub-region based on new policies which favour more concentrated urban growth
and brown field development. For Dundalk, it also reflects a policy desire for Dundalk to reach an
appropriate “Gateway” size as indicated by the National Spatial Strategy. In total, the projections
suggest that the annual rate of growth for the sub-region will increase by about 25% from 1.61%
from 2002 to 2006 to 2.01% from 2006 to 2020.
4
Figures rounded to 1000s place.
5
The starred numbers in italics are calculated based on extrapolation/interpolation of average annual growth rates due
to the varying population projections available to the authors; 2015 in the North and 2020 in the South.
International Centre for Local and Regional Development
Working Paper 2
7 of 18Table 3: Average Annual Growth Rates
Average Annual Growth AAGR AAGR 2006 The shift of relative importance in observed
Rates (AAGR) 2001/02 to 2015/20 rural and urban growth rates to future
to 2006 projected rural and urban growth rates
Newry 0.61% 1.88% anticipates a desired change in the patterns
Newry and Mourne 1.42% .98% of human settlement in the sub-region based
Dundalk and Suburbs 1.93% 3.91% on new policies which favour more
concentrated urban growth and brown field
County Louth 2.24% 3.16% development.
Sub-Region 1.61% 2.01%
Sources: Same as Table 2.
Under existing policy-directed population projections, the urban centres of Newry and Dundalk are
expected to see major increases in future residents. Dundalk and the immediate suburbs are
projected to almost double with 24,915 new residents bringing Dundalk and its surrounding suburbs
to some 60,000 by 2020. Newry’s projected growth is more modest, with a projected 33,435
residents in 2015, an increase of 5,160 persons.
Graph 2, however, illustrates how anticipated growth rates for the two cities begin to diverge from
past growth trends and may be more normatively than quantitatively derived. An extrapolation of
current growth rates for Dundalk would indicate a population of fewer than 46,000 by 2020,
significantly lower than the NSS-derived 60,000. In Newry, the difference appears less dramatic,
but the projections more than triple the observed annual growth rate of recent years.
Graph 2: Planned Growth Vs Extrapolation for Newry and Dundalk
Projected growth rates
70,000
for Newry and Dundalk
60,000
diverge from past growth
trends and may be more 50,000
normatively than 40,000
quantitatively derived. 30,000
This shift has two 20,000
primary contributing 10,000
causes: 1) a projected
0
increase in regional 2001/2002 2006 2015 2020
growth rates; and 2) a
projected increase in the Dundalk – NSS 32,505 35,085 50,000 60,000
percent of regional Dundalk – Extrapolation 32,505 35,085 42,000 46,000
growth accommodated
by Newry and Dundalk. Newry - Area Plan 27,433 28,274 33,000 37,000
Newry – Extrapolation 27,433 28,274 30,000 31,000
Sources: Same as Table 2
Given this discrepancy, the growth projections for both Newry and Dundalk should be reassessed.
Policy can and will, of course affect growth and settlement patterns, but may have far less dramatic
effects than anticipated. Not only do projections anticipate a 25% increase in annual growth rates,
they also predict a radical shift in household settlement decisions.
In both cities, the need for a proactive urban development strategy that creates an attractive living
environment and neighbourhoods that create a mix of housing typologies, affordability levels and
good access to schools, services, business and employment opportunities will be needed to keep
existing residents and businesses and to drive population growth.
International Centre for Local and Regional Development
Working Paper 2
8 of 18Housing
As average household size has declined, housing has grown at a faster rate than population in both
Newry and Dundalk. Nevertheless, demand, or at least speculation, appears to be out-pacing
supply. Between 1996 and 2006, Newry & Mourne has had the highest increases in average house
prices in the United Kingdom, more than tripling. Despite the fact that wages are 10% lower than
the NI average and that most work trips occur within the district, Newry & Mourne has house prices
that are about one third higher than the Northern Ireland average. Rapid growth in housing prices
has only begun to slow in the last year with the general fall in prices. Dundalk has experienced
similar trends, although growth has moved more in line with the rest of the Republic of Ireland.
The Newry Dundalk sub-region has similar housing stock and rural/urban mixes on both sides of
the border. The percent of terraced housing is greater in Louth largely because the county consists
of two urban areas, Dundalk and Drogheda, as opposed to just one, Newry. Netting out Drogheda
reveals a more similar composition of housing types as shown in Table 4. Newry & Mourne and
Louth also have similar average housing occupancies; 2.76 and 2.88 respectively in 2005 and 2006.
Table 4: Planned Growth Vs Extrapolation for Newry and Dundalk
2001/2002 Detached house Semi-Detached Terraced Flat
Louth 42.87% 26.77% 26.02% 4.34%
Dundalk 26.82% 32.16% 36.43% 4.59%
Louth (no Drogheda) 52.77% 22.22% 21.90% 3.11%
Newry & Mourne 50.00% 25.00% 19.00% 5.00%
Source: NIHE and RoI Census
Table 5, Future Housing Needs, illustrates that with average occupancy rates continuing to decline,
Newry and Dundalk must provide large amounts of new housing to absorb its projected population
growth. 6 In total the sub-region needs to provide an average 2,210 housing units from now until
2020. Regional Forecasts estimates that, of 8,500 units allocated in the Newry and Mourne 2015
area plan, only 4,000 remain to be developed. Their report estimates that an additional 2,700 units
will needed to avoid a supply shortage. 7
In Dundalk, housing needs are even greater. If government population targets are met and average
household occupancy declines at historic trends to 2.21 persons per household, 14,500 new units
will be needed in the city alone by 2020, a 114% increase over 2006. County Louth will need
34,000 new units. If household sizes remain constant, some 21,000 new units will be needed. Thus
several factors may adversely affect the accuracy of housing projections, in particular, the reliability
of population projections and the assumption that household size will continue to decrease. Graph 3
compares housing requirements for the sub-region based on the projections in Table 5, an
extrapolated sub-regional population figure with declining average household size, the population
trends in table 5 with no change in average household size and the extrapolated figure with constant
household sizes. As in Graph 2, the results of the projection vary significantly based on the
assumptions. The highest growth scenario more than doubles the lowest growth scenario.
6
Future housing needs were calculated by extrapolating the decline in average household size into the future,
dividing the estimated population by this new average household size and subtracting the 2006 housing stock from
this figure. Again Drogheda was subtracted from Louth to calculate the sub-region.
7 Regional Forecasts, 2007. Draft Version: Newry and Mourne in Focus: Economic Profile. Oxford Economics,
Oxford.
International Centre for Local and Regional Development
Working Paper 2
9 of 18Table 5: Projected Future Housing Demand Based on Local
Government Projections and Declining Household Sizes
Net Average
Housing Annual
2006 2015/2020 AAGR Needs Needs
Newry Population 93,400 102,000 0.98%
and Mourne Housing 33,800 40,500 2.03% 6,700 670
Occupancy 2.76 2.52
Dundalk Population 35,085 60,000 3.91%
Housing 12,736 27,000 5.51% 14,500 1,034
Occupancy 2.75 2.21
Louth Population 111,267 172,000 3.16%
Housing 38,598 73,000 4.66% 34,000 2,430
Occupancy 2.88 2.37
Sub-Region Population 169,577 225,000 2.01%
Housing 59,826 98,000 3.02% 30,940 2,210
Occupancy 2.83 2.30
Source: RoI Census, Regional Forecasts, Louth County Development Plan, Newry & Mourne Area Plan and
ICLRD calculations
Graph 3: Sub-Regional Housing Demand Projections (Multiple Scenarios)
Housing demand projections vary
significantly based on the
assumptions. This graph projects
the following scenarios:
1) Those articulated in table 5:
local government population
projections coupled with a
decrease in household size
2) An extrapolated sub-regional
population figure with declining
average household size.
3) Local government population
projections, with no change in
average household size.
4) The extrapolated population
figure with constant household
sizes.
Source: RoI Census, Regional Forecasts, Louth County Development Plan,
Newry & Mourne Area Plan and ICLRD calculations
Within these varying scenarios, there is also a potential spatial mismatch between projections and
recent growth trends. It must be reemphasised that population growth projections for the urban
centres of Newry and Dundalk differ greatly from recent trends. Most of the sub-region’s housing
growth has been in rural one-off units, not in urban apartments. Housing demand will be highly
impacted by population growth. For example, if current housing growth and household size trends
continue, Dundalk will need 8,000 net new units rather than 14,500 by 2020. As stated earlier,
projections should not be read as a prediction of the future, but rather as a set of potential outcomes
for the sub-region based on stated assumptions. Assumptions about average household size and
population growth have important impacts on projected housing needs.
Social and Affordable Housing
Both Louth and Newry & Mourne need substantial additions to social housing stock in the coming
years. Newry & Mourne with its high home prices and low average wages is one of the most
unaffordable areas of NI. Its NIHE affordability gap in 2006 of £81,400 is among the highest. In
International Centre for Local and Regional Development
Working Paper 2
10 of 182003, only 14% of owner occupied housing was assessed by the NIHE as affordable, compared
with a NI average of 29%. 8
The Newry & Mourne Housing Needs Assessment projects a need for 1,199 new social housing
units by 2012, of which 520 in Newry proper. In County Louth, the council has enacted legislation,
under part 5 of the Planning and Development Act, 2000 and the Planning and Development
(Amendment) Act 2002 that requires developments on more than 0.1 hectares or of more than 4
units to provide 20% of housing at cost price to the council who will sell them as affordable units.
As noted earlier, both Louth and Newry & Mourne intend to meet housing needs primarily within
their urban centres. The fastest growth, however, has occurred in the suburbs and the countryside
over the past years. Reversing this trend will be a challenge that will require, among other policies,
a commitment to providing social housing and incentivizing developers to construct affordable
housing within the urban areas. The alternative scenario is a constrained housing market that will
have limiting impacts on desired growth.
Education
In 2001 and 2006 respectively, the two censuses found that Newry City and Dundalk Town had
3,978 and 3,330 persons with 3rd degree qualifications or higher. The following table combines the
District and County level data (minus Drogheda) to paint a rough picture of the sub-region's
approximate educational attainment profile, although the qualification categories are not entirely
equivalent in NI and RoI. Both Louth and Newry & Mourne have smaller percents of the working
age population with upper qualifications than the national averages. In NI, 16% of the working age
population has level 4 or 5 qualifications; in RoI, 25% has greater than third level qualifications.
Nearly half of Newry and Mourne’s working age population has only primary school education.
Table 6: Education Qualifications
Working Upper Third
Age Primary Secondary/ Level+ /
Population or Less Percent Level 2/3 Percent Level 4/5 Percent
Newry &
Mourne 57,908 25,480 44% 14,477 25% 8,107 14%
Louth 86,699 15,377 18% 19,877 23% 18,325 21%
Sub-Region 117,366 36,014 31% 28,033 24% 20,335 17%
Sources: RoI Census, NI Census, Regional Forecasts. 9 Drogheda not included in sub-region.
Newry & Mourne District has eleven secondary schools and a third level institution, the Southern
Regional College. The college brings together former further education colleges serving four
council districts. The college operates out of four locations that serve specific programmes that
include: Art, Beauty and Hairdressing, Business Administration, Childcare, Computing,
Construction, Engineering, Health and Social Care, Hospitality and Tourism, Sport, Media,
Performing Arts, Science and Multimedia.
County Louth has eleven secondary schools, five vocational, one community and one third level
institution, Dundalk Institute of Technology (DKIT). The Institute provides programmes at craft,
undergraduate and postgraduate levels to more than 3,500 full-time and 1,500 part-time students.
8 NIHE affordability figures taken from Regional Forecasts report, page 97.
9
Actual figures from the 2006 Irish Census are used. Proportions of attainment levels are taken from the 2001 NI
Census and applied to 2006 population estimates in order to estimate 2006 educational attainment levels for Newry
& Mourne.
International Centre for Local and Regional Development
Working Paper 2
11 of 18The Institute is organised into four Schools: Business and Humanities; Engineering; Informatics,
Music and Creative Media; and Nursing, Midwifery, Health Studies and Applied Sciences. The
campus is located on a 90 acre campus that is 1/2 mile from the main Dublin Belfast road and is
now part of the Dundalk 2020 Sustainable Energy Pilot Zone.
Economy
As throughout most of the Island of Ireland, the Newry Dundalk sub-region has created new jobs
over the last decade and unemployment has declined. In Newry & Mourne the average annual
growth rate in jobs between 1995 and 2005 was 2.91%. Between 2002 and 2006, the number of
jobs held by residents in County Louth grew at an average annual rate of 4.2%. 10 This corresponds
to an average annual growth rate of 1.76% in NI and 4% in RoI over the same time periods. Thus
both Louth and Newry & Mourne have grown more quickly than their respective national averages.
Newry & Mourne, in particular, has outpaced national growth perhaps as a result of its proximity to
the booming Irish economy of the late 90's and 2000's and its location on the Dublin-Belfast
corridor.
Table 7 gives the total number and percentage of jobs by sector for Newry & Mourne in 2005 and
for County Louth without Drogheda in 2006. The results show that Newry & Mourne is
comparatively more reliant on retail, health and education than Louth, which is comparatively more
reliant on business, financial services and transport and communications. Although imperfect, the
combination of employment figures by industry sector from the North and South paints a rough
picture of the relative importance of different sectors within the sub-region. In absolute employment
both economies rely heavily on manufacturing, construction, retail and health, which, taken
together, account for over half of all employment in the sub-region.
Table 7: Approximation of Total Sub-Region Jobs by Sector – 2005/2006
Louth (No
Newry & Drogheda) Sub-
Mourne 2005 Percent 2006 Percent Region Percent
All Sectors 40,100 100% 33,828 100% 73,928 100%
Agriculture 1,203 3% 1,230 4% 2,433 3%
Extraction 0 0% 170 1% 170 0%
Manufacturing 5,614 14% 5,030 15% 10,644 14%
Construction 3,208 8% 4,192 12% 7,400 10%
Wholesale and Retail 8,421 21% 4,942 15% 13,363 18%
Hotels and Restaurants 2,406 6% 1,439 4% 3,845 5%
Transport and Communication 1,604 4% 2,308 7% 3,912 5%
Financial Services 401 1% 1,074 3% 1,475 2%
Business Services 2,406 6% 2,650 8% 5,056 7%
Public Admin. And Defense 1,604 4% 1,464 4% 3,068 4%
Education 4,812 12% 2,034 6% 6,846 9%
Health 6,416 16% 3,820 11% 10,236 14%
Other Services 1,604 4% 3,475 10% 5,079 7%
Source: RoI Census and Regional Forecasts
Both sides of the border have seen shifts in the employment sector with a decline in agriculture jobs
and stagnation or decline in manufacturing jobs. There has also been rapid growth in the
construction and services industries. Despite sharing some economic characteristics and important
infrastructure, Newry and Dundalk have different economic profiles.
10 The number of jobs for Newry & Mourne comes from DETI figures cited in Regional Forecasts, whereas the Louth
figures come from the RoI census.
International Centre for Local and Regional Development
Working Paper 2
12 of 18In 2006, Dundalk had 16,193 employed residents, 30% of Louth's total 53,221 employed residents.
Employed residents, however, cannot be compared directly with number of jobs. Many employees
may commute from other areas, particularly to the employment centre, Dundalk. Comparable
economic datasets are required to conduct further analysis. Nevertheless, given commuting patterns
the figures for the county give a best available approximation of the number of total jobs. In fact, a
disproportionate number of the 12% of those who commute more than 50 kilometres from Louth
are likely employed in high skills jobs in Dublin. Thus resident-based analysis of employment may
overestimate the number of high skilled jobs in the region.
According to interviews with IDA Ireland, despite lacking the cachet and clustering of Dublin,
Dundalk can compete for investment in almost all sectors thanks to its shorter commutes, lower
rents and lower labour force turnover rates. It also has a competitive advantage over Newry and
Belfast in terms of corporation taxes, proximity to Dublin and rapid planning approvals. Table 8
shows which sectors of the economy have led recent growth in Dundalk and Louth. Farming and
manufacturing have continued to decline while services and construction have led recent growth. As
the property market cools, the construction sector is expected to decline and perhaps shed jobs.
Table 8: County Louth and Dundalk: Job Growth by Sector
Clerical, Professional,
All Farming, fishing Building and managing and Communication Sales and technical and Other (incl.
occupations and forestry Manufacturing construction government and transport commerce health Services not stated)
Dundalk 2002 13664 89 2180 784 2323 785 2054 1930 1503 2016
Dundalk 2006 16193 80 2075 1068 2792 898 2590 2407 2069 2214
% Change 18.51% -10.11% -4.82% 36.22% 20.19% 14.39% 26.10% 24.72% 37.66% 9.82%
Louth 2002 45119 1440 7499 3615 7480 2877 5947 6567 4608 5086
Louth 2006 53221 1246 7444 4662 8856 3402 7441 7953 6115 6102
% Change 17.96% -13.47% -0.73% 28.96% 18.40% 18.25% 25.12% 21.11% 32.70% 19.98%
Source: RoI Census
In terms of the jobs per sector as a percent of all jobs, Dundalk and Louth have a larger portion of
their workforce in the manufacturing sector than the national economy. They have a smaller portion
of workers in agriculture. Table 10 compares the jobs breakdown of Dundalk and Louth as
compared to the RoI. A score of 1 means that a sector provides an equal amount of jobs as a
percent of total jobs as the national economy. A score under 1 means that the local economy
provides proportionally fewer jobs than the national average; a score over 1 indicates proportionally
more jobs in a sector.
Table 9: Dundalk and County Louth: Relative Importance of Sectors Compared to RoI
Clerical, Professional,
Farming, fishing Building and managing and Communication Sales and technical and Other (incl.
and forestry Manufacturing construction government and transport commerce health Services not stated)
Dundalk 2006 0.12 1.09 0.75 0.98 1 1.17 0.9 1.18 1.23
Louth 2006 0.55 1.19 0.99 0.95 1.16 1.02 0.91 1.06 1.03
Source: RoI Census and ICLRD calculation
Thus although manufacturing employment has been declining, it still plays a large part in the
overall economic make up of Louth. Dundalk, on the other hand, has a good concentration of sales,
commerce and services jobs. Again, these figures must be looked at critically since they refer to the
employment of residents rather than jobs within an area.
In total Newry City had an estimated 21,250 jobs in 2005, approximately half of the 41,000 jobs in
the Newry & Mourne District, which gained jobs in all sectors except agriculture and public
administration. Retail, construction and services have grown at the fastest rate. The retail sector has
International Centre for Local and Regional Development
Working Paper 2
13 of 18grown at double NI's average rate over the last decade, albeit from a low base. 11 In 2005, it
employed 21% of the workforce in Newry & Mourne. In interviews for this study, as well as the
2007 Regional Forecast study, however, the over-dependency on retail, construction and
manufacturing was cited as a long-term economic concern. These sectors are not expected to grow
much in the future.
Education (12%) and health (16%) are important sectors in the District’s economy that have an
urban focus in terms of location and good potential in terms of growth. Newry, the location of
Norbrook, a pharmaceutical company that employs 1,000, has shown it can support life-science
companies. Although difficult to quantify, Newry's collective entrepreneurial spirit has been cited as
an economic strength. Table 9, taken from Regional Forecasts, shows the change in employment by
sector from 1997 to 2005 and the relative importance of employment sectors in 2005.12
Table 10: Newry & Mourne 1997 – 2005 Employment Growth by Sector and 2005
Employment
Growth Rate 2005 Importance Approx. Jobs
All Sectors 3.2% 100% 40,100
Agriculture -2.2% 3% 1,203
Extraction 0% 0
Manufacturing 0.1% 14% 5,614
Construction 5.7% 8% 3,208
Wholesale and Retail 5.4% 21% 8,421
Hotels and Restaurants 9.6% 6% 2,406
Transport and Communication 5.4% 4% 1,604
Financial Services 7.4% 1% 401
Business Services 6% 2,406
Public Admin. And Defense -1.3% 4% 1,604
Education 1.4% 12% 4,812
Health 3.5% 16% 6,416
Other Services 3.7% 4% 1,604
Source: Regional Forecasts
Table 11 compares the jobs for Newry City and Newry & Mourne to Northern Ireland employment
figures at the time of the 2001 Census. These figures show the importance of retail and education to
employment in Newry City. It also shows that, unlike Louth, Newry and Mourne is comparatively
less reliant on manufacturing and more reliant on agriculture and construction. 13
11 Newry still has fewer retail jobs per thousand persons than the NI average.
12 At the time of the 2001 census, Newry and Mourne had just under 32,000 employed residents. This figure falls
between the number of jobs listed by DETI in 1995 and 2005 but much closer to the 1995 figure of 30,100 than the
2005 figure of 40,100. These numbers, however, come from different sources and are aggregated slightly
differently. Furthermore, DETI figures were available as percentages of a total job figure to the tens place, therefore
being less precise than the census figures.
13 This is partially a result of the differing relative importance of agriculture and manufacturing in the economies of
Northern Ireland and the Republic of Ireland. A complete set of 2005 DETI figures would allow a more
contemporary appreciation of the relative importance of Newry's economic sectors compared to Northern Ireland as
a whole.
International Centre for Local and Regional Development
Working Paper 2
14 of 18Table 11: Newry and Newry & Mourne - Relative Importance of Sectors Compared to NI
Wholesale and Hotels and Transport and
Agriculture Manufacturing Utilities Construction Retail Catering Communications
Newry 2001 0.25 0.96 0.96 1.05 1.23 0.98 0.93
Newry & Mourne 2001 1.44 0.93 0.78 1.74 1.05 0.86 0.94
Financial Real Estate Public Admin.
Services and Business And Defense Education Health Other
Newry 2001 0.9 0.84 0.7 1.23 1.06 1.13
Newry & Mourne 2001 0.81 0.75 0.58 1.08 0.92 0.97
Source: NI Census and ICLRD calculation
Throughout NI, business service jobs are predicted to drive growth. These jobs, however, account
for a low share of Newry & Mourne's total jobs. This sector is unlikely to provide enough jobs to
put a dent in the district’s 35% economically inactive rate. Transport and communications
employment nearly doubled in the last decade, although from a small base, and could provide new
jobs in the coming years. Growth in traffic through Warrenpoint, based on the proposed Southern
Bypass, would encourage growth in this sector.
Table 12 is taken from the recent Newry and Mourne in Focus: Economic Profile, September 2007
Draft by Regional Forecasts. It shows that the service sector is expected to play an increasingly
important part of Newry & Mourne economy including tourism and retail, education and health and
financial and business services. It also shows a reduction from 2005 (see table 9) of the relative
importance of retail and hotels and education and health. These projections, however, must be
viewed critically, in particular regarding the doubling of construction jobs given the recent
slowdown in the real estate market.
Table 12: Newry & Mourne Projected Employment 2015
Total Percent
Retail, Hotels and Restaurants 11,605 25%
Public Admin 1,186 3%
Education and Health 11,617 25%
Construction 7,005 15%
Financial and business services 4,887 11%
Other 10,186 22%
Total 46,486 100%
Source: Regional Forecasts
Newry & Mourne is also expected to see a rise in tourism which will help grow the services sectors,
particularly retail and hotel. The Regional Economics document that sources NITB and RF/Oxford
Economics projects tourist trips to Newry and Mourn to increase from 93,000 in 2005 to 139,000
by 2015, with an increase in tourist expenditures of £6,000,000 (from £14,000,000 to £20,000,000).
Unemployment and Social Issues
In 2006, unemployment for County Louth was lower than in 2002, but still high at 11.1%,
significantly above the national average of 8.5%. Unemployment particularly affects lower skilled
and manual workers. 14 Despite the decline in traditional manufacturing jobs and the growth in
population, Louth has lowered the overall number of unemployed individuals from 5,343 in 2002 to
5,092 in 2006 thanks to robust overall economic performance.
14
Social Inclusion Unit Louth Local Authorities (2004) Social Profile of County Louth
International Centre for Local and Regional Development
Working Paper 2
15 of 18In Newry & Mourne, the unemployment rate appears far lower at 3%, but is collected using a
different method and is not comparable to the figure for Louth. The district has a high inactive
workforce rate, 35%, compared to 30% for NI. Furthermore, much of Newry's recent job growth
has been in part time jobs, particularly in the retail sector where only 1 in 2 jobs are full time. Part
time jobs in the retail sector do not pay comparably to full time manufacturing jobs. The vast
difference in unemployment calculation methodology across the border complicates the calculation
of a meaningful sub-region unemployment rate. It suffices to say that there is significantly greater
in the sub-region than the island of Ireland average.
With declining manufacturing and agriculture sectors, the Newry Dundalk sub-region will see an
increase in the income gaps of skilled and low-skilled workers, as a high number of low-skilled
workers compete for fewer jobs at lower pay. Regional Forecasts predicts that only 1 in 10 jobs in
Newry over the next decade will require no skills. The report also warns of the emergence of a two-
tiered economy of haves and have-nots; the first of which will benefit from shifts in the region's
economic profile while the other languishes. Education, job training and social programs are
essential to ensure that all of the sub-region benefits from economic growth and increasing
prosperity.
Planning Strategies
The NSS and the RDS identify Dundalk and Newry as strategic areas for accommodating future
development and decentralizing national growth. Dundalk is one of 9 “gateways” in the NSS, and
along with Drogheda is intended become a cluster of economic and industrial activity and to drive
development in the east-border sub-region in cooperation with Newry. Newry, identified as a
“Main Hub and an Inter-Regional Gateway” in the RDS, is intended to become “a growth pole to
counter-balance Belfast Metro”.
While the two national spatial strategies are based on similar European Union approaches to
planning; at the local level the plans are developed and implemented differently. In particular, the
Newry & Mourne district plan is much more specific about the exact location and amount of
development to be absorbed by 2015. The Louth plan, on the other hand, is much more flexible,
zoning more land than needed to accommodate projections and allowing the market to select the
location. The map below shows the general planning controls of the two plans. Both plans
concentrate growth in existing urban areas but allow for rural one-off housing and “context-
appropriate” development throughout the rural areas. In fact, most recent growth has occurred in
these rural and suburban environments where restrictions are tighter.
Both plans also discuss the importance of working and planning across the national border.
Although the cities of Newry and Dundalk are physically growing apart rather than toward one
another, shared infrastructure and environmental amenities unite them. In the future, thanks to
common EU policies and increased co-operation between NI and RoI, cross-border commuting will
likely become more common and the housing markets more aligned.
According to the new brownfield development policy in Northern Ireland; 60% of Newry &
Mourne district growth is to take place in urban areas. It must be reiterated, however, that this
counters recent trends where only 17% of recent growth occurred in the urban area. Newry will
have to closely monitor the impact of this new policy and its implications for attracting new urban
residents and keeping existing residents. There is a somewhat unsubstantiated assumption that this
new urban growth will respond to changing lifestyles and an increased interest in urban living.
International Centre for Local and Regional Development
Working Paper 2
16 of 18The plan is very specific in delineating the exact location for proposed developments by land use.
Within the Newry area, for example, the plan designates 124.05 hectares of new industrial land,
primarily to the north of Newry Centre along the new road alignment which will connect A1/M1.
New housing areas, of which a total of 119.16 hectares are designated, are primarily concentrated to
the west of the city centre.
Land availability and the planning process have been an impediment to the development of
industry, in particular. Although industrial lands fetch high prices in Newry (£220,000 per acre as
opposed to £120,000 in Craigavon) and the 2015 plan identifies over 120 hectares for industrial
development, supply is not coming on line fast enough to attract investment. According to
interviews undertaken for this research, a slow permitting process restricts direct investment and
real estate development. The Regional Forecasts report also suggests that the district must designate
more land for housing lest it negatively impact economic performance as well as housing
affordability and availability.
In Louth, planning controls are less geographically specific and allow for more flexibility. Each
approach has advantages and disadvantages. The downside of more flexibility may be more sprawl,
while the highly specific nature of the Newry & Mourne's plan may create an inability to respond
the shifting nature of the economy and a lack of capacity to absorb population growth and create
new jobs. If controls in the North are stricter than in Louth, individual households and companies
may prefer to locate in Louth instead of Newry & Mourne. The County Louth Development Plan,
2009 to 2015, is currently in progress and presents an opportunity to encourage cross-border
collaboration in growth management.
International Centre for Local and Regional Development
Working Paper 2
17 of 18Key issues and Conclusion
Although Belfast and Dublin are within relatively acceptable commute times from Newry and
Dundalk, actual commuting patterns suggest that Newry and Dundalk draw largely from the
immediate sub-region. The socioeconomic magnetism of the two capitals exerts far stronger pull
than that exerted by Newry and Dundalk. In fact, commute patterns suggest that Belfast and Dublin
draw much of the highest qualified labour away from the sub-region than other types of labour. In
order, to achieve the policy goals of generating more spatially balanced development, both sides of
the border need to work together to achieve a critical population mass, to create new jobs, and to
prepare the entire workforce to contribute to and benefit from economic growth.
On its own, Dundalk will have a difficult time achieving the population ascribed to a “gateway”
city. Taken together with Newry, however, the twin-cities already have an appropriate mass with
63,000 residents in 2006, surpassing the threshold identified by the National Spatial Strategy. Both
Newry and Dundalk will need to develop mixed housing typologies to attract and keep both
families and young professionals. Since policy in the North and South encourage development to
locate in the urban centres, Newry and Dundalk’s urban regeneration strategies, addressed in
Working Paper 10, will have to provide attractive opportunities for the growing population.
Differing levels of controls, price differentials or enforcement could cause the more lax system to
absorb more of the housing demand. With rising house prices and reductions in household sizes, a
large increase in housing, both market and social, is necessary. Sustainable development projects,
highlighted in Working Paper 8, will also play a key role in the sub-region’s future delivery of
housing and industry.
As infrastructure linkages improve and travel times are reduced along the M1/A1 corridor, the
mobility of the residents, business and students between Newry and Dundalk and to other
neighbouring urban centres such as Belfast, Banbridge, Dublin and Drogheda will increase. Growth
and potential synergies in infrastructure and delivery of services, present a host of opportunities for
joined-up planning and resource management for the mutual benefit of both sides of the border.
Working Paper 6 looks more closely at existing and proposed infrastructure in the sub-region. The
provision of tourist infrastructure and the co-operative management of ecological resources,
examined in Working Paper 7, is an appropriate step to fostering a sub-regional identity, protecting
valuable resources and encouraging the tourism economy.
Despite being in an embryonic stage, the financial services sector has the potential to deliver high
growth in the coming years and is investigated in Working Paper 9. Health and Education are other
important sectors for both local economies that deserve additional research and potential areas for
cooperation. Education, job training and social programs are essential to ensure that all of the sub-
region benefits from economic growth and increasing prosperity. Newry Southern Regional College
and the Dundalk Institute of Technology have a key role in providing progressive tracts to both
upskill the workforce and provide education programmes that meet projected workforce needs in
tourism, sustainable energy, financial and management services. Working Paper 5, prepared with
the two schools, examines potential areas for co-operation and makes the case for co-ordinating
curricula.
Working papers 7 through 10 highlight some of the opportunities for cross-border co-operation in
the Newry Dundalk sub-region in environmental asset management, sustainable development, an
international services zone and urban regeneration. They also provide a framework for cross-border
competitive collaboration and map out potential delivery mechanisms for implementation. Working
paper 11 identifies cross-cutting themes and areas for increased future co-operation.
International Centre for Local and Regional Development
Working Paper 2
18 of 18You can also read