Identification of Urban
Truck Parking Locations in
   the MAASTO Region
←
→
Page content transcription
If your browser does not render page correctly, please read the page content below
Identification of Urban Truck Parking Locations in the MAASTO Region
Authors
Glenn Vorhes
University of Wisconsin–Madison
Ernest Perry
Co-Principal Investigator
University of Wisconsin–Madison
Soyoung Ahn
Co-Principal Investigator
University of Wisconsin–Madison

About the Mid-America Freight Coalition (MAFC)
The industries and farms of the Mid-America region can compete in the marketplace only if their
products can move reliably, safely and at reasonable cost to market.
State Departments of Transportation play an important role in providing the infrastructure that
facilitates movement of the growing amount of freight. The Mid-America Freight Coalition was
created to support the ten states of the Mid America Association of State Transportation
Officials (MAASTO) region in their freight planning, freight research needs and in support of
multi-state collaboration across the region.
www.midamericafreight.org
TECHNICAL REPORT DOCUMENTATION
 1. Report No. MAFC 21                           2. Government Accession No.            3. Recipient’s Catalog No. CFDA 20.701

 4. Title and Subtitle                                                                  5. Report Date January 2019
 Identification of Urban Truck Parking Locations in the MAASTO Region                   6. Performing Organization Code

 7. Author/s                                                                            8. Performing Organization Report No.
 Glenn Vohres, Ernest Perry, Soyoung Ahn                                                MAFC 21

 9. Performing Organization Name and Address                                            10. Work Unit No. (TRAIS)
 Mid-America Freight Coalition and the MAASTO Working Group                             11. Contract or Grant No.
 University of Wisconsin–Madison
 1415 Engineering Drive, 2205 EH                                                        TPF-5(293) PO# 39500 – 0000011137
 Madison, WI 53706

 12. Sponsoring Organization Name and Address                                           13. Type of Report and Period Covered
 Wisconsin Department of Transportation                                                 Final Report 01/01/2018 – 01/31/2019
 Division of Transportation Investment Management
 PO Box 7913                                                                            14. Sponsoring Agency Code
 Madison, WI 53707
                                                                                        TPF-5(293) PO# 39500 – 0000011137

 15. Supplementary Notes

 Truck parking is an important element of the United States’ transportation system, as it provides truckers with safe places to rest
 and stage for deliveries. Demand for truck parking spaces exceeds supply, and shortages are especially common in and around
 urban areas. These shortages jeopardize public safety. This report seeks to examine the potential parking availability of vacant
 urban parcels by establishing a methodology to identify parcels and examining whether the identified parcels are suitable for truck
 parking. This effort is based on a previous white paper demonstrating that affordable, accessible parcels are available to
 accommodate truck parking and, when used in conjunction with other policies like TPIMS and re-use of parking on the right of
 way, adaptation of urban sites could help reduce the frequency and severity of truck parking shortages. This study expands upon
 this earlier white paper and examines potential urban parking in the ten-state Mid America Association of State Transportation
 Officials (MAASTO) region. The screening methodology is also refined to allow for greater precision and adaption to the various
 parcel data found across the ten states.

 17. Key Words                                   18. Distribution Statement
 Truck parking, MAASTO, urban, parking           No restrictions. This report is available to the public through the National
 shortages, TPIMS                                Transportation Library Digital Repository.

 19. Security Classification (of this report)    20. Security Classification (of this     21. No. of Pages          22. Price
                                                 page)
 Unclassified                                                                             56                        -0-
                                                 Unclassified

Form DOT F 1700.7 (8-72) Reproduction of form and completed page is authorized.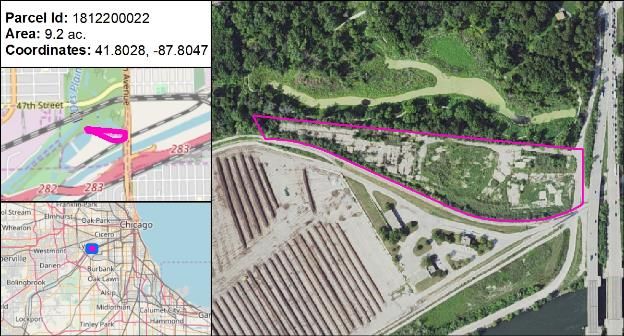
DISCLAIMER

This research was funded by the Wisconsin Department of Transportation (WisDOT) and the United States
Department of Transportation (USDOT) in the interest of information exchange. The material or
information presented/published/reported is the result of research done under the auspices of the
Department. The content of this presentation/publication/report reflects the views of the author, who is
responsible for the correct use of brand names, and for the accuracy, analysis and any inferences drawn
from the information or material presented/published/reported. WisDOT and FHWA (US DOT) assume no
liability for its contents or use thereof. This presentation/publication/report does not endorse or approve
any commercial product, even though trade names may be cited, does not reflect official views or policies
of the Department or FHWA (US DOT), and does not constitute a standard specification or regulation of
the Department or FHWA.
Executive Summary
Truck parking is an important element of the United States’ transportation system, as it provides truckers
with safe places to rest and stage for deliveries. Demand for truck parking spaces exceeds supply, and
shortages are especially common in and around urban areas. These shortages jeopardize public safety as
they are associated with truck parking on highway ramps and shoulders, parking in unsecure areas, and
violations of truckers’ maximum hours of service.

There are three types of operation and policy solutions for this parking shortage.

    1. Truck Parking Information and Management Systems (TPIMS) that collect and communicate
       information about parking availability through either detection and communication technologies
       or through social media applications.
    2. Construction or re-adaptation of additional parking spaces on the current or new right of way,
       such as closed weigh stations.
    3. Collaborative planning and rehabilitation of vacant urban parcels for use as parking areas.

This report seeks to examine the potential parking availability of vacant urban parcels by establishing a
methodology to identify parcels and examining whether the identified parcels are suitable for truck
parking. This effort is based on a previous white paper that examined potential urban parking in three
cities: St. Louis, Missouri, Columbus, Ohio, and Detroit, Michigan. The authors found that affordable,
accessible parcels are available to accommodate truck parking. When used in conjunction with other
policies like TPIMS and re-use of parking on the right of way, adaptation of urban sites could help reduce
the frequency and severity of truck parking shortages.

This study expands upon this earlier white paper and examines potential urban parking in the ten-state
Mid America Association of State Transportation Officials (MAASTO) region. The screening methodology
is also refined to allow for greater precision and adaption to the various parcel data found across the ten
states.

Identification of Urban Truck Parking Locations in the MAASTO Region                                      i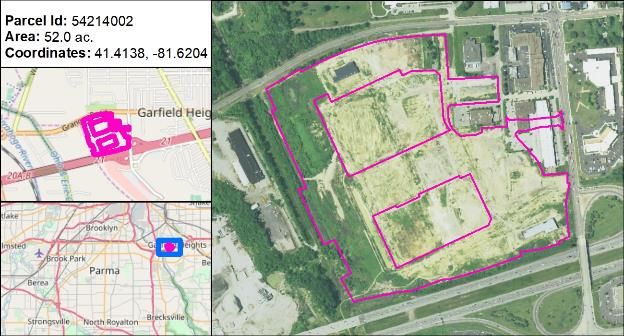
Table of Contents
Executive Summary........................................................................................................................................ i
Introduction .................................................................................................................................................. 1
Trucker Experiences and Perceptions ........................................................................................................... 1
Policy and Innovation Solutions for Truck Parking Shortages ...................................................................... 2
   Truck Parking Information and Management System (TPIMS) ................................................................ 2
   Re-Opening Rest Areas and Purchasing Rights of Way............................................................................. 3
   Collaborative Planning Approach.............................................................................................................. 3
Methodology................................................................................................................................................. 4
Results ........................................................................................................................................................... 9
Discussion.................................................................................................................................................... 10
Conclusion ................................................................................................................................................... 11
References .................................................................................................................................................. 12
Appendix 1. Candidate Parcel Table ........................................................................................................... 14
Appendix 2. Candidate Parcel Maps ........................................................................................................... 16
   Illinois ...................................................................................................................................................... 16
   Indiana .................................................................................................................................................... 21
   Iowa......................................................................................................................................................... 24
   Kansas ..................................................................................................................................................... 27
   Kentucky.................................................................................................................................................. 31
   Michigan.................................................................................................................................................. 33
   Minnesota ............................................................................................................................................... 36
   Missouri .................................................................................................................................................. 42
   Ohio ......................................................................................................................................................... 47
   Wisconsin ................................................................................................................................................ 52

Table of Figures
   Table 1. MAFC states, selected urban areas, and parcel data sources..................................................... 4
   Figure 1. Selection of parcels within 0.25 miles of freight corridors. ....................................................... 5
   Figure 2. Selection of parcels within 0.25 miles of ramps or other access points. ................................... 6
   Figure 3. Raster/Image representation of distance from industrial/commercial areas. ......................... 7
   Figure 4. Analysis of parcel satellite imagery............................................................................................ 8
   Table 5. Candidate Parcel Results ............................................................................................................. 9

Identification of Urban Truck Parking Locations in the MAASTO Region                                                                                               ii
Introduction
Efficient trucking is an essential element of the United States’ economic success. In 2015, trucks carried
63% of the nation’s freight traffic, about 11 billion tons of goods worth over $13.2 trillion (1). Truck
tonnage is forecasted to increase 44% by 2045, while the value of goods carried by truck will increase
by 84% (1). The trucking industry is an economic heavyweight: it employs 1.6 million drivers (2) and an
additional seven million people in the industries that support trucking (3).

One part of trucking infrastructure that is growing in importance is truck parking, which includes
publicly-owned rest stops and private, commercial truck stops.

Truck stops and rest stops serve important safety and economic purposes:

    1. They provide a safe stopping point for truckers to rest.
    2. They act as staging areas for drivers making scheduled deliveries.

About 31,000 truck parking spaces are provided by the public sector, with an estimated additional
167,000 to 284,000 held by the private sector (4) to support the 3.63 million class 8 trucks in operation
today (5).

Trucker Experiences and Perceptions
In the United States as a whole, demand for truck parking exceeds supply, with acute parking shortages
in certain areas. For example, highways with an Average Annual Daily Truck Traffic (AADTT) count
greater than 1,000 have about 31,000 spots total, but there is demand for 287,000 spots on an average
night, and, according to an evaluation of the Interstate America database of commercial truck stops and
a survey of public rest areas in 1999 and 2000, respectively, 90% of truckers have experienced difficulty
finding parking (4). In the Midwest, the focus region for this paper, 76% of drivers have reported
difficulty finding parking on 30% or more of their trips (6). Parking shortages are often associated with
urban areas, which typically have greater concentrations of industry.

In an American Transportation Research Institute (ATRI) survey conducted in March of 2015, these
carrier results were reconfirmed. It found that private truck stops are used for 56% of parking and public
rest stops are used for 44% of parking (7). Perceived difficulty of finding parking at these locations
continued to be an issue. The ability to find parking was rated equally difficult for both public and private
locations by 62.1% of drivers; 23.7% of respondents said private truck stops were more difficult and
14.2% of respondents stated that public rest stops were more difficult.

ATRI posed a scenario where drivers could pay to reserve a parking spot. This question, which gauged
driver willingness to pay, found that 48.2% of drivers would not be willing to pay for parking, 20% would
pay $1 to $5, and 19.8% would pay $6 to $10. In a subsequent question, 46.8% of drivers indicated that
the carrier should pay a parking reservation fee.

As freight tonnages increase, parking shortages, and their related public safety and infrastructure
problems, are likely to worsen. When truckers cannot easily find parking, they may engage in unsafe
parking practices, each of which has its own problems. Parking on highway ramps is common. This
practice is unsafe because it creates a collision risk for other motorists and it damages roadway
shoulders not designed to support the weight of a parked truck. Drivers may also find parking in

Identification of Urban Truck Parking Locations in the MAASTO Region                                       1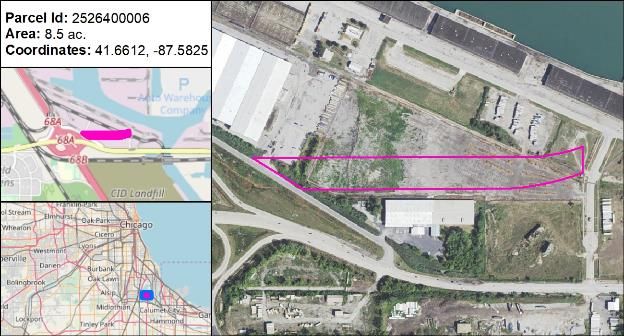
unsecured vacant lots like malls or abandoned gas stations. This exposes them to assault, robbery, and
other crime. Finally, truckers unable to find parking may continue driving beyond their legal maximum
hours of service (HOS), which means they are more likely to be fatigued and at risk of the dangers of
drowsy driving (8). Regardless of payment for parking, a majority of drivers of all types (local, regional,
inter-regional, and long-haul) would prefer to reserve parking in major metropolitan areas over rural or
small metropolitan areas (7). This supports the perception that truck parking is more difficult to access
in major metropolitan areas than in other rural or smaller communities, and that it plays an important
role in staging for scheduled delivery times.

There are three public policies that impact the current parking shortage. First are federal HOS
regulations, which are designed to improve highway safety by keeping fatigued drivers off the road.
HOS rules state that drivers may not drive for more than 11 hours after 10 consecutive hours off duty.
Additionally, drivers may not drive more than 8 hours without a 30-minute, off-duty or sleeper berth
break (9). These rules mean that drivers travelling greater than 7 hours from home will require some
kind of parking facilities. The second policy is Jason’s Law, a portion of the Federal MAP-21 spending bill
passed in response to the murder of a trucker parked at an abandoned gas station. Jason’s Law made
truck rest areas and parking areas available for federal highway funding (10). Finally, with increasingly
limited transportation funding, many states have sought to cut costs by closing rest areas and weigh
stations, exacerbating existing parking shortages (8). In addition to these policy decisions, proposals for
new truck parking locations are often challenged or canceled due to public concerns about safety or
pollution (11, 12).

Market phenomena also have an effect on parking demand. The forecasted 44% future growth in truck
tonnages will result in more trucks and increased demand for parking spots, worsening current
shortages (1). The rise of just-in-time inventories and scheduled deliveries is also contributing to
shortages, as drivers often need parking near destinations to wait for appointed arrival times (8).

The problem of truck parking shortages arises from a variety of causes and has a range of negative
effects on safety and infrastructure. However, a simple fact remains: in many areas there are not enough
parking spaces. To solve these shortages, some policies seek to increase the number of available parking
spots, while others seek to improve truckers’ decision making with information on parking availability.

Policy and Innovation Solutions for Truck Parking Shortages
There are three current strategies being used to address the parking shortage.

Truck Parking Information and Management System (TPIMS)
The Truck Parking Information and Management System (TPIMS) approach is designed to improve
utilization of available parking by collecting and communicating information about real-time parking
availability to drivers. In eight of the ten states in the Mid America Association of Transportation Officials
(MAASTO) region, this is accomplished through a TPIMS, which can provide truckers with information
on availability of parking at specific locations. TPIMSs show promise in “smoothing” parking demand
along corridors, where some lots may be full and others open, reducing the time drivers spend off
highway searching for spots. Additional information on the MAASTO TPIMS project can be found at:
trucksparkhere.com.

Identification of Urban Truck Parking Locations in the MAASTO Region                                        2
The trucking sector has also increased productivity with the use of social media and trucker-supplied
data. Software and mobile applications are created to serve this purpose. Mobile applications are
attractive and easy to implement because of the high number of drivers who utilize the technology. In
2013, 50% of drivers had smartphones (14). HOS monitoring and reducing operating costs can be aided
by these technologies (14). The search for truck parking is an inefficient use of a driver’s time and
increases fuel and operating costs, impacting both HOS and the financial bottom line.

Drivers are being aided in their search for truck parking by a range of free smartphone applications.
Beyond including the location of parking, these applications often include information about upcoming
parking locations and the number of available parking spots. Depending on the program, these details
are recorded by drivers logging their observations of parking areas or by parking providers reporting
their availability in the application. Beyond this, some applications also allow drivers to share
information about amenities located in and around parking areas.

These applications created both by private companies and by industry bodies have been widely adopted
to address drivers’ needs. The National Association of Truck Stop Operators (NATSO) created Park My
Truck, which provides drivers with information uploaded by parking providers (16). Trucker Path is
perhaps the most widely used application, with a user base of over 500,000 (15). Beyond parking, the
application provides information on truck stops, weigh stations, fuel prices, and has a communication
system that is integrated with Facebook Messenger.

Well established technologies are being used to help drivers find suitable parking places. Vehicle
detection methods including in-pavement sensors, video, and light and laser detection are used to
determine the number of vehicles in the lot at a given time (18). This data is submitted for central
processing and updates to variable message signs provide information to drivers without the need for
a mobile application with internet connectivity (19, 20).

Re-Opening Rest Areas and Purchasing Rights of Way
A second policy option is to increase availability of parking by re-opening closed rest areas or purchasing
additional rights of way (ROW). However, available rights of way for parking is not always coincidental
with areas of parking shortages, so opening closed locations may not have much impact on localized
shortages. Other considerations include the acquisition and site development costs of new rights of
way, as well as the availability and cost of amenities at re-purposed sites.

Collaborative Planning Approach
A third policy option to improve truck parking availability could be collaborative work between state
departments of transportation (DOTs), metropolitan planning organizations (MPOs), and local
governments to identify and readapt vacant urban sites and brownfields for truck parking. This
approach would provide additional capacity in urban areas where tightly scheduled delivery times and
congestion place further demand on available spaces. The potential use of vacant industrial properties
would require the purchase or lease of vacant paved sites of a minimum size, followed by the addition
of appropriate assets like restrooms, lighting, and fences, in locations with access to highways,
businesses, and warehouses. Vacant industrial or commercial properties with large square footages of
pavement or concrete would be ideal options. These sites are likely to be relatively low cost in terms of
both land value and infrastructure construction and are more likely to have immediate access to arterial
roads.

Identification of Urban Truck Parking Locations in the MAASTO Region                                     3
This approach is also designed to avoid residential areas, hospitals, roads with clearance issues, areas
with ordinances prohibiting truck parking, and areas with high crime rates. Collaboration between state
DOTs and MPOs is not required but is ideal because the organizations can defray the costs as well as
share in the benefits. This paper evaluates this third policy, the Collaborative Planning Approach (CPA)
as a viable alternative or addition to the traditional repurpose or purchase of ROW, and the newer
TPIMS approach.

Methodology
One urban area was evaluated in each of the ten MAFC member states to identify truck parking
opportunities. Each of these areas was nominated by the State DOT in which it resides. The selected
urban area and sources of parcel data for each state are described in Table 1.

Table 1. MAFC states, selected urban areas, and parcel data sources.
       State        Selected Area                             Parcel Data Source(s)
 Illinois         Greater Chicago       Cook County, https://www.cookcountyil.gov/CookCentral
 Indiana          Aurora                Dearborn County, Ohio-Kentucky-Indiana Regional Council
 Iowa             Des Moines            Polk county, Des Moines Area MPO
 Kansas           Wichita               Sedgwick county, Wichita Area Planning Organization
                                        Boone, Kenton Counties, Ohio-Kentucky-Indiana Regional
 Kentucky         Greater Cincinnati
                                        Council
 Michigan         Detroit               SEMCOG, Plan and Policy Development
                                        MnDOT, Anoka, Dakota, Hennepin, Ramsey, and Washington
 Minnesota        Twin Cities
                                        counties
                                        St. Louis City https://www.stlouis-mo.gov/data/parcels.cfm
 Missouri         St. Louis             St. Louis County
                                        https://data-stlcogis.opendata.arcgis.com/datasets/parcels
                                        Cuyahoga County, Cleveland and outside areas
 Ohio             Cleveland
                                        https://data-cuyahoga.opendata.arcgis.com
                                        Milwaukee County
                                        http://gis-mclio.opendata.arcgis.com
 Wisconsin        Milwaukee
                                        Waukesha County
                                        http://data-waukeshacounty.opendata.arcgis.com

The process of identifying the number of candidate parcels was automated in order to quickly screen
non-viable sites. Given that the parcel data for each urban area contained thousands of features, a series
of filter criteria were applied to reduce the number of parcels to a manageable number before
performing a visual analysis for suitability on those that remained.

The first criterium was the area of the parcel. A threshold of five acres was applied to allow for enough
space for truck parking and associated infrastructure. With the exclusion of all parcels with an area of
less than five acres, subsequent steps required less processing time.

Major freight corridors for parking evaluation were derived from the National Highway Freight Network
(NHFN) for each of the areas selected. Some routes included in the NHFN but determined to be lesser
corridors were excluded from the analysis. These included minor arterials or bypasses. The reason for

Identification of Urban Truck Parking Locations in the MAASTO Region                                    4
exclusion varied by city but given the goal of identifying locations for staging purposes, the effort was to exclude corridors that served as a bypass to the urban area rather than access to it. For subsequent steps, additional columns were added to the parcel attributes to indicate true/false conditions and contain derived values. With the selected freight corridors defined, vacant land parcels within 0.25 miles of the corridor were flagged. The 0.25-mile value was selected as the ideal truck parking location as it would be near the corridor and quickly accessible, and also visible from the corridor. This proximity also provides a psychological effect of providing drivers a visible destination before proceeding to an exit. An example of selection by proximity to the freight corridors is shown in Figure 1. Figure 1. Selection of parcels within 0.25 miles of freight corridors. Locations of ramps that permit access to local roads were identified using satellite imagery and background street maps. In addition to the ramps on the selected corridors, ramps and access points on nearby arterials were identified where a logical exit would occur. As with the corridor proximity analysis, a parcel attribute was added to indicate being within 0.25 miles of the identified ramps or access points. Example ramps and proximate parcels is shown in Figure 2. Identification of Urban Truck Parking Locations in the MAASTO Region 5
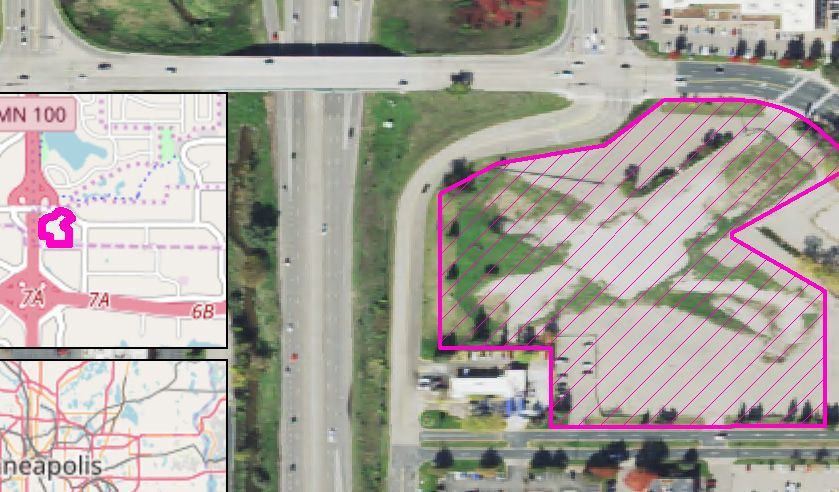
Figure 2. Selection of parcels within 0.25 miles of ramps or other access points.

A combination attribute for each parcel was generated containing an indication of if the parcel is within
0.25 miles of a corridor, an identified ramp, or both. Parcels not meeting either criteria were excluded
from subsequent steps as less than optimum solutions.

Ideal parking locations would favor proximity to city centers and areas with industrial or commercial
activity. Using satellite imagery, point locations were identified where there were apparent retail
centers, warehouses or other large buildings, or urban centers. These points are hereafter referred to
as Industrial/Commercial centers. A distance raster (image) was generated wherein the value at a given
point represents the minimum straight-line distance to any of the Industrial/Commercial points to a
maximum of two miles. Parcels were overlaid on the distance raster and assigned additional attributes
corresponding to the minimum, maximum, and average distance from any Industrial/Commercial
center. An example distance raster and overlaid parcels meeting the five-acre area criteria and being
within 0.25 miles of either a corridor or an identified access point is shown in Figure 3.

Identification of Urban Truck Parking Locations in the MAASTO Region                                   6
Figure 3. Raster/Image representation of distance from industrial/commercial areas.

Image analysis was completed using satellite imagery from the National Agriculture Imagery Program
(NAIP). The date of acquisition varied by urban area and was either 2016 or, more frequently, from
2017.

Parcels reaching this step of the analysis were evaluated using the imagery clipped to the bounds of the
parcel. The composite image was first split into its component red, green, and blue bands.

The standard deviation and average pixel values were calculated for each band as well as the average
standard deviation across all bands. The standard deviation value is useful to determine the degree of
variability within the imagery of a parcel. A parcel with a high standard deviation in the pixel values
across one or more bands typically corresponds to one that has been extensively developed with a
variety of features and is therefore unsuitable for parking purposes. Conversely, a low standard
deviation indicates a visual homogenous parcel.

The average pixel values of the bands are also useful to determine the level of development. The
average green band pixel value is not useful in isolation as a white pixel in the color image is represented
as 255 in the red, green, and blue bands. A measure of how green a parcel is, hereafter referred to as
the green score, was calculated as two times the average green pixel value minus the average red and
blue pixel values. High green scores correspond to parcels wherein the dominant color is green.
Example parcels and resulting image analysis values are shown in Figure 4.

Identification of Urban Truck Parking Locations in the MAASTO Region                                      7
Figure 4. Analysis of parcel satellite imagery.
    a. Developed parcel with heterogenous features

 Red                        Green                       Blue                       Composite
 Std Dev: 57.3              Std Dev: 54.3               Std Dev: 53.4              Average Std Dev: 54.3
 Average: 119.8             Average: 120.0              Average: 122.1             Green Score: -1.9

    b.   Homogenous, undeveloped parcel in rural area.

 Red                        Green                       Blue                       Composite
 Std Dev: 10.4              Std Dev: 8.7                Std Dev: 7.2               Average Std Dev: 8.77
 Average: 101.0             Average: 117.4              Average: 87.1              Green Score: 46.7

    c. Ideal homogenous parcel with relatively low green score (2 x avg green – avg red – avg blue)

 Red                        Green                       Blue                       Composite
 Std Dev: 27.9              Std Dev: 25.7               Std Dev: 32.7              Average Std Dev: 28.8
 Average: 184.1             Average: 186.9              Average: 177.1             Green Score: 12.6

This process is useful as a screening tool but requires visual analysis as well. For example, a parcel with
a large building roof and similarly colored parking lot will have low standard deviations in pixel values
of the various bands and low prevalence of green but would clearly still be unsuitable for truck parking.

With the original parcels filtered to only those with areas 5 acres or larger, within 0.25 miles of a corridor
or ramp/access point, and within two miles of an Industrial/Commercial center, the number of
remaining parcels still ranged from the hundreds to thousands in the largest urban areas. An additional

Identification of Urban Truck Parking Locations in the MAASTO Region                                        8
ranking metric was created to further filter the results. For each urban area, the average standard
deviation value for all bands was standardized from 0 to 1 as was the green score into respective
columns. One additional metric was calculated as the standardized average standard deviation minus
the standardized green score. In this metric, the lowest values correspond to homogenous green parcels
and the highest values typically correspond to highly developed (not green dominant) and heterogenous
parcels with little apparent green areas. By inspection, the ideal parcels tended to be clustered in the
range of 0.1 to 0.4. Eliminating the parcels outside of this range reduced the hundreds or thousands of
parcels down to a manageable number; in the tens of parcels. By stepping through the remaining parcels
and evaluating proximity data to corridors, ramps, or industrial or urban centers and viewing satellite
imagery, the best candidate locations for each urban area were identified.
Results
The results provided here a derived from attributes common to datasets in all urban areas or those that
could be derived from geometries. By first eliminating parcels smaller than 5 acres in size, proximity and
imagery analysis was applied to determine ideal truck parking candidate locations. The result was from
four to twelve candidate sites where the optimal site would be within 0.25 miles of an exit point on a
freight corridor, at a reasonably small distance from identified Industrial/Commercial centers, and be
either vacant, abandoned, or minimally developed.
Table 5. Candidate Parcel Results
State Count Summary
Illinois 10 Several minimally developed or abandoned areas identified. Other
existing paved lots with unused capacity. Potential for landowner
agreements.
Indiana 5 Suitable parcels found on north and west sides of urban area. Other
developed parking areas with unused capacity.
Iowa 6 One ideal parcel found north east of urban area. Other parcels are
suboptimal. Developed with unused areas that may be suitable for
parking. Two undeveloped, greenfield parcels in northwest.
Kansas 7 No abandoned or vacant sites identified. All candidate sites would need
a landowner agreement or division parcels.
Kentucky 4 Ideal candidate sites identified, only one of which would require
significant additional paving.
Michigan 6 Abandoned industrial areas and existing truck parking for private or
public purposes.
Minnesota 11 Several abandoned industrial areas. Graded areas with varying paving
conditions and semi-developed parcels with unused capacity.
Missouri 9 Several ideal candidate locations. Some with good pavement conditions
and others that would require improvements.
Ohio 9 One abandoned industrial area with others requiring pavement
improvements. Candidate parcels are large relative to other urban areas.
Parcel division may be considered.
Wisconsin 5 One ideal uniform parcel but may require pavement improvement.
Other parcels that are currently used at least in part for parking. One
commuter parking location with adjacent space available for expansion.
Identification of Urban Truck Parking Locations in the MAASTO Region 9A tabular view of the parcel information including a parcel identifier, acreage, and coordinates is provided in Appendix 1. Appendix 2 shows maps of the candidate parcels organized by state/urban area. Discussion A Geographic Information System (GIS)-based analysis for identifying suitable locations for freight parking in and around urban areas proved to be an efficient approach and several candidate locations were identified in each urban area. The attributes varied greatly between urban areas and in many cases even within them in areas where multiple counites or jurisdictions were involved. Some valuable attributes included current and future land use, current vacancy status, and estimated land value in one instance. While useful in individual cases, the approach was taken to apply uniform methods across all urban areas using only information available in common for each area. Supporting this decision was the presence of apparent inconsistencies in the attribute data. For example, incorrect vacancy or land use information as compared to recent satellite imagery. While the distribution date of a parcels dataset from a given source could be ascertained, some attribute fields seemed to be out of date. A common methodology was applied to keep the analysis simple and not introduce location-specific attributes of unknown quality or temporal accuracy. Additional criteria including but not limited to existence or condition of local infrastructure, security situation, soil contamination, and sale availability and land valuation are best left to those with ready access to detailed land records. It is readily apparent that some parcels are out of date due to clear delineation in development that does not match parcel boundaries. Due to this, determining a current parcel identifier where parcel boundaries have changed much less a current valuation proves difficult. Despite the value that GIS data and methods provide, there is no substitute for local knowledge of the situation. Those familiar with local freight volumes, driver preferences, and daily traffic patterns have an insight that a remote analyst cannot. Beyond this, the simple ability to visit an individual site to make a current on the ground assessment is invaluable and cannot be replaced by any remote visual representation of the site. Additionally, some candidate sites were identified wherein the parcel appears to be a parking facility. In other cases, a portion of the parcel has one or more structures while a considerable remaining portion is undeveloped or has limited utilization. For these areas, sale or rental agreements may be suitable but it would depend on landowner interaction. Candidate parcels were identified in two steps. A subset of parcels was identified by selection criterion based on area, proximity, and image analysis. Satellite imagery of parcels meeting these criteria were evaluated visually to make the final candidate selection. The next step in the process of identifying the ideal location(s) would be an evaluation by personnel with access to property and infrastructure information and an invaluable ground truth assessment. Identification of Urban Truck Parking Locations in the MAASTO Region 10
Conclusion
This research demonstrates that there is potential value in rehabilitating vacant urban parcels for use
as truck parking facilities and that a CPA process based on GIS screening provides an effective method
to identify potential parking areas.

One urban area was analyzed in each of the ten MAFC states. In total, 72 candidate parcels were
identified that have a minimum area of 5 acres, are within 0.25 miles of a freight corridor and/or
identified ramp or access point, are within two miles of Industrial/Commercial centers, and are vacant,
could be developed, or appear to have unused capacity that could be used for truck parking purposes.
Remaining filter criteria such as local freight volume, security, parcel sale status or valuation, or
environmental concerns could be best addressed by those with local knowledge and ability to visit the
sites in person.

These findings are especially relevant for truck parking in urban areas due to the increased need for
parking close to the city center and industry. The congestion delays impacting delivery schedules and
the increased concentration of trucks in industrial and commercial zones has rapidly become a major
urban freight issue.

A GIS-based parcel approach combined with partnership efforts, including MPOs, DOTs, and city leaders,
can support safe truck parking and reduce the incidence of unsafe parking practices and extreme
congestion.

This approach can be modified to suit the community. For example, a more focused approach could be
developed to avoid socially-sensitive areas or major highway bottlenecks. Alternatively, the screening
process could focus on parcels close to urban police stations or well-traveled areas to increase the safety
of the new facilities.

It should be noted that the problem of parking shortages extends beyond urban areas, and urban
parking solutions like the one described above must be seen as a complement to, not a replacement
for, the other policies of TPIMS, mobile applications, and opening of facilities along existing rights of
way. Full solutions to the United States’ truck parking shortage will require collaborative action between
multiple levels of the government and the private sector, and application of all of the policies described
above. This CPA action will not only help solve shortages but has the ability to lower costs of creating
truck parking by splitting costs across multiple agencies. For freight planning and operations, this CPA
approach should be considered as mitigation for freight-related urban congestion, limited truck parking,
and unsafe parking practices.

Findings and data for each of the ten locations are found in the Appendices.

Identification of Urban Truck Parking Locations in the MAASTO Region                                    11
References
1. Bureau of Transportation Statistics. DOT Releases 30 Year Freight Projections. Office of the Assistant
    Secretary for Research and Technology, United States Department of Transportation, Washington
    D.C., 2016. http://www.rita.dot.gov/bts/press_releases/ bts013_16. Accessed July 23, 2016.
2. Bureau of Labor Statistics. Heavy and Tractor-Trailer Truck Drivers. United States Department of
    Labor, Washington D.C., 2015. http://www.bls.gov/oes/current/ oes533032.htm. Accessed June 30,
    2015.
3. American Trucking Associations. Reports, Trends, and Statistics. Arlington, undated.
    http://www.trucking.org/News_and_Information_Reports_Industry_Data.aspx. Accessed July 23,
    2016.
4. Federal Highway Administration. Study of Adequacy of Commercial Truck Parking Facilities. United
    States      Department       of    Transportation,      Washington      D.C.,      2002.      http://
    www.fhwa.dot.gov/publications/research/safety/01158/3.cfm. Accessed June 29, 2015.
5. American Trucking Association. ATA American Trucking Trends 2016. Alexandria, VA: ATA, annual.
    http://www.trucking.org/article/ATA-American-Trucking-Trends-2016. Accessed February 17,
    2017.
6. Adams, Teresa, P. Srivastava, B. Wang, and L. Ogard. Low Cost Strategies for Short-Term Parking on
    Interstate Highways of the MVFC. National Center for Freight and Infrastructure Research and
    Education, Madison, 2005. http://ntl.bts.gov/ lib/31000/31100/31163/FR_MVFC04.pdf. Accessed
    July 25, 2016.
7. Boris, C. and M. Johnson. Managing Critical Truck Parking Tech Memo #1: Commercial Driver
    Perspectives       on       Truck      Parking.       2015.      http://atri-online.org/wpcontent/
    uploads/2015/09/Managing-Critical-Truck-Parking-Tech-Memo-1-FINAL- 09-2015.pdf. Accessed
    January 23, 2017.
8. Perry, E., E. Oberhart, and S. Wagner. Truck Parking Management Systems. Mid-America Freight
    Coalition, Center for Freight and Infrastructure Research and Education, Madison, 2015.
    http://midamericafreight.org/wp-content/uploads/MAFC_              TPMS_Synthesis_07012015.pdf.
    Accessed July 23, 2016.
9. Federal Motor Carrier Safety Association. Summary of Hours of Service Regulations. US Department
    of        Transportation,       Washington         D.C.,      2014.          http://www.fmcsa.dot.
    gov/regulations/hoursservice/summary-hours-service-regulations. Accessed June 30, 2015.
10. Moving Ahead for Progress in the 21st Century. U.S.C. 112-141 §1401 (2012)
11. The Herald News. Opposition not enough to stop Love's plan in Joliet. Oct 3, 2018.
    https://www.theherald-news.com/2018/10/03/opposition-not-enough-to-stop-loves-plan-in-
    joliet/a7lru37/. Accessed February 15, 2019.
12. KCCI Des Moines. Truckers upset after city rejects proposed truck stop. Nov 7, 2014.
    https://www.kcci.com/article/truckers-upset-after-city-rejects-proposed-truck-stop/6899182.
    Accessed February 15, 2019.
13. Marion, S. Electronic Communication. Missouri Department of Transportation, Jefferson City, 2016.
14. Couglan, J. Convergence: Mobility in Trucking is Now Anywhere, Anytime, Anyone. XRS Corporation.
    2013.                http://images.engage.xrscorp.com/Web/XRSCorporation/%7B50e37cc1-9fb4-
    44558ef1485477e05970%7D_xrs_ corporation_issue_1_071513.pdf. Accessed January 24, 2017.
15. Trucker Path Inc. Trucker Path. https://truckerpath.com/trucker-path-app/. Accessed January 24,
    2017.

Identification of Urban Truck Parking Locations in the MAASTO Region                                  12
16. NATSO. Park My Truck Mobile App. http://www.natso.com/parkmytruck. Accessed January 24,
2017.
17. Lomax, T., D. Schrank, and B. Eisele. Urban Mobility Information: Congestion Data for Your City.
Texas A&M Transportation Institute. 2015. https://mobility.tamu.edu/ums/congestion-data/.
Accessed January 30, 2017.
18. Mid-America Freight Coalition (MAFC). MAFC TPMS Synthesis. July 12, 2015.
http://midamericafreight.org/wp-
content/uploads/2018/10/MAFC_TPMS_Synthesis_07012015.pdf. Accessed Feb 15, 2019.
19. TrucksParkHere.com. https://trucksparkhere.com/ Accessed February 15, 2019.
20. Federal Highway Administration. National Coalition on Truck Parking, Activity Report 2015-2016.
https://ops.fhwa.dot.gov/publications/fhwahop17026/fhwahop17026.pdf. Accessed February 15,
2019.
Identification of Urban Truck Parking Locations in the MAASTO Region 13Appendix 1. Candidate Parcel Table
State Parcel IDs from Area (ac.) Latitude Longitude
sources in Table 1
1927100005 14.4 41.7630 -87.7397
2929409013 6.1 41.5731 -87.6377
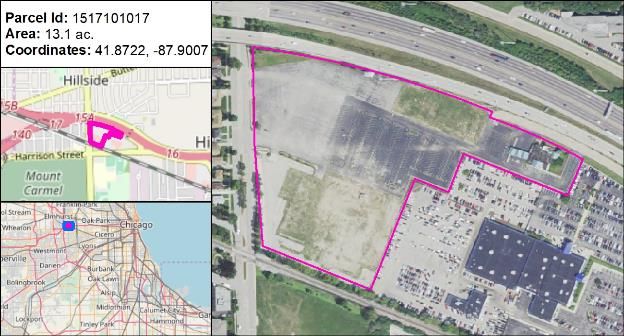
1517101017 13.1 41.8722 -87.9007
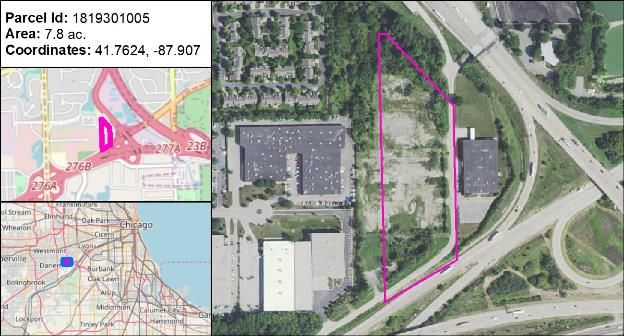
1819301005 7.8 41.7624 -87.9070
2526400006 8.5 41.6612 -87.5825
Illinois
1812200022 9.2 41.8028 -87.8047
1827100001 8.8 41.7608 -87.8566
1822304009 8.2 41.7623 -87.8557
1231301019 10.4 41.9080 -87.9174
1905400014 6.2 41.8079 -87.7673
150702100020000016 9.0 39.1294 -84.8420
150715301016000013 5.5 39.0926 -84.8693
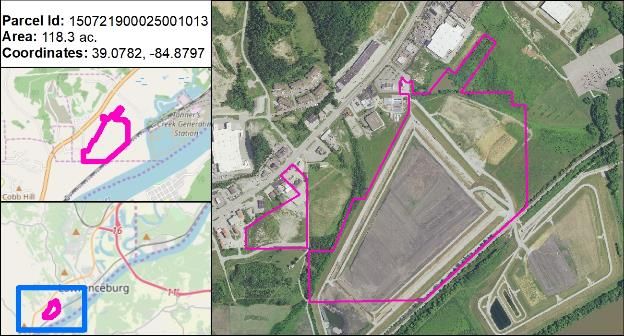
Indiana 150721301007000013 10.8 39.0774 -84.8864
150711200008000016 48.5 39.1145 -84.8546
150721900025001013 118.3 39.0782 -84.8797
792207100019 20.3 41.6705 -93.4625
792413302008 8.0 41.6483 -93.5968
792520400037 20.0 41.6310 -93.7801
Iowa
792515302003 16.7 41.6500 -93.7533
792520200029 6.1 41.6431 -93.7823
792311351004 13.3 41.6602 -93.4995
00499470 13.3 37.6307 -97.3915
00099484 5.7 37.6217 -97.3353
00499498 6.7 37.6283 -97.3910
Kansas 00133437 6.2 37.6106 -97.3282
00167734 31.0 37.6413 -97.3038
00542150 12.4 37.6269 -97.3315
30004993 8.1 37.7942 -97.3307
062.00-47-003.00 17.2 38.9863 -84.6473
078.00-00-007.02 6.4 38.8551 -84.6283
Kentucky
041-20-01-001.00 5.1 39.0610 -84.5373
058.00-00-031.03 13.7 39.0758 -84.6529
22022 5.5 44.7558 -93.2521
20371 12.5 42.3911 -83.0686
1256287 5.4 42.3899 -83.0642
Michigan
580299 14.3 42.4891 -82.9763
583223 5.3 42.2980 -83.1796
371041 13.2 42.3201 -83.1506
Identification of Urban Truck Parking Locations in the MAASTO Region 14State Parcel IDs from Area (ac.) Latitude Longitude
sources in Table 1
123-042923330032 5.1 45.0234 -93.1838
123-042923340036 5.3 45.0235 -93.1820
053-2202924230104 6.7 44.9875 -93.2863
163-3602921340008 20.7 44.9512 -93.8764
053-1002924210002 7.2 45.0193 -93.2791
Minnesota 053-1711621210004 7.1 44.8612 -93.3711
163-0502821330009 6.7 44.9357 -92.9628
053-3102824330010 8.1 44.8630 -93.3481
053-0302724210027 6.5 44.8604 -93.2796
037-022092001010 5.4 44.7558 -93.2521
037-020330075011 9.7 44.7823 -93.2921
20K531405 5.6 38.6320 -90.3475
27Q630422 5.2 38.5376 -90.4994
09K120149 6.9 38.7752 -90.3525
OL0401006 7.9 38.7743 -90.3544
Missouri 10G440310 5.4 38.7698 -90.2738
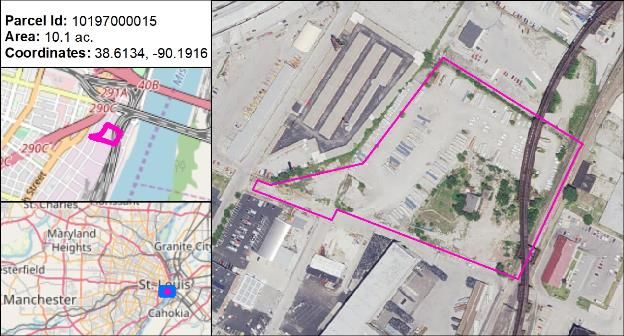
10197000015 10.1 38.3134 -90.1916
09K140466 17.7 38.7762 -91.3545
20K427160 5.9 38.6301 -90.3519
12L540043 5.2 38.7414 -90.6399
44102001 16.6 41.4141 -81.7826
34219005 92.1 41.4108 -81.8252
54214002 52.0 41.4138 -81.6204
54303002 5.2 41.4070 -81.6154
Ohio 48326002 5.2 41.3117 -87.7588
48311007 7.2 41.3171 -81.7733
23612004 6.1 41.4117 -81.9006
43110001 5.4 41.4503 -81.7533
43108006 18.9 41.4446 -81.7573
3980906111 10.3 43.0334 -87.9356
MNFV0008989 5.9 43.1787 -88.0848
Wisconsin 1800372000 6.1 43.1221 -88.0531
4161301112 8.9 43.0301 -88.0362
6249994200 5.3 42.9584 -87.9324
Identification of Urban Truck Parking Locations in the MAASTO Region 15Appendix 2. Candidate Parcel Maps Illinois Identification of Urban Truck Parking Locations in the MAASTO Region 16
Identification of Urban Truck Parking Locations in the MAASTO Region 17
Identification of Urban Truck Parking Locations in the MAASTO Region 18
Identification of Urban Truck Parking Locations in the MAASTO Region 19
Identification of Urban Truck Parking Locations in the MAASTO Region 20
Indiana

Identification of Urban Truck Parking Locations in the MAASTO Region   21
Identification of Urban Truck Parking Locations in the MAASTO Region 22
Identification of Urban Truck Parking Locations in the MAASTO Region 23
Iowa

Identification of Urban Truck Parking Locations in the MAASTO Region   24
Identification of Urban Truck Parking Locations in the MAASTO Region 25
Identification of Urban Truck Parking Locations in the MAASTO Region 26
Kansas

Identification of Urban Truck Parking Locations in the MAASTO Region   27
Identification of Urban Truck Parking Locations in the MAASTO Region 28
Identification of Urban Truck Parking Locations in the MAASTO Region 29
Identification of Urban Truck Parking Locations in the MAASTO Region 30
Kentucky

Identification of Urban Truck Parking Locations in the MAASTO Region   31
Identification of Urban Truck Parking Locations in the MAASTO Region 32
Michigan

Identification of Urban Truck Parking Locations in the MAASTO Region   33
Identification of Urban Truck Parking Locations in the MAASTO Region 34
Identification of Urban Truck Parking Locations in the MAASTO Region 35
Minnesota

Identification of Urban Truck Parking Locations in the MAASTO Region   36
Identification of Urban Truck Parking Locations in the MAASTO Region 37
Identification of Urban Truck Parking Locations in the MAASTO Region 38
Identification of Urban Truck Parking Locations in the MAASTO Region 39
Identification of Urban Truck Parking Locations in the MAASTO Region 40
Identification of Urban Truck Parking Locations in the MAASTO Region 41
Missouri

Identification of Urban Truck Parking Locations in the MAASTO Region   42
Identification of Urban Truck Parking Locations in the MAASTO Region 43
Identification of Urban Truck Parking Locations in the MAASTO Region 44
Identification of Urban Truck Parking Locations in the MAASTO Region 45
Identification of Urban Truck Parking Locations in the MAASTO Region 46
Ohio

Identification of Urban Truck Parking Locations in the MAASTO Region   47
Identification of Urban Truck Parking Locations in the MAASTO Region 48
Identification of Urban Truck Parking Locations in the MAASTO Region 49
Identification of Urban Truck Parking Locations in the MAASTO Region 50
Identification of Urban Truck Parking Locations in the MAASTO Region 51
Wisconsin

Identification of Urban Truck Parking Locations in the MAASTO Region   52
Identification of Urban Truck Parking Locations in the MAASTO Region 53
Identification of Urban Truck Parking Locations in the MAASTO Region 54
www.midamericafreight.org

          Mid-America Freight Coalition
      Ernest Perry, PhD, Program Manager
        University of Wisconsin–Madison
             College of Engineering
Department of Civil and Environmental Engineering
        1415 Engineering Drive, 2205 EH
               Madison, WI 53706
               ebperry@wisc.edu
                 (608) 890-2310
You can also read


