CONFERENCE ON MAPPING POVERTY: NATIONAL, REGIONAL AND COUNTY PATTERNS - THURSDAY 8th SEPTEMBER 2005
←
→
Page content transcription
If your browser does not render page correctly, please read the page content below
RESEARCH

            CONFERENCE ON MAPPING POVERTY:
            NATIONAL, REGIONAL AND COUNTY PATTERNS

           THURSDAY 8th SEPTEMBER 2005
           JOHN HUME BUILDING,
           NATIONAL UNIVERSITY OF IRELAND, MAYNOOTH
Conference Programme

Session 1   Chaired by Office for Social Inclusion, Department of Social & Family Affairs
09.40       Opening & Introductory remarks
            Prof John Hughes, President, National University of Ireland, Maynooth
            Ms Helen Johnston, Director, Combat Poverty Agency
10.00       Mapping Poverty: National, Regional and County Patterns
            Ms Dorothy Watson, Mr Christopher T. Whelan, Mr James Williams and Ms Sylvia
            Blackwell, Economic and Social Research Institute
11.10       Tea/coffee
Session 2   Chaired by Prof Rob Kitchin, Director,
            National Institute for Regional and Spatial Analysis
11.30       Other perspectives on the spatial distribution of poverty
            Dr Caroline Paskell, CASE: Centre for Analysis of Social Exclusion, UK
            Mr Trutz Haase, Independent Social & Economic Consultant
12.45       Lunch (served in Pugin Hall, South Campus, NUI Maynooth)

Session 3
14.00       Workshops on the Spatial Dimension of Poverty
            ■ Measures of Spatial Deprivation in Northern Ireland: Mr Robert Beatty and
              Dr David Marshall, Northern Ireland Statistics & Research Agency
            ■ Poor Neighbourhoods: Dr Mary Corcoran, Department of Sociology, NUI
              Maynooth and Dr Brendan Bartley, Department of Geography, NUI Maynooth
            ■ Small Area Statistics: Irish Spatial Infrastructure Initiative: Dr Ronan Foley,
              Department of Geography & National Centre for Geocomputation, NUI
              Maynooth
15.20       Tea/coffee

Session 4   Chaired by Ms Helen Johnston, Director, Combat Poverty Agency
15.40       Policy Implications of the Research
            Mr Jim Walsh, Combat Poverty Agency
            Panel:
            ■ Dr Rory O’Donnell, National Economic and Social Council
            ■ Dr Tony Crooks, Area Development Management Ltd.
            ■ Mr Patrick Ledwidge, Cork City Development Board, Cork City Council
            ■ Ms Anna Lee, Tallaght Partnership

16.45       Conclusion & Close of Conference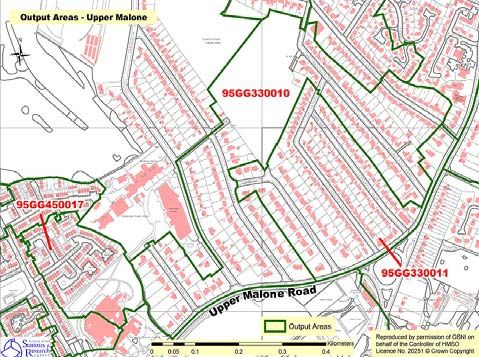
Introduction
                      Poverty and Deprivation                                                           • Neighbourhood effects
                      by Tenure and Area Type                                                           • Indirect approach through combining
                                                                                                          information on tenure and area type
                              Dorothy Watson, Chris Whelan                                              • Interpreting effects
                           James Williams and Sylvia Blackwell                                          • Contextual effects – vicious circle processes
                                                                                                        • Alternative of self selection

            Disparities in Income Poverty and Consistent                                                 Disparities in Income Poverty and Consistent
                                       Poverty by Tenure                                                                     Poverty by Area Type
                                                                                                                            -2   -1.5   -1   -0.5    0   0.5   1    1.5
                                  -2   -1.5   -1   -0.5   0   0.5   1   1.5
                                                                                                           Open country
           Own outright, LATP
                                                                                                            Town
Comparing the Risk of Poverty by Tenure                                         Comparing the Risk of Consistent Poverty by
                    Type at 60% income Line                                                            Tenure and Area Type
                             0    5   10    15   20   25    30   35   40                                         0   5 10 15 20 25 30 35 40 45

        Private Purchasers                                                                 Private Purchasers

               LA Owners                                                                           LA Owners
                                                                             Urban Gross                                                                       Urban Gross
           Private Owners                                                                     Private Owners
                                                                             Rural Gross                                                                       Rural Gross
            LA Purchasers                                                    Urban Net                                                                         Urban Net
                                                                                               LA Purchasers
                                                                             Rural Net                                                                         Rural Net
                LA Tenant                                                                           LA Tenant

            Private Tenant                                                                     Private Tenant

        Source: National Survey of Housing Quality 2001-2002.                              Source: National Survey of Housing Quality 2001-2002.
        Odds Ratio of Poverty level to reference group (urban private purchasers).         Odds Ratio of Poverty level to reference group (urban private purchasers).

                        Summary and Conclusions (1 of 2)
                                                                                                     Summary and Conclusions (2 of 2)
          • Additional effects remain for tenure.
          • Interpreting net “neighbourhood effects”
                                                                                             • Such effects are largely accounted for by the socio-
          • Note that more recent spatial interventions have relied on
                                                                                               demographic composition of public sector tenants.
            more complex justifications that have encompassed factors
            such as improved service delivery, ‘place’ rather than
            people poverty and mobilisation of community in                                  • Poverty remains a spatially diffuse phenomenon
            resources in the service of a broader conception of quality
            of life.                                                                         • Policies to tackle poverty must continue to prioritise
          • Tenure differences are both more marked and more                                   structural causes but a variety of justifications remain for a
            pervasive than their spatial counterparts.                                         stronger focus on ‘place’ or neighbourhood poverty.

Combat Poverty Agency/NIRSA - Mapping Poverty Conference - 8 September 2005                                                                                                  2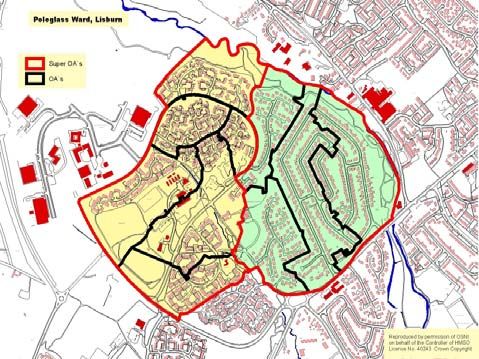
Parameters of discussion
                                                                         • “UK”
          Spatial distribution of poverty                                  – Northern Ireland and Scotland in brief
                                                                           – Focus on England & Wales (Census, Study)
                    in the UK
                     Dr Caroline Paskell                                 • Poverty
                                                                           – Work-poverty
           Centre for Analysis of Social Exclusion                         – Breadline Britain relative poverty measure
                           L.S.E.                                          – Social exclusion

                                                                         • Changing patterns

                     Core of discussion                                           The UK distribution (i)
        • Dynamics of Low-Income Areas Study                               – Poverty across the whole population
                                                                             • Total
          – 12 areas (11 in England, 1 in Wales)
                                                                             • Working-poverty
          – All within 3% ‘poorest’ electoral wards in 1991
                                                                           – Poverty by age
          – Otherwise very varied:                                           • Adults
             •   Heritage                                                    • Children
             •   Geography                                                   • Elderly
             •   Demography
                                                                           – Poverty by ethnicity
             •   Infrastructure
                                                                             • White European
             •   Wider context
                                                                             • Non-White
          – Local conditions and varied trajectories

          UK distribution of poverty by local authority,                  Percentage of work-poor in wards with various
               2001 Census + Breadline Britain                           levels of work-poverty, by region, 2001 Census
                          Dorling and Thomas, 2004: 14
                                                                                          Lupton, 2005: Figure 1
                         poor 2001 %                     poor change %
                              13 - 16                          -6 - -4
                              17 - 18                          -3 - -1
                              19 - 21                          0
                              22 - 24                          1-2
                              25 - 27                          3
                              28 - 31                          4
                              32 - 34                          5
                              35 - 37                          6
                              38 - 40                          7-8
                              41 - 47                          9 - 13

Combat Poverty Agency/NIRSA - Mapping Poverty Conference - 8 September 2005                                               1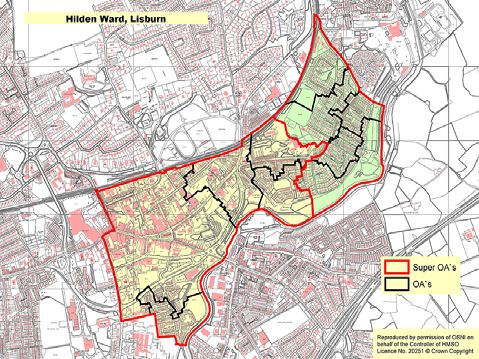
Proportions of ethnic minorities in wards with
                   The UK distribution (i)                            40% work-poverty, by region, 2001 Census
                                                                                      Lupton, 2005: Figure 2
            – Poverty across the whole population
                • Total
                • Working-poverty
            – Poverty by age
                • Adults
                • Children
                • Elderly
            – Poverty by ethnicity
                • White European
                • Non-White

                   The UK distribution (ii)                           Key changes during the 1990s
                                                                     • Rates of work-poverty fell across England
        •   National picture                                         • Some economic gains were more rapid in
                                                                       the poverty-wards than in England overall
        •   Regional variations
                                                                     • Many 1991 clusters of work-poverty wards
        •   Urban/rural patterns
                                                                       became smaller and more diffuse by 2001
        •   Local authorities
                                                                     • All English regions lost high-poverty wards
        •   Neighbourhoods
                                                                     • BUT London, South East and South West
                                                                       lost greatest proportion (85% v. 44% o’all)

            UK distribution of poverty by electoral ward,
             1991 / 2001 Census + Breadline Britain                   Local conditions in poverty areas
             1991 (Glennerster et al., 1999)   2001 (Lupton, 2005)
                                                                     • What does it mean if an area is ‘poor’?
                                                                     • Unemployment and low-wages are part
                                                                     • But the spatial distribution of poverty is
                                                                       also about the clustering of other factors:
                                                                       – Quality of natural and built environments
                                                                       – Housing conditions
                                                                       – Access to services
                                                                       – Exposure to risks
                                                                     • Our 12 Areas Study tracks these over time

Combat Poverty Agency/NIRSA - Mapping Poverty Conference - 8 September 2005                                            2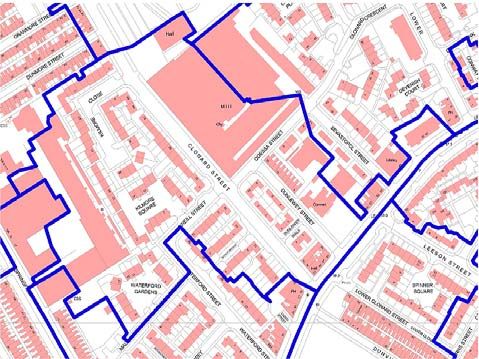
12 representative areas
                                                                   • Regional distribution
                                                                   • Inner-city/outer-city &
                                                                     city-edge/beyond-city
                                                                   • Local environment
                                                                   • Local infrastructure
                                                                   • Industrial heritage
                                                                   • Demography
                                                                   • Regeneration efforts

                    Housing: Varied ages & styles
                      Area               Housing types
                      Hackney      1950s/1960s   flats
                      Newham       1950s/1960s   houses & flats
       Inner-city     Nottingham   1970s         flats & houses
                                   pre-WW1       terraced houses
                      Sheffield    1970s         flats & houses
                                   pre-WW1       terraced houses
                      Birmingham   1950s/1960s   houses & flats
                                   pre-WW1       terraced houses
                      Knowsley     Inter-war     houses
       Outer-city &   Newcastle    Inter-war     houses
       City-edge      Leeds        Inter-war     houses
                      Redcar       Inter-war     houses
                      Blackburn    1970s         flats & houses
       Beyond-city                 pre-WW1       terraced houses
       & Towns        Caerphilly   1970s         flats & houses
                                   pre-WW1       terraced houses
                      Thanet       1960s/1970s   flats
                                   Pre-WW1       terraced houses
                                   Victorian     houses

Combat Poverty Agency/NIRSA - Mapping Poverty Conference - 8 September 2005                         3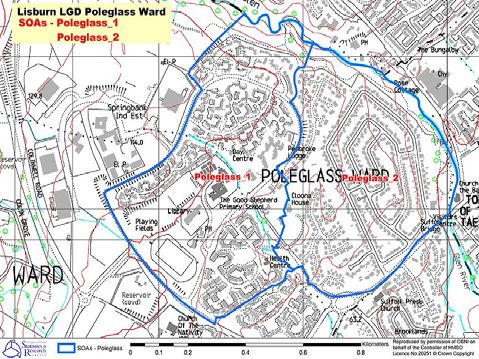
Tenure: Shifting to private
Area % social % private % owner
rented rented occupied
’91 ‘01 ’91 ‘01 ’91 ‘01
Hackney 74 61 8 12 17 24
Newham 68 51 7 13 25 32
Nottingham 52 61 15 11 33 24
Sheffield 52 42 7 11 40 44
Birmingham 55 34 8 14 35 46
Knowsley 57 52 4 5 37 38
Newcastle 61 55 5 5 33 38
Leeds 70 60 1 4 28 33
Redcar 45 41 3 5 51 52
Blackburn 53 36 9 6 38 53
Caerphilly 38 31 8 5 54 62
Thanet 18 17 24 20 58 58
English regeneration programmes Welsh regeneration programmes
1969-1997 1969-1997
Programme Start Local authorities (★) Study areas (☆) Programme Start Local authorities (★) Study areas (☆)
Newham
Newham
Hackney
Knowsley
Nottingham
Newcastle
Sheffield
Blackburn
Birmingham
Caerphilly
Redcar
Leeds
Thanet
Hackney
Knowsley
Nottingham
Newcastle
Sheffield
Blackburn
Birmingham
Caerphilly
Redcar
Leeds
Thanet
TOTAL
TOTAL
Community 1969 ★ ★ 2 PEP 1983 ★☆ 1
Dev. Projects ☆ 1 1
Strategic Dev. 1994 ★☆ 1
Urban 1978 ★ ★ ★ ★☆ ★ ★ ★ ★ ★☆ ★ 10
Scheme 1
Programme ☆ 3
Capital Challenge 1997 ★☆ 1
UDCs 1980 ★ ★ ★☆ ★ ★ ★ 6 0
1
L.A. Rural 1994 0
PEP 1979 ★ ★ ★ ★ ★ ★☆ ★ ★ 7
1 Scheme
☆
Programme for 1988 ★☆ 1
Estate Action 1985 ★ ★ ★☆ ★ ★☆ ★ ★ ★ ★ ★ ★ 11
the Valleys 1
☆ 3
Inner City 1986 ★ ★ ★ 3 Local Regen. 1999 0
0 Fund
Task Forces
People in 1998 ★☆ 1
City Challenge 1991 ★ ★ ★☆ ★ ★ ★ 6
Communities 1
☆ 2
★ ★ ★☆ ★☆ ★ ★☆ ★☆ ★☆ ★☆ ★ ★ 11 Urban Invest. 1989 0
SRB 1994
☆ ☆ ☆ 9 Grant
Local authorities (★) Study areas (☆)
Programme Start TOTAL
H N K N N S B B C R L T
EU major regeneration programmes
★ ★ ★
1990s+ New Deal for Communities 1998
☆
★
☆
★ ★
☆
★
7
3
★ ★ ★ ★ ★ ★ ★ ★ ★ ★ 10
Neighbourhood Renewal Fund 2001
☆ ☆ ☆ ☆ ☆ ☆ ☆ ☆ ☆ ☆ 10
Local authorities (★) Study areas (☆)
Neighbourhood Management 1
2000 ★
Hackney
Newcastle
Sheffield
Blackburn
Birmingham
Caerphilly
Redcar
Leeds
Newham
Knowsley
Nottingham
Thanet
Pathfinders 0
TOTAL
Programme Start E
Housing Market ★ ★ 4
2002 ★ ★
Renewal Pathfinders ☆ ☆ 2
Arm’s Length Management ★ 1
★ ★ 2 Organisations
2002
☆ 1
Objective 1 1994
0
Housing Private Finance ★ 1
1998
5 Initiative ☆ 1
★ ★ ★ ★ ★
Objective 2 1994
☆ ☆ 2 ★
W Communities First 2001
☆
1
1
★ ★ ★ ★ ★ ★ ★ ★ 8
Urban 1994 ★ ★ ★ ★ ★ ★
☆ 1 Choice-Based Lettings 2001
6
☆ ☆ ☆ ☆ ☆ ☆ 6
E
★ ★ ★ ★ ★ ★
& Neighbourhood Wardens 2000
☆ ☆
★ ★ ★
☆ ☆
★
☆ ☆
★
11
6
W Decent Homes / Welsh 2000/ ★ ★ ★ ★ ★ ★ ★ ★ ★ ★ ★ ★ 12
Housing Quality Standard 2001 ☆ ☆ ☆ ☆ ☆ ☆ ☆ ☆ ☆ ☆ ☆ ☆ 12
TOTAL Local authorities (★) 4 6 4 4 6 6 5 5 4 3 5 2 54
Study areas (☆) 4 5 3 2 3 6 4 3 3 3 5 1 42
Combat Poverty Agency/NIRSA - Mapping Poverty Conference - 8 September 2005 4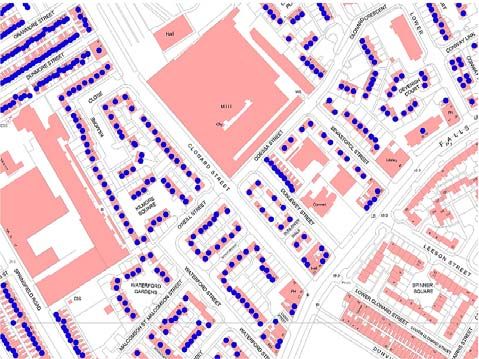
“The future’s getting better…”
        • Stronger city and regional economies have
          enhanced local employment opportunities
        • Emp uptake boosted by gov.support for in-
          work income, adult education & child-care
        • Local, central and European government
          funds have catalysed local developments
        • Neighbourhood and housing management
          strategies have added value to local areas
        • Additional baseline services have brought
          greater sense of security and of aspiration

                                                           Wait until the dust settles…
                                                        • Combination of stronger economic context
                                                          + government strategies to support areas
                                                          and individuals have improved local quality
                                                          of life and local expectations for the future
                                                        • BUT whilst 12 areas are improving overall,
                                                          their individual trajectories are diverging…
                                                        • House-building and upgrading of social
                                                          housing can obscure population declines;
                                                          in some areas these catalyse demand but
                                                          in others the prospects are much bleaker

Combat Poverty Agency/NIRSA - Mapping Poverty Conference - 8 September 2005                               5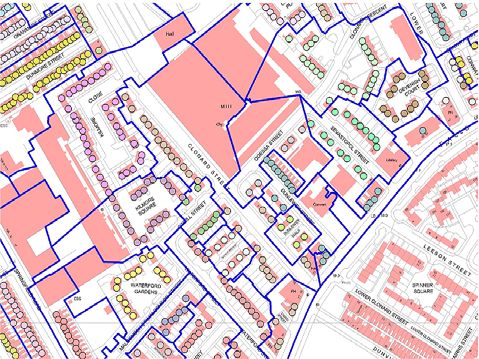
Combat Poverty Agency/NIRSA - Mapping Poverty Conference - 8 September 2005 6
Conference on Mapping Poverty
National University of Ireland, Maynooth, 8 September 2005
Structure
Structure of
ofPresentation
Presentation
2005
1. The purpose of deprivation indices
Deprivation
Deprivation and
and its
its Spatial
Spatial Articulation
Articulation
in
in the Republic of
the Republic of Ireland
Ireland 2. Methodological considerations in the construction of deprivation
indices
New
New Measures
Measuresof
ofDeprivation
Deprivationbased
basedon
onthe
the
Census
Censusof
ofPopulation,
Population,1991,
1991,1996
1996and
and2002
2002 3. The new deprivation index for the Republic of Ireland
4. Conclusions and the way forward
Trutz
Trutz Haase
Haase
The
ThePurpose
Purposeof
ofDeprivation
DeprivationIndices
Indices Taking
TakingSpace
SpaceSeriously
Seriously
1. To provide insights into the underlying structural dimensions of ‘Counting the poor’ is not the purpose of deprivation indices
affluence and deprivation – or factors that influence the
reproduction of spatial inequalities
Deprivation at the aggregate level is more than merely the sum of
individually- experienced poverty
2. To provide a basis for consensus on Targeting Social Need (TSN)
e.g. unemployment in rural areas
Stakeholders, users and general public must be ‘on board’ to develop
the political climate in which inequalities can be addressed e.g. educational outcomes in deprived urban areas
3. To facilitate inter-temporal comparison – for monitoring and A spatial deprivation index should identify the underlying causal
evaluation purposes structures and processes, facilitating area-based interventions
as a complement to individual-level entitlements/benefits.
Example:
Example:Neighbourhood
NeighbourhoodEffects
Effectsin
inEducation
Education(1)
(1) Example:
Example:Neighbourhood
NeighbourhoodEffects
Effectsin
inEducation
Education(2)
(2)
School effects on Junior Cert Performance: School effects on Early-School-Leaving:
“The social class mix within a school has a significant impact on “The social class mix of a school has a significant impact on
pupil performance. Pupils in predominantly middle-class schools Leaving Cert Grades. Those in predominantly working-class
tend to have higher exam scors than those in predominantly schools tend to make less progress over the senior cycle,
working-class schools, even when their own social background relative to their performance at Junior Cert level. Pupil
is taken into account.” background, prior performance and social context explain a very
high proportion (84%) of the difference between schools in
Emer Smith (1999) Do Schools Differ? ESRI, page 49
average Leaving Cert performance. Significant differences
remain between schools, however …. [which] may represent a
substantive difference for pupils, for example, in access to
higher education and/or employment.”
Emer Smith (1999) Do Schools Differ? ESRI, page 70
Combat Poverty Agency/NIRSA - Mapping Poverty Conference - 8 September 2005 1Example:
Example:Neighbourhood
NeighbourhoodEffects
Effectsin
inEducation
Education(3)
(3) Taking
TakingSpace
SpaceSeriously
Seriously
To adequately assess the effect of space (or neighbourhoods) on
School effects on Early-School-Leaving: poverty requires appropriate sampling strategies and multilevel
“The social class context of a school has a significant impact on modelling techniques.
potential drop-out, with higher rates reported in predominantly
working-class schools. Individual social class background is no
longer significant in this model, indicating that the effects of To date, only two studies have been undertaken in Ireland which
parental class on potential drop-out are mediated through the utilise multilevel modelling:
social class context of the school.” Emer Smith (1999) Do Schools Differ? ESRI
Emer Smith (1999) Do Schools Differ? ESRI, page 95 (emphasis added) Trutz Haase & Jonathan Pratschke (2003) Digital Divide –
Analysis of the Uptake of Information Technology in the
Dublin Region, Dublin: Dublin Employment Pact
Both studies identified significant independent effects of space
on social outcomes closely associated with social disadvantage.
Taking
TakingSpace
SpaceSeriously
Seriously The
TheUnderlying
UnderlyingDimensions
Dimensionsof
ofSocial
SocialDisadvantage
Disadvantage
“We now turn to the puzzling issue mentioned earlier – the inability of statistical analysis
to show any consistent relationship between neighbourhood quality and various
indicators of well-being of households in urban areas. …If the poor who live in socially
Demographic Decline
mixed neighbourhoods do no better than those who are concentrated together in population loss and the social and demographic effects of
disadvantaged neighbourhoods, why be worried about the spatial concentration of
poverty in cities? prolonged population loss (age dependency, low education
of adult population)
Despite the statistical results, researchers have been slow to draw conclusions along
these lines. One reason is the rather crude nature of the data so far available and the
hesitancy researchers would feel in asserting that those data adequately capture the full Social Class Deprivation
complexity of neighbourhood characteristics and their effects on well-being. Another is
that there are too many neighbourhoods in real life where the environment is so social class composition, education, housing comfort
unpleasant that it would seem impossible for it not to have a negative impact on
residents’ lives. Popular views about the unpleasantness of live in such places may
contain a large element of prejudice and unjustified fear, but academic research clearly
shows that instances of serious neighbourhood deprivation are real and clearly felt by
residents to have a damaging effect on their lives.”
Labour Market Deprivation
unemployment, lone parents, low skills base
Brian Nolan et. al. (2000) Bust to Boom? ESRI, page 236.
Combat Poverty Agency/NIRSA - Mapping Poverty Conference - 8 September 2005 2Measures of spatial deprivation in 1.Introduction & Background
Northern Ireland – NIMDM 2005
2.Geography
Robert Beatty
David Marshall (NISRA) 3.Latest NI Research – NIMDM
2005
“Mapping Poverty…”
University of Ireland, Maynooth
8 September 2005
4.Demonstration of dissemination
methods
Mapping Poverty: National
Background and History (NI)
Regional and County Patterns
(RoI) • Periodic reviews of NI deprivation
• Two broad approaches reported measures
• Purely spatial patterns (Census) • First such analyses in 1970s
• Followed Censuses of 1971, 1981 and 1991
• Area type (sample survey) • 1990s - Prof. Brian Robson
• Presentation close to first (spatial) • 1999 - Prof. Michael Noble (MDM 2001)
approach for NI • 2003 - Further review (NIMDM 2005)
NIMDM 2005 Project Research Administrative data (NI)
Team
• Measures based on administrative sources
• Public tender for research
• Use of postcodes
• c50,000 domestic postcodes
• Lead researchers –
• Average of 15 households per postcode
– Professor Michael Noble, University of Oxford
– Mr George Smith, University of Oxford • Created postcode look-up tables
• [Central Postcode Directory]
Combat Poverty Agency/NIRSA - Mapping Poverty Conference - 8 September 2005 1Geography Geography (RoI)
• Spatial Scale is key in mapping poverty • Constant census geography
• District Electoral Divisions
• Statistical/Administrative Geography
• c3,500
• Median population of 500 persons per DED
• Role of Census of Population
• But range 20-25,000 persons
• [Cook et al, 2000]
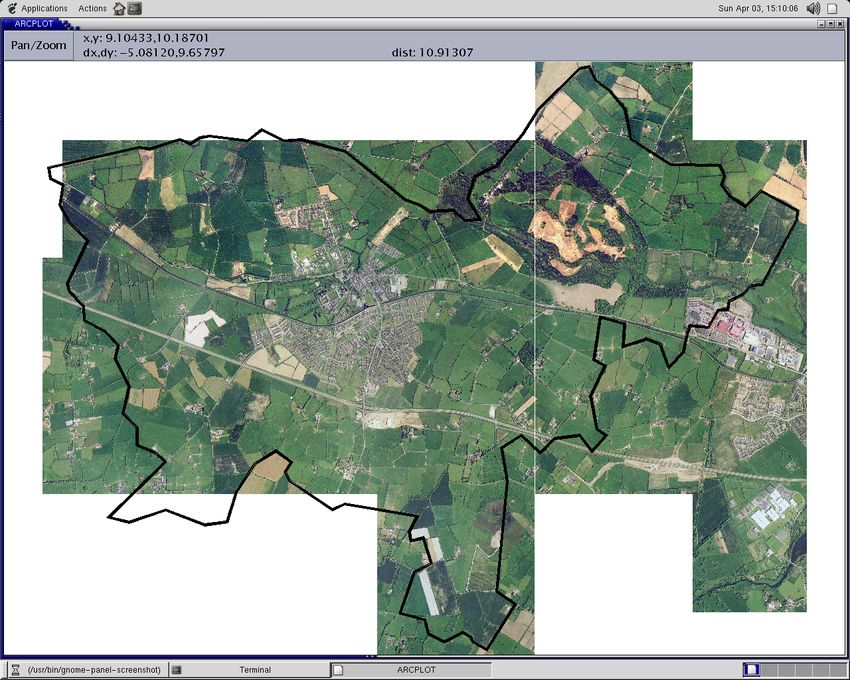
Geography (NI) 2001 Census Output Geography :
Why rethink and redesign?
• Until recently used electoral wards • Census user demand for “better” output
geography from previous censuses – link to
postcodes – designed for statistical purposes
• Broadly similar in population size
• Separation of the collection and output
• Revised periodically 1973, 1985, 1992 geography
• Smaller areas - more homogeneous areas
• Review of Public Administration • Flexible – areas can be aggregated to user’s
individual requirements
+ Confidentiality – population thresholds
2001 Output Area production Stage 1: Ward based Unit Postcode boundary creation
• General concepts
– Postcode based geography
– enabled by GIS technology
– Output Area design was automated with area
delineation ultimately informed by data from the
census itself (created after census processing) with
explicit consideration of social homogeneity
• Two stage process
– Ward based unit postcode polygon delineation
– Postcode aggregation to form OAs
Combat Poverty Agency/NIRSA - Mapping Poverty Conference - 8 September 2005 2Stage 2: Output Area Design Stage 2: Output Area Design
• Output Area Planning System developed
Process 1
within Office for National Statistics Initial random
aggregation of Design Constraints
• Census data (Households / Population / postcodes
Contiguity,
Tenure, Accomm type) extracted for each Thresholds,
small unit (postcode / part postcode), used to Homogeneity [Tenure/ Accomm type],
inform aggregation Process 2 Size,
Iterative Shape
recombination
• Basic concept – for each ward, the system,
using data from the 2001 Census aggregates
individual postcodes into groups then adjusts
2001
until an optimum set of groups is obtained Output Areas
• Optimum group - Output Areas
Combat Poverty Agency/NIRSA - Mapping Poverty Conference - 8 September 2005 3OA – 95GG180005
Population: 362
Households: 134
NIHE Rented: 82
Owned: 33
Other: 19
2001 Census - Output Areas (facts)
• New for 2001 Census, a statistical geography
specifically for small area census outputs
– Full range of output available for each OA –
circa 225 tables Key Stats / CAS / Univariate Tables
• Ward based - aligned to 1992 Wards
• Small size – c125 households/ c340 people
• 5022 OAs in Northern Ireland
• Digital Boundaries and images available
Combat Poverty Agency/NIRSA - Mapping Poverty Conference - 8 September 2005 4Considerations given to a new
geography for MDM 2005
• Ideally - Ward based (1992)
• Create from OAs?
– Can build on availability of data (2001 Census)
– No disclosure risk (built from OAs)
• Geography with more uniform population sizes
– Populations large enough to provide robust statistics
• Similar to areas in GB (SOAs / Datazones)
• Akin to small area geography development in RoI
• NI Super Output Areas
120
100
Percentage of Households
80
Owner
60
Occupied
Rented
40
20
0
2 4 6 8 0 9 1 3 5 7
00 00 00 00 01 00 00 00 00 00
60 60 60 60 60 60 60 60 60 60
S2 S2 S2 S2 S2 S2 S2 S2 S2 S2
S S S S S S S S S S
95 95 95 95 95 95 95 95 95 95
Combat Poverty Agency/NIRSA - Mapping Poverty Conference - 8 September 2005 5SOAs:
• From 582 Wards - Created 890 SOAs
– 323 Wards unaltered Ä 323 SOAs
– 188 Wards (2 SOAs) Ä 376 SOAs
– 53 Wards (3 SOAs) Ä 159 SOAs
– 4 Wards (4 SOAs) Ä 16 SOAs
– 2 Wards (5 SOAs) Ä 10 SOAs
– *12 Wards combined Ä 6 SOAs
• SOAs population sizes range from:
– Smallest 1300 – Largest 2965
– Average size = 1892
Average population size of Ward/SOA by LGD
6000
NIMDM 2005 timetable
5000
• Statistics from 2001 Census – Summer
4000
2003
3000
Ward • Steering Group – Winter 2003
SOA
• Tender and Contract – Spring 2004
2000
• Consultation document – Summer /
1000
Autumn 2004
• Blueprint document – Winter 2004
0 • Report and Results – 26 May 2005
n
ds
Ne & M le
trim
r ry
t
lly h
St agh
L i rn e
y
O n
lly n a
nb y
he n
r th e y
a ig n
ok e
ne
h
ge
Co g h
on
rm n
o w rn e
lt
rric lfas
st us
D u Dow
ag
ad
r
w
Ba o n e
Co rai n
oy
Cr tow
ag
fe
F e no
M isbu
Ar
De
No abb
Ba m e
ba
ri d
av
Do
C a fe r g
a
La
ra
An
m
m
av
wt ou
M
C a Be
an
re
an
s
m
le
ra
Ar
m
le
L
n
ng
k
ag
Ba
y
wr
Ne
NIMDM 2005 Project Research
NIMDM 2005 Steering Group
Team
• Public tender for research • Project overseen by Steering Goup
• Chaired and supported by NISRA
• Lead researchers –
• NI Government Departments
– Professor Michael Noble, University of Oxford
– Mr George Smith, University of Oxford • NICVA, EC, Local Government Districts
and RDC
• Academia
Combat Poverty Agency/NIRSA - Mapping Poverty Conference - 8 September 2005 6NIMDM 2005 - Methodology
Consultation (July – October 2004)
• Consultation document – July 2004 (i) Deprivation built up from domains
– 6,000 copies distributed (Townsend)
• Five public meetings across NI (ii) Indicators within domains
– 250 attendees - domain specific
- major features
• 75 written responses - up to date, robust
- whole of Northern Ireland
• Dedicated project website - small number of indicators within domain
(iii) Report outlines 7 domains
Example: Income Deprivation
• (Income - 4) - People in Income Support households This domain aims to capture the proportions of
the population experiencing income deprivation
• (Employment - 6) - Unemployment claimant count
in an area.
• (Health - 5) - Years of Potential Life Lost Example indicators:
• (Education - 8) - GCSE/GNVQ points score • Adults and children in Income Support
households (2003, Source: DSD)
• (Proximity – 9) - Road distance to settlement of 10,000+
• (Living Environment - 5) - Household overcrowding • Adults and children in Working Families’ Tax
credits households whose equivalised income is
• (Crime & Disorder - 6) - Police incident data below 60% of median before housing costs (2003,
Source: Inland Revenue and DSD)
In total 43 indicators used
(iv) Data time point – where possible data
from 2003 used
MDM 2005: Overall methodology
(v) Population counts – estimated for 2003
from the 2001 Census using indicators of Decide on domains to be included
population change
Create individual indicators
(vi) Geography – Super Output Areas with
Combine indicators into individual domain score
summaries for higher geographies
Standardise domain scores
Combine domain scores into overall MDM using
selected weights
Combat Poverty Agency/NIRSA - Mapping Poverty Conference - 8 September 2005 7Geographies in NIMDM 2005 outputs
Overall NIMDM 2005:
Domain weights
Parliamentary Constituencies (18) & Local Councils (26)
Domain Integer
Summarised multiple measures
weight weight
Income Deprivation 25% 5
Employment Deprivation 25% 5 Electoral Wards (582)
Health Deprivation and Disability 15% 3
Super Output Areas (890) Average of SOA scores within
Education, Skills and Training Deprivation 15% 3 ward
Proximity to Services Deprivation 10% 2
Living Environment Deprivation 5% 1
Crime and Disorder 5% 1 Output Areas (5022)
Income, Employment, Proximity to Services domains
Percentage of population living in most deprived SOAs in NI
Local Government Districts (26)
Strabane 54% …..
Belfast 48% North Down 3%
Derry 46% Magherafelt 1%
Newry and Mourne 25% Ballymoney 1%
Top Line results Craigavon 23% Banbridge 0%
Parliamentary Constituencies (18)
Belfast West 79% ….
by Geographical Level Belfast North 60% ….
Foyle 46% South Antrim 4%
West Tyrone 31% Lagan Valley 4%
Belfast East 23% Strangford 4%
Newry and Armagh 23% North Down 2%
Within Belfast Local Authority
• Top ten most deprived SOAs in NI are in Belfast
• Approx 1/3 of SOAs in Belfast are in the top 10%
of most deprived SOAs in NI – and are deprived
on two or more domains
• There are just under 83,000 people in Belfast
experiencing Income Deprivation
• There are just over 30,000 people in Belfast
experiencing Employment Deprivation
Combat Poverty Agency/NIRSA - Mapping Poverty Conference - 8 September 2005 8NI MDM – Rank 94
NI MDM – Rank 563
MDM 2005: Final report and data
• Published 26 May 2005
Accessing Information • Report available
– Hard copy TSO £25 (CD
included)
– Download PDF
www.nisra.gov.uk
• Report and guidance
leaflet
NIMDM 2005 - Data
NIMDM CD product
• Spreadsheet of results available on CD and
NISRA website • Full report access
• Guidance material
• Neighbourhood Statistics GIS Website also • Spreadsheets of the measures
available • Geography products
• www.ninis.nisra.gov.uk
– Look up tables
• Deprivation 2005 button
– Urban Rural (SOA)
• Interactive mapping product – SVG • Visualisation – SVG – Interactive
mapping
Combat Poverty Agency/NIRSA - Mapping Poverty Conference - 8 September 2005 9Further developments
• Increase Interactive mapping
DEMONSTRATION OF
• Underlying indicator data availability CD AND WEBSITE
• User guide
– Available Sept 2005
• Public meetings (x7)
Status of NIMDM 2005
Measures of spatial deprivation in
Northern Ireland – NIMDM 2005
Measures of relative deprivation
Robert Beatty
Consistent, robust and up-to-date
David Marshall (NISRA)
Commended by NISRA across NI
Government and available for all to use “Mapping Poverty…”
University of Ireland, Maynooth
8 September 2005
However use is not mandatory
Combat Poverty Agency/NIRSA - Mapping Poverty Conference - 8 September 2005 10CASE STUDIES
MAPPING POVERTY:
POOR NEIGHBOURHOODS u North Clondalkin, Cherry Orchard …
WORKSHOP – Locations and profiles
– Some research findings
» Internal geographies
» Multiple ‘voices’
Case Studies of ‘Poor Places’
– The blame game
– Internal and external dimensions
Mary Corcoran and Brendan Bartley,
NIRSA, NUI Maynooth
CASE STUDIES ‘PROFILING’ POOR PLACES
u Fatima Mansions and Kilmainham u Poor people or poor places?
– A fake question
u Spirals of decline – Poor people in poor places
u Some research findings u Maps and statistics:
– Enduring communities – Useful but don’t tell the whole story
– Can be misleading…
– Countering placelessness
u The experience of ‘social exclusion’
– Mobilisation – Giving people a voice
u Making regeneration work – Often, voice is not enough…
– Developing participatory structures
ACKNOWLEDGING COMPLEXITY
u Problems and solutions can be:
– About people and places
– Obvious but multifaceted
– Predictable yet uncertain
– Internal and external
– Focused but flexible/ adaptable (responses)
u Policy / intervention needs contributions of
– Poverty indicators, mapped data and lived
experiences
– Additional tools…
Combat Poverty Agency/NIRSA - Mapping Poverty Conference - 8 September 2005 1Creating Small Areas for Ireland:
Methodology and Pilot Results
A Stewart Fotheringham
Martin Charlton
Ronan Foley
Mary O’Brien
http://www.nuim.ie/ncg
http://www.nuim.ie/ncgBackground Electoral Divisions (EDs) currently form the smallest reporting unit for census and other data in Ireland 3440 EDs varying in pop. size from 55 to 24,400 (av. Pop. 1,144) What is needed are Small Areas for reporting spatial data at a more detailed level to aid social and economic assistance (cf. Output Areas in UK) There are no postcodes in Ireland : Dublin however is split into 22 postal zones This paper reports on a Pilot Project to develop an automated technique for development of Small Areas (SAs)
Test Area Maynooth ED Location of NUIM; Familarity – testing – Do SAs ‘make sense’? Pop. 11,000 Rapidly growing Student and commuter population
Data Sources OSi 1:1000 vector data 1:40,000 Orthophotos An Post GeoDirectory (coordinates of residences; letterbox counts) CSO census records for each property (as employees of CSO)
Data Processing Road centrelines extracted from OSi data Coordinates of residential buildings plus household count extracted from GeoDirectory Each residence linked to nearest segment ID from roads data Census data linked to each residential property
Street segments – Moyglare Village
Creating Small Areas for Ireland:
 Methodology and Pilot Results

     A Stewart Fotheringham
         Martin Charlton
          Ronan Foley
          Mary O’Brien

      http://www.nuim.ie/ncg
      http://www.nuim.ie/ncg
Background Electoral Divisions (EDs) currently form the smallest reporting unit for census and other data in Ireland 3440 EDs varying in pop. size from 55 to 24,400 (av. Pop. 1,144) What is needed are Small Areas for reporting spatial data at a more detailed level to aid social and economic assistance (cf. Output Areas in UK) There are no postcodes in Ireland : Dublin however is split into 22 postal zones This paper reports on a Pilot Project to develop an automated technique for development of Small Areas (SAs)
Test Area Maynooth ED Location of NUIM; Familarity – testing – Do SAs ‘make sense’? Pop. 11,000 Rapidly growing Student and commuter population
Data Sources OSi 1:1000 vector data 1:40,000 Orthophotos An Post GeoDirectory (coordinates of residences; letterbox counts) CSO census records for each property (as employees of CSO)
Data Processing Road centrelines extracted from OSi data Coordinates of residential buildings plus household count extracted from GeoDirectory Each residence linked to nearest segment ID from roads data Census data linked to each residential property
Street segments – Moyglare Village
The Algorithm Basic idea Create a skeleton of adjoining centreline segments such that the number of households in the skeleton is above some threshold Has two Stages (a) build initial skeletons (b) re-allocate skeletons which are below threshold to passing ones
The Algorithm Basic idea Create a skeleton of adjoining centreline segments such that the number of households in the skeleton is above some threshold Has two Stages (a) build initial skeletons (b) re-allocate skeletons which are below threshold to passing ones
Stage (a): skeleton building
choose an unallocated ‘parent’
segment at random
link neighbouring (eligible)
segments
stop when number of households
has reached threshold {65}Linkage choices Linkage can either be based on: numbers of households or distance from the parent segment Two further choices: Abstemious: link segment with smallest number of households or which is shortest Greedy: link segment with largest number of households or which is longest
Parent segment
Identify 1st order eligible segments
Join shortest
Creating Small Areas for Ireland:
Methodology and Pilot Results
A Stewart Fotheringham
Martin Charlton
Ronan Foley
Mary O’Brien
http://www.nuim.ie/ncg
http://www.nuim.ie/ncgBackground Electoral Divisions (EDs) currently form the smallest reporting unit for census and other data in Ireland 3440 EDs varying in pop. size from 55 to 24,400 (av. Pop. 1,144) What is needed are Small Areas for reporting spatial data at a more detailed level to aid social and economic assistance (cf. Output Areas in UK) There are no postcodes in Ireland : Dublin however is split into 22 postal zones This paper reports on a Pilot Project to develop an automated technique for development of Small Areas (SAs)
Background
Electoral Divisions (EDs) currently form the
smallest reporting unit for census and other
data in Ireland

3440 EDs varying in pop. size from 55 to
24,400 (av. Pop. 1,144)

What is needed are Small Areas for reporting
spatial data at a more detailed level to aid
social and economic assistance (cf. Output
Areas in UK)

There are no postcodes in Ireland : Dublin
however is split into 22 postal zones

This paper reports on a Pilot Project to
develop an automated technique for
development of Small Areas (SAs)
Test Area
Maynooth ED

Location of NUIM; Familarity –
testing – Do SAs ‘make sense’?

Pop. 11,000

Rapidly growing

Student and commuter population
Data Sources OSi 1:1000 vector data 1:40,000 Orthophotos An Post GeoDirectory (coordinates of residences; letterbox counts) CSO census records for each property (as employees of CSO)
Data Processing
Road centrelines extracted from OSi
data

Coordinates of residential buildings
plus household count extracted
from GeoDirectory

Each residence linked to nearest
segment ID from roads data

Census data linked to each
residential property
Street segments – Moyglare Village
Creating Small Areas for Ireland:
 Methodology and Pilot Results

     A Stewart Fotheringham
         Martin Charlton
          Ronan Foley
          Mary O’Brien

      http://www.nuim.ie/ncg
      http://www.nuim.ie/ncg
Background Electoral Divisions (EDs) currently form the smallest reporting unit for census and other data in Ireland 3440 EDs varying in pop. size from 55 to 24,400 (av. Pop. 1,144) What is needed are Small Areas for reporting spatial data at a more detailed level to aid social and economic assistance (cf. Output Areas in UK) There are no postcodes in Ireland : Dublin however is split into 22 postal zones This paper reports on a Pilot Project to develop an automated technique for development of Small Areas (SAs)
Test Area
Maynooth ED

Location of NUIM; Familarity –
testing – Do SAs ‘make sense’?

Pop. 11,000

Rapidly growing

Student and commuter population
Data Sources OSi 1:1000 vector data 1:40,000 Orthophotos An Post GeoDirectory (coordinates of residences; letterbox counts) CSO census records for each property (as employees of CSO)
Data Processing
Road centrelines extracted from OSi
data

Coordinates of residential buildings
plus household count extracted
from GeoDirectory

Each residence linked to nearest
segment ID from roads data

Census data linked to each
residential property
Street segments – Moyglare Village
The Algorithm
Basic idea
Create a skeleton of adjoining centreline
segments such that the number of
households in the skeleton is above
some threshold

Has two Stages

(a) build initial skeletons
(b) re-allocate skeletons which are below
threshold to passing ones
The Algorithm
Basic idea
Create a skeleton of adjoining centreline
segments such that the number of
households in the skeleton is above
some threshold

Has two Stages

(a) build initial skeletons
(b) re-allocate skeletons which are below
threshold to passing ones
Stage (a): skeleton building

choose an unallocated ‘parent’
segment at random
link neighbouring (eligible)
segments
stop when number of households
has reached threshold {65}
Linkage choices Linkage can either be based on: numbers of households or distance from the parent segment Two further choices: Abstemious: link segment with smallest number of households or which is shortest Greedy: link segment with largest number of households or which is longest
Parent segment
Identify 1st order eligible segments
Join shortest
Join next shortest
Join next shortest
Join next shortest – all 1st order segments now joined
Identify eligible 2nd order segments
Join shortest
Join next shortest – all 2nd order segments dealt with
Identify 3rd order segments… etc. Stop when threshold is met
Stage (a): outcomes

At the end of Stage (a) every
segment has been allocated to
a skeleton
Skeletons either pass
household count threshold or
they fail it
Stage (b): failing skeletons
Failing skeletons are of three types:

    They connect with no other skeleton
    (orphans). Added to nearest skeleton
    post-algorithm.
    They connect with only one other
    passing skeleton (singleton).
    Automatically added to that skeleton.
    They connect with several passing
    skeletons. Segments are shared
    among the competing skeletons until
    all segments have been reallocated
Iterations Stages (a) and (b) are iterated 2000 times Diagnostic statistic is computed Only solution with lowest diagnostic is saved Possible diagnostics include variation in household counts; smallest average household count, smallest median count, smallest aggregate road length.
Area creation
Thiessen polygons created around
each residential building

Dissolve operation used to remove
internal boundaries between
Thiessen polygons in the same
skeleton

Natural barriers such as waterways,
rail lines and major roads are
incorporated into the algorithm by
applying a large penalty in distance
calculations across such barriers
Natural Barriers
Small Areas
Display and Comparison
Can compare linkage methods:
(a) Abstemious/Property
(b) Abstemious/Distance
(c) Greedy/Property
(d) Greedy/Distance

Can display census data
e.g. Proportion of population in high SEG
Comparison of Algorithms

Algorithm   N of    Minimum Maximum   Mean
            SAs
Abs/Prop       30       68      253   120.57

Gre/Prop       32       67      229   113.03

Abs/DIs        31       68      238   116.68

Gre/Dis        30       66      226   120.57
Socio Economic Group A: Employers and Managers
Single Person Households
Owner Occupied Households
Summary
Now have a working algorithm to generate
SAs within EDs and which produce
reasonable results in one test ED.

Current Funded Stage is to apply algorithm
to 10 ‘exemplar’ EDs across the country to
identify any further issues.

Also need to firm up the rules: min
threshold; max threshold?; how to best
‘future proof’ SAs e.g where to place
boundaries at the edges of urban areas?;
what natural breaks to use? etc.

Eventually, hoped to apply to all 3440 EDs
and also link to current postcode
developments.
Linked Project
Small Area Project 2 Proofs of Concept.

Populating Pilot Areas with other forms of
data.

Testing and Documenting process for
different types of data holdings.

Involving key data holders at national and
local level
Combat Poverty perspective

                                                                  z   Understand spatial distribution of poverty
                      Mapping poverty:
                                                                  z   Importance of place poverty
              policy implications of the research
                                                                  z   Added-value of area-targeted initiatives
                                                                  z   Implications for social housing
                                   Jim Walsh
                          Head of Research and Policy             z   Regional and county responses
                              8 September 2005

                  Spatial distribution of poverty                                   Place poverty

          z   Poverty is spatially diffuse                        z   Suggestion of neighbourhood effect, due to
          z   Significant variations, especially at micro-level       poverty concentrations
          z   Geographic factor primarily distributional, not     z   Restricted access to services, eg shopping,
              causal                                                  GPs, recreation, financial services
          z   No evidence of urban underclass                     z   Role of property-led regeneration policy
                                                                  z   Effect of media imaging

                              Area-targeting                                       Social housing

          z   No easy fix as targeting mechanism                  z   Attempts to ameliorate spatial effect, but
          z   Transitory populations                                  selection effect still strong, reflecting deep-
                                                                      rooted divisions in housing market
          z   Focus on added-value:                               z   Turn-over issue: estates that never grow old
               – better coordination/delivery;
                                                                  z   Consequences for social cohesion
               – responsive to local needs;
                                                                  z   Estate management critical issue
               – community involvement
                                                                  z   Housing-related deprivation (eg housing
          z   Institutional reform agenda                             conditions, environment, fuel poverty)

Combat Poverty Agency/NIRSA - Mapping Poverty Conference - 8 September 2005                                             1
Regional and county responses
z Importance of regional/county indicators of
poverty, linked to national indicators
z Reduce differentials between areas
z Highlight disparities in deprivation, especially
those focused on housing and environment
z Potential of regional/county anti-poverty
strategies
Combat Poverty Agency/NIRSA - Mapping Poverty Conference - 8 September 2005 2You can also read