SeaCONEX: Simultaneously Visualizing Ocean Carrier Supply Chain Service Networks and Continuous Vessel Movement Data - OSF
←
→
Page content transcription
If your browser does not render page correctly, please read the page content below
SeaCONEX: Simultaneously Visualizing Ocean Carrier Supply Chain
          Service Networks and Continuous Vessel Movement Data
        Mason Leon            *      Rithika Lakshminarayanan                      David Saffo                   Sara Di Bartolomeo

                                                                  Cody Dunne
                                                                Northeastern University

                                                       Figure 1: The SeaCONEX Dashboard.

A BSTRACT                                                                     Keywords: Human centered computing, Geographic visualization,
                                                                              Geospatial data, Supply chain management, Geographic information
   Supply chain disruption and the complexity of maritime and                 systemst
hinterland freight networks remain key issues around the world.
SeaCONEX is not just a portmanteau of the humble container’s                  1   I NTRODUCTION       AND    P ROBLEM D OMAIN
origin, but a visualization tool that enables users to see the marine
terminal connections for ocean carrier service rotations, investigate            The Container Express also known as the CONEX, was deployed
the historical trajectories of vessels assigned to ocean carrier services,    by the U.S. military during the Korean War as a modular platform to
and assess deviations from a shortest-path optimal route. In this             improve global logistics operations [10]. This containerization con-
paper, we present an approach to integrating ocean carrier service            cept was soon reinforced by commercial intermodal1 freight service.
network information with continuous movement data for container               On April 20, 1956, Malcolm McLean, “the father of containeriza-
and roll-on/roll-off cargo vessels with reproducibility in mind and           tion“, ushered in the modern supply chain era when his SS Ideal
utilizing new open-source industry data standards. We developed               X sailed from New York to Houston laden with 58 containers [10].
a multiple-view visualization that presents commercial maritime               As containerization took hold, other innovators soon followed suit
freight carrier service connections between marine terminals and              with their own proprietary equipment. Even among competitors,
links the spatial temporal movements of vessels assigned to each              however, the seamless interchange of cargo across modes required
service over a 90 day period which can be filtered by carrier. A copy         uniform design and securement mechanisms. McLean shared his
of this paper along with all supplemental material is available at            patent designs with the International Standards Organization (ISO)
https://osf.io/k9nvc/                                                         and common specifications eventually emerged [24].
                                                                                 The modern supply chain is global in scope, incredibly complex,
                                                                              and essential to the world’s economy. Ocean freight accounts for
    * Corresponding author. E-mails: [ leon.m — lakshminarayanan.r —          more than 80% of the total world merchandise trade [46]. The sheer
saffo.d — dibartolomeo.s — c.dunne ]@northeastern.edu                         scale of the maritime industry has led to many opportunities and
                                                                              challenges as it undergoes digital transformation. This sector rep-
                                                                              resents a core component of the global supply chain, yet container
                                                                              liner carrier operations often appear hidden from those outside the
                                                                              industry. Despite advancements in freight handling and the rise
                                                                                  1 Intermodal: The movement of freight, in a container or on a trailer, by

                                                                              more than one mode of transportation. The movement can be made from rail
                                                                              to truck to ship in any order [41]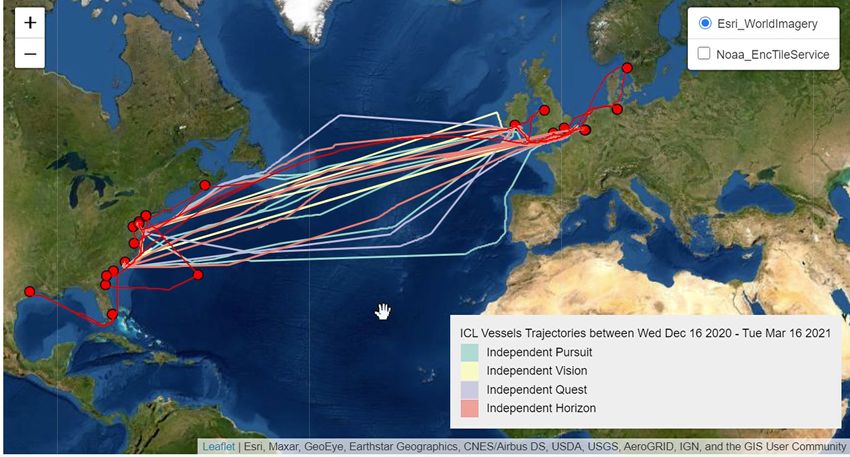
in logistics information technology, supply chains remain vulnera-              Fiorini, Michele et al. [9] present a pipeline using open source GIS
ble to disruption and are plagued by poor visibility and difficulty             relational database tools to process raw AIS data and visualize vessel
exchanging cargo and freight network information.                               routes for maritime spatial planning. As indicated by Wang, Hao
   While standards exist for physical intermodal container equip-               et al. [48] and Wang, Kai et al. [49], the quantity and poor qual-
ment design, standards regarding the exchange of service informa-               ity of AIS data is a challenge when performing exploratory vessel
tion documenting every aspect of a container’s journey throughout               movement analysis. Rajabi, Aboozar et al. [45] demonstrate how
the global supply chain are still under development. An increasingly            vessel analysis with AIS data can be of great value for “smart port“
difficult question has been in regards to not only standardisation              operations and marine terminal scheduling.
and sharing of carrier service information but also the level of data              Through the development of open-source geospatial tools and
granularity necessary for stakeholders. For example, the 2020-2021              libraries, Anita Graser discusses the technical complexity required
supply chain disasters and maritime service disruptions have demon-             to manipulate spatial temporal data for exploratory analysis is not
strated the need for new approaches to combining different data                 restricted to the maritime domain [14–19]. In Exploratory Data
sets to analyze supply chain risk. Choke-points in the maritime                 Analysis (EDA) protocol for identifying problems in continuous
supply chain detrimentally impacted the ability of government and               movement data, she demonstrates how to address missing data, pre-
the private sector response to COVID-19 such as the sourcing of                 cision, consistency, and accuracy problems in an AIS data [13].
personal protective equipment and vaccine manufacturing. Addition-                 Basole et al. [1] present a visualization tool in their paper that
ally, COVID-19 changes in work, merchandise trade, consumption,                 enables exploratory analysis of innovations in the global supply
and manufacturing patterns have demonstrated long simmering and                 chain network of electronics. The approach they use is meant to help
evolving maritime supply chain challenges. The grounding of the                 make managerial decisions based on actionable insights that reveal
Evergreen Ever Given in the Suez Canal tested an already strained               clusters, trends and outliers from the analysis. In their paper on
global supply chain and highlighted a worst case maritime risk                  transit system maps, Wu et al. [51] present design considerations for
scenario that linked key industry concerns for over-reliance upon               computer generated transit maps that are not as easy to understand
the just-in-time-manufacturing strategy, the impact of ultra-large-             as human-drawn maps. They found that iterative user testing with
container-vessel (ULCV) deployment, and ocean carrier alliance                  humans can help improve computer designed maps to a usable state.
consolidation [12] [11]. Stakeholders may have had a better un-                 Park et al. [44] evaluate the design of a visual analytical system for
derstanding of maritime supply chain impacts using visualization                supply chain managers to make decisions. Their application sup-
tools that combine both vessel movement and standardized service                ported a number of functions important to decision makers including
network data to provide insights. We present SeaCONEX- a tool                   network information, industrial activities associated with each port
to help investigate maritime connections between marine terminals,              and cost sensitivity.
ocean carrier service rotations, and historical vessel movements.
SeaCONEX combines vessel movement data along with network                       3     A H YPOTHETICAL      U NITED K INGDOM -B ERMUDA M AR -
connectivity data to present users with a dashboard for investigat-                   ITIME N ETWORK
ing carrier routes and possible anomalies or discrepancies between
services and vessel operations. We first discuss the specifics of a                In this section, we first talk about our client and then describe
case study developed to demonstrate this idea. Then we describe                 the case study we designed in line with the needs of our client to
the views designed to help users examine maritime supply chain                  demonstrate our approach. We decided to construct this case study
networks.                                                                       because some of the data we were provided was proprietary and the
   The main contributions of this paper are:                                    amount of data too large to visualize at once.
 1. Adapting the Exploratory Data Analysis (EDA) Protocol for
     Identifying Problems in Continuous Movement Data to process                3.1    The Customer
     and visualize container vessel trajectories,                                  The Volpe National Transportation Systems Center (Volpe) is
 2. Extending open-source industry knowledge and standards to                   a United States Department of Transportation (USDOT) Research
     combine inconsistent ocean carrier service information in a                Center for advanced logistics and transportation technical expertise
     uniform manner to support a container trade network node-link              based in Cambridge, MA. Volpe is a fee-for-service organization that
     visualization,                                                             supports a variety of national strategic transportation projects across
 3. Demonstrating a reproducible approach to combining vessel                   the entire transportation spectrum. For this project we partnered
     movement data with ocean carrier service network data in a                 with Volpe’s Situational Awareness and Logistics Division under the
     single visualization tool.                                                 Infrastructure Systems and Technology Technical Center.
                                                                                   A key client of the division is the United Kingdom Ministry of
2   R ELATED W ORK                                                              Defense (UKMOD). The Volpe team researches, designs, maintains,
   An entire field of study, Maritime Informatics2 has recently                 and develops key multimodal and multi-leg military supply chain lo-
emerged to encompass a variety of existing research areas in or-                gistics information assets for UKMOD, allowing the organization to
der to provide a more holistic understanding of the business domain             manage mission critical cargo and equipment shipments worldwide
and various approaches to industry data applications.                           in support of military operations, commitments to allied nations,
   A significant focus relates to the study of AIS (Automatic Identi-           peacekeeping efforts, and humanitarian aid. Volpe is interested
fication System) [50] data for supply chain operations, port perfor-            in innovative visualization tools for their customer to improve the
mance, marine science, maritime economics, and the environmental                presentation of logistics data and tools to examine choke-points,
impacts of vessel movements. The processing and storage of AIS                  performance, and resiliency in the UKMOD supply chain includ-
often involves GIS (Geographic Information System) techniques in                ing tracking and understanding vessel movements, and viewing the
addition to large-scale “big-data“ computing concepts. For example,             network of port connections.
                                                                                   To provide the end user of our visualization (Volpe) and by exten-
   2 Maritime Informatics: the application of information systems to in-        sion, their customer (UKMOD), a useful and relevant example for
creasing the efficiency, safety, and ecological sustainability of the world’s   how our tool could support the mission, a hypothetical supply chain
shipping industry. It is an applied science, developed by data scientists to    scenario (the case study) was developed using accurate geographic
meet the needs of practice and applied by practitioners and data scientists     background and real commercial maritime carriers and services. Al-
cooperatively. [25]                                                             though the mix of ships and services available in the case study are
commercially operated, they are of similar capabilities and militarily needs and ensure SeaCONEX supported these tasks given the avail-
useful for UKMOD requirements. able data-set. Table 2 contains a task breakdown of high-end user
goals using Brehmer and Munzner’s multi-level task typology [2].
3.2 The Case Study We identified the primary domain tasks to include: (a) examining
service connections within the terminal networks for a carrier(s); (b)
Bermuda is British Overseas Territory reliant on the United King-
examining vessel information and trajectories for a vessel(s) and; (c)
dom for protection and assistance. Should the UKMOD need to send
examining marine terminal information.
supplies or materials to the island by sea, options could include:
Similar to how one might use an interactive tool to explore air-
1. deploying a military or merchant vessel from the UK fleet;
ports and flight connections prior to purchasing a ticket for a trip,
2. chartering or contracting of an available vessel from the interna-
SeaCONEX users want to examine marine terminal and ocean car-
tional market; or
rier connections prior to booking carriage of cargo. A user of Sea-
3. using a commercial cargo carrier with existing service.
CONEX should also be able to view the past movements of vessels
There are no regularly scheduled direct UK-Bermuda ocean shipping assigned to a service. This is important because should the vessels
services. All inbound and outbound oceangoing container cargo on a service appear to have historically made unscheduled stops or
between the UK and Bermuda requires transshipment3 in the US. It deviations from an optimal navigation, the user may be interested in
is important for the UKMOD to be aware of all possible options and another carrier/service offering.
connectivity between the Bermuda Territory and the UK.
For example, during the COVID-19 crisis, global disruptions of
6 V ISUALIZATION D ESIGN
all modes of parcel and cargo shipments impacted Bermuda. As a
result, all mail between the UK and Bermuda since May 18, 2020 Figure 1 shows the final design of SeaCONEX as a dashboard
had been sent via ocean container [4]. Bermudians did not start following usability testing and feedback. Our visualization consists
receiving their 2020 Christmas cards until mid-March 2021 [8]. of four linked views: a carrier filter pane, a vessel table, a node-link
In light of this, the UKMOD needs to evaluate commercial ship- diagram (network map), and a geographic map. The dashboard im-
ping options between the UK and Bermuda. 6 ocean carriers, 9 plements the principles of presenting an overview, filtering, brushing
services, 18 deployed vessels, and their network of marine terminals and linking and details on demand. We will discuss the choices for
were identified for the case study, the details of which are summa- each view.
rized in Table 1. For the purpose of the case study, we assume a The carrier filters pane in Figure 1 encodes the logos for ocean
special partner 3PL coordinates freight forwarding, transshipment, carriers companies. On hover, a user is presented with additional
and drayage between US or European terminals. information about the carrier company and its service. Brushing
links to the other views to filter the corresponding marine terminals
4 DATA and vessels by the selected carrier(s).
The vessel table pane in Figure 1 displays vessels in a tabular for-
The data for the case study fell in to two main categories: service mat with each column corresponding to a ship’s attribute. Brushing
related information and vessel movement information. For a com- allows users to view data in the geographic map for the vessel(s) cor-
plete list of the ocean carrier service data sources, pleas from ocean responding historic geographic movements over the 90 day period.
carrier and some industry websites [3, 5–7, 20–23, 26–40, 42, 43].
The node-link diagram pane in Figure 2 represents a directed
The vessel movement data over a 90 day period (December 16, network graph with marine terminals (nodes) as circles and carrier
2020- March 16,2021) was provided by Volpe. All data originated service connections (edges) as lines with arrows. By default, a user
in a variety of formats, requiring cleaning and transformation into may see terminals represented by a white color and all network
JSON and GeoJSON files representing an entity that might exist in connections, albeit in a faded out manner. Hovering over a marine
a database. This format allowed us to statically host the case study terminal displays details such as the terminal’s identifying code, fa-
materials and interactive visualization on a GitHub Pages site. The cility name, address, and the port it belongs to. The hover interaction
entities include vessels, terminals, carrier service networks connec- also brings attention to the terminal of interest by changing the ter-
tions, searoutes representing the shortest route over the sea between minal’s color to deep red and taking advantage of the pop-out effect.
two terminals, and vessel timestamped trajectories representing the The terminal encoding returns to default when the user interaction
spatial temporal movements of vessels. A look-up table entity of id’s focus changes. A selection in the carrier filters pane changes color
and join relationships was also created for filtering, aggregation, and of the associated terminal nodes to a red outline with a pink fill and
linking in our visualization without requiring a back-end server and brings the connections into focus using color highlighting. When in
API. When applicable, our data schema design, relationships, enti- view, the connections are encoded with a blue or orange color rep-
ties, fields, or data types were adapted from industry best practices as resenting a respective East or West trade lane. This is important to
documented by the Digital Container Shipping Association (DCSA), highlight because a carrier may not visit a facility in both directions.
Ship Message Design Group e.V (SMDG), Bureau International des The force-directed node-link diagram is advantageous for showing
Containers et du Transport Intermodal (BIC), and The Intermodal network data because it removes geographic distance and allows the
Association of North America (IANA). For a more detailed descrip- user to focus clearly on specific nodes and edges connections.
tion about each entity and the fields they contain, please refer to our
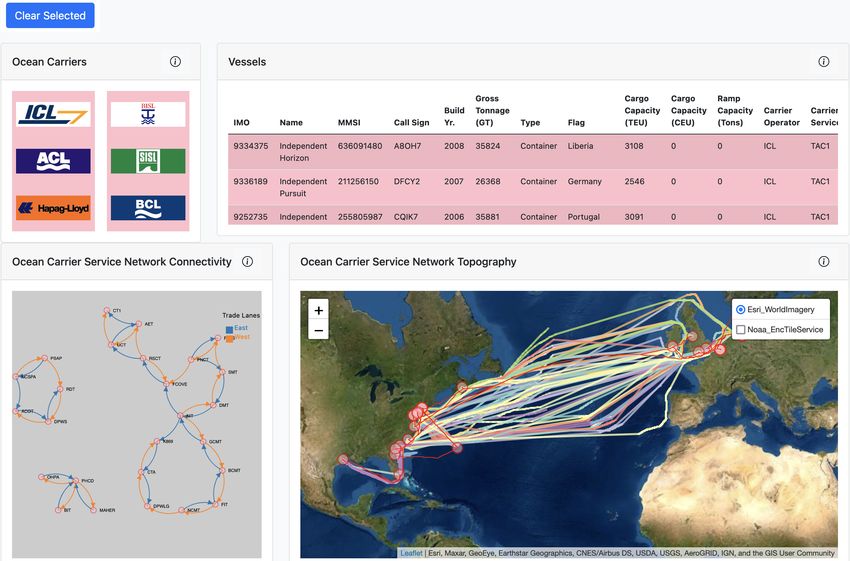
The geographic map pane in (Figure 3) also displays marine ter-
supplementary materials at https://osf.io/k9nvc/.
minals in the same encoding as the node-link diagram. The terminal
elements here also feature the same interactivity and linking to the
5 TASK A NALYSIS carrier filter. Instead of displaying graph network edges, this view
We interviewed our partners at the Volpe Center to identify shows connections between terminals as the optimal maritime route
domain-specific tasks the visualization should support. During the calculated using the SeaRoute model from the European Union’s
design process, we shared with the partner, example visualization statistical office. These elements are not visible by default and ap-
tools from industry software leaders as well as domain specific con- pear red for a carrier selection. Although these connections may not
cepts from academia. This helped us better understand the client’s be accurate for navigation, they show the shortest distance between
terminal pairings and provide a base comparison against actual ves-
3 Transshipment: The unloading of cargo at a port or point where it is sel movements (trajectories). A vessel table selection links to this
then reloaded, sometimes into another mode of transportation, for transfer to map view and displays the corresponding vessel(s) trajectory for the
a final destination [41] dataset time period. The trajectory for each vessel is encoded with aTable 1: An overview of the six ocean carriers and services chosen for the case study
Carrier Trade Service Vessel Deployment Num. Ports Num. Marine Terminals
Bermuda Container Lines (BCL) Bermuda Oleander (O) 1 ConRo vessel 2 2
Bermuda International Shipping Ltd. (BISL) Bermuda Bermuda Islander (BI) 1 LoLo vessel 2 2
Somers Isles Shipping Ltd. (SISL) Bermuda Somers Isles (SI) 1 LoLo vessel 2 2
Independent Container Line (ICL) Trans-Atlantic Trans-Atlantic (TAC1) 4 LoLo vessels 5 5
Atlantic Container Line (ACL) Trans-Atlantic Atlantic (A) 5 ConRo vessels 8 10
Hapag-Lloyd USA, LLC (HLUS) Trans-Atlantic US Flag Priority 1/Atlantic 3 (P1/AL3) 6 LoLo vessels 8 8
Table 2: Domain task and abstract tasks identified using Brehmer and Munzner’s multi-level task typology [2]
Analytic Task Search Task Analyze Task
Task Domain Task
(low-level) (mid-level) (high-level)
1 Examine carrier, service, and cargo network, connectivity for the case study. analyze produce derive
2 Examine vessel trajectories (continuous movement data) for vessels belonging to a carrier or service rotation. query consume summarize
3 Examine vessel information for vessels belonging to a carrier or service rotation. query consume summarize
4 Examine marine terminal information for facilities within the cargo network of the case study. analyze consume discover
for those unfamiliar with maritime supply chain operations. Users
found the feature of comparing actual vessel trajectories against ideal
shortest routes useful to understand route deviations and slowdowns
in cargo transportation.
On introducing SeaCONEX to domain experts, the feedback
was favorable. They found the interface easy to use and said that
combining vessel movement data with carrier network information
would help them in future analytical work to support the needs of
the UKMOD.
The Volpe team found our data processing techniques and open
source data standard adoption of great interest. They are interested
learning more about the open source tools we utilized and the in-
dustry standards to help them address information interchange with
cargo carriers. Our partner mentioned that our tool provided valu-
able insight as to how they could enhance the visual appeal of their
logistics tracking software.
Figure 2: Node-link visualization of ports and connections
8 D ISCUSSION
The biggest challenge throughout the project was acquiring carrier
data and formatting it into a standard. Additionally, complicated
AIS data quality issues added difficulty to calculating and generating
vessel trajectories for the visualization.
In the future we would like to integrate more details in the vi-
sualization, such as the details for the cargo carrying capacities of
different vessels for a carrier, vessel and port performance metrics,
and highlighting unexpected vessel port calls.
9 C ONCLUSION
We designed SeaCONEX as a tool to allow logisticians to exam-
Figure 3: Map showing shortest and actual routes for ICL vessels ine nodes and edges in commercial maritime networks and evaluate
deployed on the TAC1 service over the 90 day period movement patterns for vessels deployed to the networks. Using the
service, carrier and vessel information, we presented users with a
visualization that combines two major types of data into a unified
view. Further work in this area could be used to address choke-points
different color allowing users can visually compare the actual paths in maritime networks and optimize scheduling and routing of cargo
for vessels assigned to the same service as well as the optimal route. and freight movement. We hope that the ideas presented in this paper
Lastly, we provide a reset button to clear all user selections on will be useful to future logistics researchers trying to make decisions
the page. about how to best present information in this data-rich domain.
7 E VALUATION 10 ACKNOWLEDGEMENTS
To validate our design, we conducted a small-scale usability We would like to thank the team working on the UKMOD project
testing in a class of 25 students in line with the design study “lite“ from the Volpe National Transportation Systems Center, U.S. De-
methodology [47]. This helped us identify bugs, refine our design, partment of Transportation for the opportunity to collaborate this
and arrive at a more polished product for our partner. project. We would also like to thank the students in the course for
Users relayed to the team that they could easily find ports and giving us valuable feedback that helped refine our design.
routes. We also understood that the purpose of the tool is hard to un-
derstand for non-domain experts, thus we added more explanationsR EFERENCES hapag-lloyd.com/en/online-business/schedules/
interactive-schedule.html, 2021. [Online; accessed
[1] R. Basole, M. Bellamy, and H. Park. Visualization of Innovation in 4-March-2021].
Global Supply Chain Networks. Decision Sciences, 48, Feb. 2016. doi: [21] L. Hapag-Lloyd USA. Hapag-lloyd - your trusted us flag
10.1111/deci.12213 partner. https://www.hapag-lloyd.com/content/
[2] M. Brehmer and T. Munzner. A multi-level typology of abstract vi- dam/website/downloads/press_and_media/
sualization tasks. IEEE Transactions on Visualization and Computer publications/Serviceflyer_US_Flag.pdf, 2021.
Graphics, 19(12):2376–2385, 2013. doi: 10.1109/TVCG.2013.124 [Online; accessed 4-March-2021].
[3] D. C. S. A. (DCSA). Dcsa information model 3.0. [22] L. Hapag-Lloyd USA. Us flag services - north america to north
https://dcsa.org/wp-content/uploads/2020/12/ europe. https://www.hapag-lloyd.com/en/products/
20201208-DCSA-P1-DCSA-Information-Model-v3. us-flag/bydeparture.html/north_america/north_
0-FINAL.pdf, dec 2020. europe.html, 2021. [Online; accessed 4-March-2021].
[4] G. o. B. Department of Post Office, Ministry of the Cabinet Office. Bpo [23] L. Hapag-Lloyd USA. Us flag services - north europe to north
- overseas mail advisory. https://www.gov.bm/articles/ america. https://www.hapag-lloyd.com/en/products/
bpo-overseas-mail-advisory, may 2020. [Online; accessed us-flag/bydeparture.html/north_europe/north_
20-April-2021]. america.html, 2021. [Online; accessed 4-March-2021].
[5] B. I. des Containers et du Transport Intermodal (BIC). Bic [24] M. Levinson. The Box: How the Shipping Container Made the World
facility code (locode). https://www.bic-code.org/ Smaller and the World Economy Bigger - Second Edition with a new
bic-facility-codes/, 2021. chapter by the author. Princeton University Press, 2016.
[6] S. M. D. G. S. e.V.). Smdg liner codes list. https://smdg.org/ [25] M. Lind, M. Michaelides, R. Ward, and R. T. Watson, eds. Maritime
documents/smdg-code-lists/smdg-liner-codes/, Informatics, p. 7. Progress in IS. Springer International Publishing,
february 2020. Cham, 2021. doi: 10.1007/978-3-030-50892-0
[7] S. M. D. G. S. e.V.). Smdg terminal code list (tcl). [26] A. C. Line. Transit times. https://www.aclcargo.com/
https://smdg.org/documents/smdg-code-lists/ transit-times/transit-times/, 2021. [Online; accessed
smdg-terminal-code-list/, april 2021. 4-March-2021].
[8] G. Finighan. Covid-19 hit christmas cards arrive at last. The Royal [27] A. C. Line. Vessel schedules. https://www.aclcargo.com/
Gazette. vessel-schedules/, 2021. [Online; accessed 4-March-2021].
[9] M. Fiorini, A. Capata, and D. D. Bloisi. AIS Data Visualization [28] A. C. Line. Vessel specifications. https://www.aclcargo.
for Maritime Spatial Planning (MSP). International Journal of e- com/vessel-specifications/, 2021. [Online; accessed 4-
Navigation and Maritime Economy, 5:45–60, Dec. 2016. doi: 10. March-2021].
1016/j.enavi.2016.12.004 [29] B. I. S. Ltd. Bisl 2021 sailing schedule. https://www.
[10] N. R. C. U. C. for a Study of the Effects of Regulatory Reform on bermudaislander.bm/BISL_Schedule_2021.pdf, 2021.
Technological Innovation in Marine Container Shipping. Intermodal [Online; accessed 4-March-2021].
Marine Container Transportation: Impediments and Opportunities, vol. [30] B. I. S. Ltd. Company profile. https://www.
236 of Special report (National Research Council (U.S.). Transporta- bermudaislander.bm/company_profile.html, 2021.
tion Research Board)), pp. 17–20. Transportation Research Board, [Online; accessed 4-March-2021].
National Research Council, 1992. [31] I. C. L. Ltd. Fixed weekly schedule. https://www.icl-ltd.
[11] I. T. Forum. The impact of mega-ships. (10), 2015. doi: https://doi. com/fixed-weekly-schedule/, 2021. [Online; accessed 4-
org/10.1787/5jlwvzcm3j9v-en March-2021].
[12] I. T. Forum. The impact of alliances in container shipping. (62), 2018. [32] I. C. L. Ltd. Sailing schedule. https:
doi: https://doi.org/10.1787/61e65d38-en //www.icl-ltd.com/media/2303/
[13] A. Graser. An exploratory data analysis protocol for identifying sailing-schedule-updated-3-4-2021-web.pdf,
problems in continuous movement data. Journal of Location Based 2021. [Online; accessed 4-March-2021].
Services, 15(2):89–117, Apr. 2021. Publisher: Taylor & Francis [33] I. C. L. Ltd. Vessels, ports of call. https://www.icl-ltd.com/
eprint: https://doi.org/10.1080/17489725.2021.1900612. doi: 10. vessels-ports/, 2021. [Online; accessed 4-March-2021].
1080/17489725.2021.1900612 [34] N. G. M. Ltd. 2021 shipping schedule. https:
[14] A. Graser and M. Dragaschnig. Exploring movement data in notebook //neptunebermuda.com/wp-content/uploads/2021/
environments. In IEEE VIS 2020 Workshop on Information Visualiza- 01/2021-Shipping-Schedule-Final.pdf, 2021. [Online;
tion of Geospatial Networks, Flows and Movement (MoVis), 2020. accessed 4-March-2021].
[15] A. Graser and M. Dragaschnig. Open Geospatial Tools for Movement [35] N. G. M. Ltd. Bermuda container line – who we are. https:
Data Exploration. KN J. Cartogr. Geogr. Inf., 70(1):3–10, Apr. 2020. //neptunebermuda.com/who-we-are/, 2021. [Online; ac-
doi: 10.1007/s42489-020-00039-y cessed 4-March-2021].
[16] A. Graser, M. Dragaschnig, P. Widhalm, H. Koller, and N. Brandle. [36] N. G. M. Ltd. Our ship. https://neptunebermuda.com/
Exploratory Trajectory Analysis for Massive Historical AIS Datasets. our-ship/, 2021. [Online; accessed 4-March-2021].
In 2020 21st IEEE International Conference on Mobile Data Manage- [37] S. I. S. Ltd. About us. https://www.
ment (MDM), pp. 252–257. IEEE, Versailles, France, June 2020. doi: somers-isles-shipping.com/about/, 2021. [Online;
10.1109/MDM48529.2020.00059 accessed 4-March-2021].
[17] A. Graser, J. Schmidt, F. Roth, and N. Brändle. Untangling origin- [38] S. I. S. Ltd. Mv somers isles - main particulars. https://www.
destination flows in geographic information systems. Information somers-isles-shipping.com/ship/, 2021. [Online; ac-
Visualization, 18(1):153–172, Jan. 2019. Publisher: SAGE Publications. cessed 4-March-2021].
doi: 10.1177/1473871617738122 [39] S. I. S. Ltd. Shipping schedule 2021. https://www.
[18] A. Graser, P. Widhalm, and M. Dragaschnig. Extracting Patterns from somers-isles-shipping.com/schedule/, 2021. [Online;
Large Movement Datasets. giforum, 1:153–163, 2020. doi: 10.1553/ accessed 4-March-2021].
giscience2020 01 s153 [40] S. I. S. Ltd. Somers isles shipping. https://www.
[19] A. Graser, P. Widhalm, and M. Dragaschnig. The M³ massive move- somers-isles-shipping.com/, 2021. [Online; accessed 4-
ment model: a distributed incrementally updatable solution for big March-2021].
movement data exploration. International Journal of Geographical [41] I. A. of North America (IANA). Intermodal Glossary. Intermodal
Information Science, 34(12):2517–2540, Dec. 2020. doi: 10.1080/ Association of North America (IANA), 1 ed., 2017.
13658816.2020.1776293 [42] I. A. of North America (IANA). Iana north american inter-
[20] Hapag-Lloyd. Interactive schedule. https://www. modal facilities directory. https://www.intermodal.org/resource-center/intermodalsystem, 2021.
[43] I. A. of North America (IANA). Uniform intermodal interchange
and facilities access agreement (uiia), equipment return location
directory (erld)). https://www.ianaequipreturn.com/
ReturnLocation/publicPage.do/, 2021.
[44] H. Park, M. A. Bellamy, and R. C. Basole. Visual analytics for supply
network management: System design and evaluation. Decision Support
Systems, 91:89–102, Nov. 2016. doi: 10.1016/j.dss.2016.08.003
[45] A. Rajabi, A. Khodadad Saryazdi, A. Belfkih, and C. Duvallet. To-
wards Smart Port: An Application of AIS Data. In 2018 IEEE 20th
International Conference on High Performance Computing and Com-
munications; IEEE 16th International Conference on Smart City;
IEEE 4th International Conference on Data Science and Systems
(HPCC/SmartCity/DSS), pp. 1414–1421. IEEE, Exeter, United King-
dom, June 2018. doi: 10.1109/HPCC/SmartCity/DSS.2018.00234
[46] S. N. Sirimanne, J. Hoffman, W. Juan, R. Asariotis, M. Assaf, G. Ayala,
H. Benamara, D. Chantrel, J. Hoffmann, A. Premti, et al. Review of
maritime transport, 2019. Technical report, tech. rep, 2019.
[47] U. H. Syeda, P. Murali, L. Roe, B. Berkey, and M. A. Borkin. Design
study ”lite” methodology: Expediting design studies and enabling the
synergy of visualization pedagogy and social good. In Proceedings of
the 2020 CHI Conference on Human Factors in Computing Systems,
CHI ’20, p. 1–13. Association for Computing Machinery, New York,
NY, USA, 2020. doi: 10.1145/3313831.3376829
[48] H. Wang, X. Zhuge, G. Strazdins, Z. Wei, G. Li, and H. Zhang. Data
Integration and Visualisation for Demanding Marine Operations. Apr.
2016. doi: 10.1109/OCEANSAP.2016.7485617
[49] K. Wang, M. Liang, Y. Li, J. Liu, and R. W. Liu. Maritime Traffic
Data Visualization: A Brief Review. In 2019 IEEE 4th International
Conference on Big Data Analytics (ICBDA), pp. 67–72. IEEE, Suzhou,
China, Mar. 2019. doi: 10.1109/ICBDA.2019.8713227
[50] Wikipedia. Automatic identification system — Wikipedia, the
free encyclopedia. http://en.wikipedia.org/w/index.
php?title=Automatic%20identification%20system&
oldid=1025591994, 2021. [Online; accessed 17-June-2021].
[51] H.-Y. Wu, B. Niedermann, S. Takahashi, M. J. Roberts,
and M. Nöllenburg. A Survey on Transit Map Layout –
from Design, Machine, and Human Perspectives. Com-
puter Graphics Forum, 39(3):619–646, 2020. eprint:
https://onlinelibrary.wiley.com/doi/pdf/10.1111/cgf.14030. doi:
10.1111/cgf.14030You can also read