QUARTERLY PROPERTY MARKET & ECONOMIC UPDATE - NEW ZEALAND QUARTER 1, 2019 - CORELOGIC
←
→
Page content transcription
If your browser does not render page correctly, please read the page content below

Quarterly Property Market
& Economic Update
New Zealand
Quarter 1, 2019

Contents
 About CoreLogic                                                                                                                                                                                                                           3
           CoreLogic Data and Analytics ....................................................................................................................................................................                               3
           Legal Disclaimer ...............................................................................................................................................................................................                3
           Executive Summary ........................................................................................................................................................................................                      4

  Macro Economic and Demographic Indicators                                                                                                                                                                                                5
           New Zealand Asset Classes .........................................................................................................................................................................                             6
           NZ and Australia GDP Growth ....................................................................................................................................................................                                7
           New Zealand Population ...............................................................................................................................................................................                          8
           Migration .............................................................................................................................................................................................................         9
           Regional Building Consents .........................................................................................................................................................................                           10
           Consumer Confidence ...................................................................................................................................................................................                        10
           Employment .......................................................................................................................................................................................................              11
           Interest Rates ....................................................................................................................................................................................................            12

 Housing Overview                                                                                                                                                                                                                         13
           Lending Conditions .........................................................................................................................................................................................                   14
           Sales Volumes ...................................................................................................................................................................................................              15
           Listings .................................................................................................................................................................................................................     16
           Nationwide Values ...........................................................................................................................................................................................                  18
           House Price Index ............................................................................................................................................................................................                 19
           Rent .......................................................................................................................................................................................................................   22
           Buyer Classification .........................................................................................................................................................................................                 23

 Main Cities Housing Market Indicators                                                                                                                                                                                                    24
           Auckland Market Activity .............................................................................................................................................................................                         26
           Auckland Values ...............................................................................................................................................................................................                27
           Auckland Suburb Value Change ................................................................................................................................................................                                  28
           Current Auckland Suburb Values ..............................................................................................................................................................                                  30
           Hamilton Market Activity ..............................................................................................................................................................................                        32
           Hamilton Values ................................................................................................................................................................................................               33
           Tauranga Market Activity ..............................................................................................................................................................................                        34
           Tauranga Values ...............................................................................................................................................................................................                35
           Wellington Market Activity ...........................................................................................................................................................................                         36
           Wellington Values ............................................................................................................................................................................................                 37
           Christchurch Market Activity .......................................................................................................................................................................                           38
           Christchurch Values ........................................................................................................................................................................................                   39
           Dunedin Market Activity ................................................................................................................................................................................                       40
           Dunedin Values .................................................................................................................................................................................................               41

2 | CoreLogic Quarterly Property Market & Economic Update New Zealand Q1 2019

© Copyright 2019. CoreLogic and its licensors are the sole and exclusive owners of all rights, title and interest
(including intellectual property rights) the CoreLogic Data contained in this publication. All rights reserved.
About CoreLogic

CoreLogic is a leading property information, analytics and services provider in the United States, Australia and
New Zealand. CoreLogic helps clients identify and manage growth opportunities, improve performance and
mitigate risk, by providing clients with innovative, technology-based services and access to rich data
and analytics.

Whilst all reasonable effort is made to ensure the information in this publication is current, CoreLogic does
not warrant the accuracy, currency or completeness of the data and commentary contained in this publication
and to the full extent not prohibited by law excludes all loss or damage arising in connection with the data and
commentary contained in this publication.

Contact
Call us 0800 355 355

Wellington office
Level 2, 275 Cuba Street
PO Box 4072
Wellington 6140

Auckland office
Level 5
41 Shortland Street
Auckland 1010
Email: reports@corelogic.co.nz

www.corelogic.co.nz
                                              CoreLogic Quarterly Property Market & Economic Update New Zealand Q1 2019 | 3

                                                    © Copyright 2019. CoreLogic and its licensors are the sole and exclusive owners of all rights, title and interest
                                                      (including intellectual property rights) the CoreLogic Data contained in this publication. All rights reserved.
Executive Summary
The first three months of 2019 delivered pretty much the same property market performance as for most of
2018 - sluggish sales activity and consistent (yet controlled) value growth – with the notable exception of
Auckland. It wouldn’t be any surprise to see more of the same for the rest of 2019.

First, the macroeconomic environment remains supportive. Yes, GDP growth has slowed and will probably ease
down a bit further. But at 2-2.5% both this year and next, growth will still be respectable (and probably higher
than Australia’s figures of perhaps 1.5-2%). The labour market is another strong foundation for property sales
and prices in NZ, with unemployment low. Limited wage growth isn’t however doing much to help improve
housing affordability.

Second, the lending environment is favourable for borrowers – provided of course that they can meet the
deposit, income/expense, and debt serviceability tests. For a start, the next move in the OCR now looks
likely to be a short term cut (in May or August) rather than a longer-term rise. That will at least help to keep
mortgage rates low, even if they don’t fall much further. The intense competition in the banking sector to either
win new borrowers or capture market share at refinancing time from other lenders is also leading to some
really attractive deals for borrowers, e.g. sub 4% two year and three year fixed rates.

The recent rise in lending volumes (by value) has been driven largely by first home buyers (FHBs), with
greater than 80% LVRs drawing down larger average loans (rather than more loans). The sector is however still
operating well below the mandated speed limit, which determines that no more than 20% of owner occupier
loans can be at >80% LVR. It therefore seems unlikely that the Reserve Bank will be especially concerned just
yet. In fact, there would still seem to be some impetus for overall lending volumes yet to come from the higher
LVR segment.

Within the relatively quiet overall market nationally, it’s FHBs and mortgaged investors that are of most interest
according to our Buyer Classification series. Their shares of purchases were 24% apiece in Q1 - putting FHBs
well above normal levels, and investors making a return to form, even if still below past levels. Anecdotally,
some investors are reported to be exiting the sector and selling to FHBs. But there’ll also be other investors
simply snapping up sales to boost their own portfolios, so it’s hard to envisage that the stock of available rental
property is about to change much anytime soon.

Looking specifically at Auckland, it’s not hard to see why values have dipped by 1.5% over the past year and
why further modest falls could occur. Affordability is still low (FHBs are still managing to buy using their
KiwiSaver funds and/or compromising on location/property type), listings are high and buyers aren’t in any
rush.

A key theme to watch relates to policy intervention in the housing market from both the Government and
Reserve Bank. The prospect of a broad-based capital gains tax in 2021 has been ruled out, but the effects of
last October’s Foreign Buyer Ban seem to be playing out in softer sales activity, while the tax ring-fence for
rental property losses is currently going through the parliamentary process. Although not yet law, when it
does pass, it will apply to the current tax year (starting from April 1st) – so investors will need to be factoring
this into their sums right now. Then out on the horizon we have the potential requirement for banks to hold
more capital on their balance sheets, and hence have less money to lend out. We also need to keep an eye on
KiwiBuild and how that might impact supply.

Overall, although the NZ property market is on a relatively solid footing, sales volumes are likely to remain
subdued in 2019. National average prices may edge up by about 3% from their current level of $686,523.
Auckland however looks set for further weakness.

As always, we keep a running monitor on the property market every week via our NZ Property Market Pulse
articles, so be sure to check these out on our website http://www.corelogic.co.nz/news-research/all-news/

4 | CoreLogic Quarterly Property Market & Economic Update New Zealand Q1 2019

© Copyright 2019. CoreLogic and its licensors are the sole and exclusive owners of all rights, title and interest
(including intellectual property rights) the CoreLogic Data contained in this publication. All rights reserved.

Macro Economic and
Demographic Indicators

            CoreLogic Quarterly Property Market & Economic Update New Zealand Q1 2019 | 5

                  © Copyright 2019. CoreLogic and its licensors are the sole and exclusive owners of all rights, title and interest
                    (including intellectual property rights) the CoreLogic Data contained in this publication. All rights reserved.
New Zealand Asset Classes
                                     RESIDENTIAL REAL ESTATE

                                     $1.1 trillion
                                     $264 Billion in home loans

                                     COMMERCIAL/INDUSTRIAL REAL ESTATE

                                     $212 billion
                                     NZ LISTED STOCKS

                                     $146 billion
                                     NZ SUPER & KIWISAVER

                                     $94 billion
The value of residential property remains above one trillion dollars, with mortgages secured against 24% of
this value. In other words, 76% of the value of the property market is household equity.

The commercial & industrial property sector ($212bn) is much smaller than residential, as is the value of the
share market and the country’s superannuation savings.

Sources: CoreLogic NZ, Reserve Bank of NZ, NZX, NZ Super Fund, Financial Markets Authority

6 | CoreLogic Quarterly Property Market & Economic Update New Zealand Q1 2019

© Copyright 2019. CoreLogic and its licensors are the sole and exclusive owners of all rights, title and interest
(including intellectual property rights) the CoreLogic Data contained in this publication. All rights reserved.
NZ and Australia GDP growth
Annual Average GDP Growth (%)

            8
                                                                                         NZ
            7
                                                                                         Australia
            6
            5
            4
            3
            2
            1
            0
           -1
           -2
                                                                   Capital Economics forecast
           -3
                1990       1994         1998        2002            2006                 2010                  2014                 2018

New Zealand’s economy expanded by 0.6% in the final quarter of 2018, double the figure in Q3 (0.3%). This result was driven
by the services sector - which includes retail, business services, and tourism. By contrast, goods-producing activities lagged
a little behind in the fourth quarter.

During the 2018 calendar year, the economy expanded by 2.8%: slower than 3.1% in 2017 but hardly a disaster. That said,
growth is anticipated to cool again in 2019 (perhaps to about 2%), as migration eases and the construction impetus from
previous events such as the Christchurch and Kaikoura earthquakes fades further. However, NZ may remain slightly ahead
of Australia in both 2019 and 2020 in terms of GDP growth.

                                                                         Source: Reserve Bank of New Zealand, Capital Economics

                                                    CoreLogic Quarterly Property Market & Economic Update New Zealand Q1 2019 | 7

                                                          © Copyright 2019. CoreLogic and its licensors are the sole and exclusive owners of all rights, title and interest
                                                            (including intellectual property rights) the CoreLogic Data contained in this publication. All rights reserved.
New Zealand Population
Quarterly Change in National Population (persons per quarter)

 35,000
                                                                                                                    Population growth slowed again in the fourth
                               Quarterly population change                                                          quarter of 2018, from about 1.9% annually to
30 ,000                        4 quarter moving average                                                             1.7%. This was the slowest growth rate in four
                                                                                                                    years, and acts as a natural handbrake on the
 25,000                                                                                                             housing market.

 20,000                                                                                                             Once again it was net migration that pulled
                                                                                                                    the overall growth rate down. In 2017, net
 15,000
                                                                                                                    migration added 70,000 people to our
                                                                                                                    population, whereas that figure dropped
                                                                                                                    to less than 56,000 in 2018.
 10,000
                                                                                                                    At 26,000, natural population growth (births
  5,000                                                                                                             minus deaths) in 2018 was barely changed from
                                                                                                                    2017, and still in the 25,000-30,000 range that
         0                                                                                                          it’s been in for several years now.
             1991     1994     1997 2000            2003      20 06     20 09      2012        2015     2018

Population Change Composition (persons per quarter)
  25,000

                            Natural increase
  20,000
                            Net migration

  15,000

  10,000

    5,000

             0

  -5 ,0 00

-10,000
             1996       1999         2002        2005         2008          2011         2014         2017

Annual Change in Population (persons)

         New Zealand                                                                   91600

                 Auckland                            38700

         Hamilton City        3900

        Tauranga City         3500

       Wellington Cit y       3600

     Christchurch City           7000

          Dunedin City       1900

Source: Statistics New Zealand

8 | CoreLogic Quarterly Property Market & Economic Update New Zealand Q1 2019

© Copyright 2019. CoreLogic and its licensors are the sole and exclusive owners of all rights, title and interest
(including intellectual property rights) the CoreLogic Data contained in this publication. All rights reserved.
Migration
Long term migration (12-month rolling totals)
180,000
                     Net
                                                                                                   Unfortunately the net migration statistics are
160,000              Arrivals
                                                                                                   not as useful at present as they have been
                     Departures
140,000                                                                                            in the past, due to a change in the collection
                                                                                                   methodology and the tendency for big revisions
120,000
                                                                                                   to be made each month. Previously, migration
100,000                                                                                            was estimated on an ‘intentions method’ (what
                                                                                                   people said they planned to do). It’s now
 80,000
                                                                                                   calculated on an ‘outcomes method’ (what
 60 ,0 00                                                                                          people actually did). Because actual outcomes
                                                                                                   are not known for at least a year after a migrant
 40 ,0 00                                                                                          arrives or departs, recent patterns must be
 20 ,0 00                                                                                          statistically estimated/modelled, and that
                                                                                                   gives rise to uncertainty and revisions.
           0

-2 0, 00 0                                                                                         The trans-Tasman balance is also no longer
                                                                                                   available, because of a conscious choice by
-4 0, 00 0                                                                                         Statistics NZ to no longer track migration
          20 02      20 06          2010              2014              2018                       by residency (although they still track it by
                                                                                                   citizenship). District-level migration flows will
Comparison of old and new net migration series                                                     still be available on the new method, but just
(12-month rolling totals)                                                                          not yet.

  80,000                                                                                           The bottom line is that the net migration figures
                                                                                                   need to be treated with caution at present.
  70,000                                                                                           However, taking them at face value (with the
 60,000                                                                                            caveats firmly still in mind), NZ has had a net
                                                                                                   migration inflow of almost 61,600 people over
  50,000
                                                                                                   the past 12 months, an increase of about 10,000
 40,000                                                                                            from a year ago – driven by more arrivals and
                                                                                                   flat departures. This rise in net migration would
  30,000
                                                                                                   have resulted in higher property demand and
  20,000                                                                                           prices than otherwise would have been the case.
 10,000

           0

-10,000

- 20,000

- 30,000
           2002      2006          2010              2014               2018

                                                                Net Gain Last Year                                                        % Change
 TOTAL ALL AREAS                                                        62,733                                                                -11.6%
 Auckland Region                                                         31,417                                                               -13.7%
 Hamilton City                                                           1,887                                                                -2.0%
 Tauranga City                                                             735                                                                -24.1%
 Wellington                                                              2,917                                                                -16.7%
 Christchurch City                                                       4,722                                                                -13.5%
 Dunedin City                                                             899                                                                 -15.2%
 Main Urban Area (Other)                                                 4,719                                                               -14.3%
 Rural Centres                                                            3,713                                                              -23.0%
 Not applicable/Not stated                                               11,724                                                                3.4%

                                                                                                                                 Source: Statistics New Zealand
                                  *Note that these figures relate to Q3 2018. The next publication date for these figures from Statistics NZ is yet to be advised.

                                                             CoreLogic Quarterly Property Market & Economic Update New Zealand Q1 2019 | 9

                                                                     © Copyright 2019. CoreLogic and its licensors are the sole and exclusive owners of all rights, title and interest
                                                                       (including intellectual property rights) the CoreLogic Data contained in this publication. All rights reserved.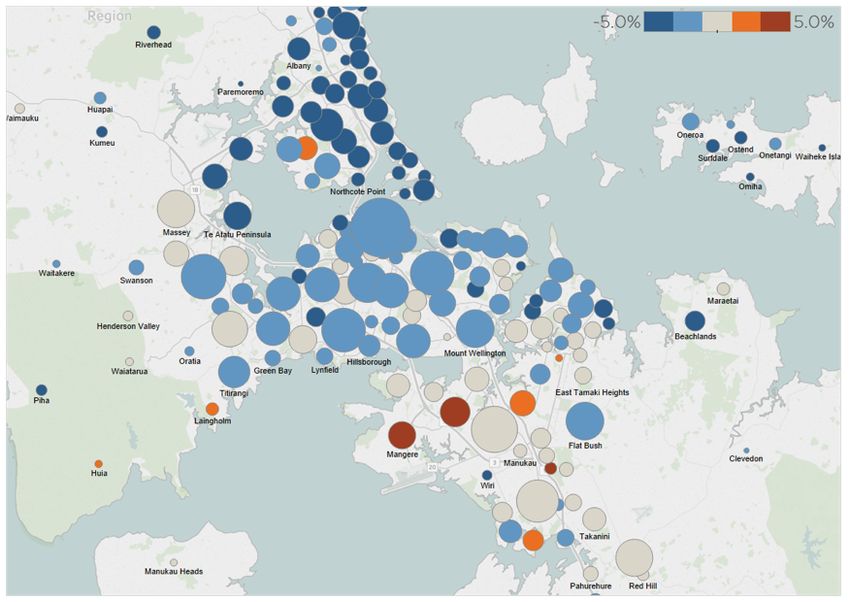
Regional Building Consents
New dwelling consents trend (consents per month) The boom in residential building consents
has continued over the past three months,
with Statistics NZ’s trend measure (which
1,200 smooths out seasonal and other fluctuations)
showing that in the year to February 2019 more
than 34,100 new dwellings were approved to
1,000 be built. That was 8.8% higher than a year ago,
itself already a high figure (31,375). This is the
first time that consents have broken above
800 34,000 annually on this measure.
Auckland remains the key growth area,
600 although the Waikato and Wellington regions
have also been contributing. By property type,
it’s been smaller dwellings (e.g. apartments,
400 flats) driving the growth, particularly in
Auckland. Indeed, more than half of the recent
consents in Auckland have been small dwellings,
200 with these properties in our biggest city now
making up more than 20% of all consents across
New Zealand. This is a good thing from the
0 point of view of housing a growing population.
1995 1999 2003 2007 2011 2015 2019
It’s important to note however that as many
Source: Statistics New Zealand as half of the recent consents in Auckland have
simply been replacing demolished properties,
so we’re cautious of the emerging view that
the city’s shortfall is starting to be eroded
more significantly. Very few of the new-builds
in Auckland are going into lower value segments
either, so there’s still a clear case for some kind
of intervention (e.g. KiwiBuild).
Consumer Confidence
ANZ-Roy Morgan Consumer Confidence (index, monthly)
160 After a lull in the middle of last year, consumer
confidence on the ANZ-Roy Morgan measure
140 has edged higher over the past few months,
reaching 121.8 in March. That’s a couple of points
120 above the long-term average, albeit below
where confidence was a year ago (128.0
this time last year).
100
It can sometimes be a little tricky to
80 disentangle all of the various influences
on consumer confidence, but given that
60 unemployment is still low and mortgage rates
are very favourable it’s not too hard to explain
slightly above-average levels of sentiment at
40 present. At the margin, this should support
activity in the housing market.
20
0
2004 2007 2010 2013 2016 2019
Source: ANZ NZ, Roy Morgan
10 | CoreLogic Quarterly Property Market & Economic Update New Zealand Q1 2019
© Copyright 2019. CoreLogic and its licensors are the sole and exclusive owners of all rights, title and interest
(including intellectual property rights) the CoreLogic Data contained in this publication. All rights reserved.Employment
Annual change in employment, The slowdown in employment growth continued
in the fourth quarter of 2018, with the year-on-
full time and part time
year figure falling from 2.9% in Q3 to just 2.4%.
10% That was the slowest rate since the first quarter
of 2016. Full-time employment growth slowed
8% from 3.6% year-on-year to 3.1%, while part-time
employment actually fell by 0.4% in the year to
6% Q4 2018. A drop in that figure hadn’t occurred
since Q3 2013.
4%
That said, we need to bear in mind that
2% employment growth has been strong for
an extended period and as the number of
0% people employed rises (and fewer people are
unemployed), it’s simply not possible to keep
-2 %
employment growing at the same rates as
before. Indeed, the labour force participation
-4 %
rate - the share of the working age population
-6 %
that are either employed or looking for work -
continues to hover at about 71%, a record high.
-8 % The unemployment rate remains below 4.5%,
1987 1990 1994 1998 2001 20 05 20 09 2012 2016 on a par with previous record lows.
In other words, the labour market is still robust
Labour force participation rate (%) and actually, there are shortages of labour in
72 certain industries (such as construction). This
provides a solid base for the property market,
both in terms of sales volumes and property
70 values. With most people in work, the risks
of repayment problems and mortgagee
68 sales are low.
66
64
62
60
58
1986 1989 1993 1997 2000 20 04 20 08 2011 2015
Unemployment Rate
12
10
8
6
4
2
0
1986 1989 1993 1997 2000 2004 20 08 2011 2015 Source: Statistics New Zealand
CoreLogic Quarterly Property Market & Economic Update New Zealand Q1 2019 | 11
© Copyright 2019. CoreLogic and its licensors are the sole and exclusive owners of all rights, title and interest
(including intellectual property rights) the CoreLogic Data contained in this publication. All rights reserved.Interest Rates
Mortgage Interest Rates (%) The latest OCR review from the Reserve Bank
surprised most analysts by flagging that a near
25
term rate cut (rather than a longer term rate
Floating mortgage interest rates rise) is more likely to be the next move.
2 year fixed rate
The timing of that potential cut remains
20
uncertain, but could be as soon as May,
or failing that, August.
The Reserve Bank’s OCR projections shown in
15
the charts here pre-date that announcement,
but even though they don’t contain a rate cut
in the future path shown, the key message is the
10
same: official interest rates will be low for some
time to come, and this bodes well for borrowers.
It’s an even more favourable environment for
5
borrowers when you also consider the intense
competition between banks at present (witness
the re-emergence of mortgage rate wars).
0
In turn, this will underpin a decent level of
1965 1971 1977 1983 1989 1995 2001 2007 2013 2019
property sales and support house prices.
Official Cash Rate and Mortgage Rates (%) However, there are some upside risks to
12 mortgage rates over a 3-5 year horizon. Most
importantly, the Reserve Bank is likely to impose
10
extra capital requirements on banks and it’s
been estimated that this need to for them
to hold more money on their balance sheets
8 could force up mortgage rates by about one
percentage point.
6
Of course, many recent borrowers will be well
prepared for that anyway, given that they’ve
4 already had to pass tougher serviceability
tests to get their loan in the first place (such as
satisfying the bank that they could still service
2 the mortgage at a theoretical interest rate of
7-8% not just the current 4-5%).
0
20 00 20 03 20 06 20 09 2012 2015 2018 2021
Average Two Year Fixed Rates (%)
5.20 %
5.10 %
5.00 %
4.90 %
4.80 %
4.70 %
4.60 %
4.50 %
Sources: Reserve Bank of New Zealand and interest.co.nz
12 | CoreLogic Quarterly Property Market & Economic Update New Zealand Q1 2019
© Copyright 2019. CoreLogic and its licensors are the sole and exclusive owners of all rights, title and interest
(including intellectual property rights) the CoreLogic Data contained in this publication. All rights reserved.Housing Overview
CoreLogic Quarterly Property Market & Economic Update New Zealand Q1 2019 | 13
© Copyright 2019. CoreLogic and its licensors are the sole and exclusive owners of all rights, title and interest
(including intellectual property rights) the CoreLogic Data contained in this publication. All rights reserved.Lending conditions
Annual Change in Gross New Lending Flows Gross new lending has continued to rise
over the past three months, with February’s
($m per month)
mortgage lending figure ($4.8bn) up by about
$130m from a year earlier. That extended the
1,500
run of increases to 11 months (and the 13th in
1,000
the past 14 months), with larger average loans
rather than a rise in the number of loans being
50 0 the key driver.
0 By borrower type, the overall increases in
mortgage lending continue to be driven by
-500
owner-occupiers, with investors still showing
-1 ,000
broadly flat volumes year-on-year. In February,
for example, the flow of lending to owner-
Investor occupiers was $3.9bn, about $280m higher than
-1,500
Owner-occupier a year ago. By loan type, the share of lending on
-2 ,0 00 interest-only terms remains far lower (28%) than
it was at the peak in May 2016 (41%).
-2 ,500
2016 2017 2018 2019
Much of the growth in lending lately has been
High LVR Lending to Owners and Investors driven by first home buyers (FHBs) with less
than a 20% deposit. However, we doubt that
(% of new lending) the Reserve Bank will be overly concerned
about this just yet. First, given the banks’
25%
current strict lending criteria (e.g. income and
expense testing, debt servicing ability), those
20 %
FHBs getting loans will tend to only be the
‘best’ borrowers anyway – and they’re more
likely to keep servicing the debt in the (unlikely)
15% event of a major economic/property downturn.
Second, the LVR speed limits remain some way
10% off in the distance. The current speed limit for
high LVR owner-occupier borrowing is 20% –
but the actual figure for February was down at
5% just 12%. (Note that the figures for investors at
the new speed limit, i.e. a 5% cap for borrowers
with less than a 30% deposit, or 70% LVR, are
0% not available until July. The lending flows at the
Oc t 16 Feb 17 Jun 17 Oct 17 Feb 18 Jun 18 Oct 18 old 65% LVR mark have been discontinued.)
Refinancing Profile for Mortgages (% of stock) Looking ahead, the rise in mortgage lending
looks set to roll on, giving support to sales
volumes and property values. Competition
40 %
amongst the banks will stay pretty intense
35 % and this will lead to more attractive deals for
borrowers. With more than 80% of mortgage
30 % debt in NZ on a fixed interest rate, household
finances also look relatively resilient.
25%
20 %
15%
10%
5%
0%
Source: Reserve Bank of New Zealand
14 | CoreLogic Quarterly Property Market & Economic Update New Zealand Q1 2019
© Copyright 2019. CoreLogic and its licensors are the sole and exclusive owners of all rights, title and interest
(including intellectual property rights) the CoreLogic Data contained in this publication. All rights reserved.Sales Volumes
Nationwide Sales Volumes (monthly total) There were 7,973 property sales across NZ
in March, down by 12% from a year earlier and
the lowest number for the month of March since
2011. Auckland was even weaker, with sales
down by 16% from a year ago. In other words,
it’s still a pretty soft property market in terms
of volumes, both nationally and in Auckland.
However, to an extent there are different reasons
for this. Around most of NZ, the stock of listings
available on the market is relatively low, so sales
activity is being restrained more by a lack of
choice for buyers rather than an absence of
demand. In that environment, it’s not surprising
that values are rising.
In Auckland, however, listings are high,
so the lack of sales can be attributed to
soft demand. Indeed, the choice available to
buyers in Auckland means that they don’t need
to rush – and equally, with unemployment and
interest rates low, vendors generally aren’t
Nationwide Annual Change in Sales Volumes (%) desperate either. So days to sell is rising and
sales themselves have dropped. For vendors
that do need to sell, prices are dipping a little.
The Foreign Buyer Ban is probably also
playing a role in reducing turnover, but at the
same time this will also have at least opened
up some opportunities for would-be domestic
buyers to return to the market.
Regional Sales Volumes (year-on-year % change)
CoreLogic Quarterly Property Market & Economic Update New Zealand Q1 2019 | 15
© Copyright 2019. CoreLogic and its licensors are the sole and exclusive owners of all rights, title and interest
(including intellectual property rights) the CoreLogic Data contained in this publication. All rights reserved.Listings
New listings (three-week rolling total)
As per normal, new listings rose in January
and February as the market resumed after the
holiday period. However, they’ve peaked for this
season now and will tail off further as winter
sets in. Compared to a year ago, the still-tight
markets in Wellington and Otago have at least
started to see more of a response from would-
be vendors, with new listings rising in response
to the growth in prices.
New Listings Average last 3 weeks 1 month change 1 year change
New Zealand 2,295 -7% 8%
Auckland 671 -11% -8%
Waikato 237 -15% 5%
Bay of Plenty 171 -14% 4%
Wellington 216 0% 27%
Canterbury 331 -12% 10%
Otago 127 -6% 48%
16 | CoreLogic Quarterly Property Market & Economic Update New Zealand Q1 2019
© Copyright 2019. CoreLogic and its licensors are the sole and exclusive owners of all rights, title and interest
(including intellectual property rights) the CoreLogic Data contained in this publication. All rights reserved.Listings
Total listings
Total listings across NZ as a whole are 7% higher
than they were a year ago, driven by Otago,
Auckland, and to a lesser extent Waikato and
Wellington. In Auckland, listings were already
high, so this is just an added headwind for
values (which have already drifted a little
lower in the past few months).
But in Otago and Wellington, listings were
starting from a low base, and so the recent rises
probably won’t be enough to take the steam
out of property value growth just yet. The stock
of property on the market (i.e. listings) is pretty
much unchanged from a year ago in Canterbury.
New Listings Average last 3 weeks 1 month change 1 year change
New Zealand 32,372 2% 7%
Auckland 11,121 2% 14%
Waikato 3,551 5% 9%
Bay of Plenty 2,290 3% 6%
Wellington 1,697 6% 8%
Canterbury 4,965 -2% 1%
Otago 1,327 3% 18%
CoreLogic Quarterly Property Market & Economic Update New Zealand Q1 2019 | 17
© Copyright 2019. CoreLogic and its licensors are the sole and exclusive owners of all rights, title and interest
(including intellectual property rights) the CoreLogic Data contained in this publication. All rights reserved.Nationwide Values
Average Value of Housing Stock - New Zealand ($) National average property values increased
by 2.6% in the year to March 2019, a slowdown
from the figure of 3.0% recorded in February.
That dip in growth may have been small, but
it took the figure down to its slowest pace
since December 2011 (2.3%), when the market
was finally accelerating and permanently
emerging from the GFC-induced lull.
Of course, although they’ve slowed, values are
still growing – boosted by a rising population
(albeit also slowing), the undersupply of
properties, and low unemployment and
mortgage rates. Indeed, at more than $686,500
in March, the average property in NZ hasn’t
become any more affordable in recent months.
A year ago, the average property was about
$17,400 cheaper (at around $669,100).
Annual and Quarterly Change in Value (%)
18 | CoreLogic Quarterly Property Market & Economic Update New Zealand Q1 2019
© Copyright 2019. CoreLogic and its licensors are the sole and exclusive owners of all rights, title and interest
(including intellectual property rights) the CoreLogic Data contained in this publication. All rights reserved.House Price Index
Average Dwelling Value ($) Dunedin is still easily the strongest of the
main centres in terms of property value growth,
with an increase of 13.3% in the year to March.
Wellington is also rising steadily, with average
values up by 8.4% over the past 12 months.
Robust demand and a tight supply of listings
on the market are boosting values in both
places. Meanwhile, Tauranga and Hamilton
are still seeing rising prices, just slower than
Wellington and Dunedin.
By contrast, Christchurch remains a flat
market, with value growth hovering around
zero (0.6%y/y in March), as it has done for about
two years now. In Auckland, property values
have weakened over the past few months, and
were down by 1.5% in the year to March – that’s
the biggest annual fall for a decade, with values
being held back by low affordability, lots of
listings and no rush from buyers.
March 2019
Current Value 3 months 12 months Since 2007 peak
New Zealand $686,523 0.5% 2.6% 66%
Auckland $1,039,917 -0.8% -1.5% 91%
Hamilton $580,285 1.6% 4.5% 61%
Tauranga $733,102 1.7% 3.7% 52%
Wellington $702,896 2.2% 8.4% 54%
Christchurch $497,298 0.1% 0.6% 31%
Dunedin $451,199 3.7% 13.3% 58%
Source: CoreLogic NZ QV Monthly House Price Index
CoreLogic Quarterly Property Market & Economic Update New Zealand Q1 2019 | 19
© Copyright 2019. CoreLogic and its licensors are the sole and exclusive owners of all rights, title and interest
(including intellectual property rights) the CoreLogic Data contained in this publication. All rights reserved.House Price Index Annual Value Change (%) Over the past 12 months, the sluggish markets in Canterbury and Auckland (as well as the West Coast of the South Island) can be clearly seen on a map view. By contrast, the stronger markets have tended to be in the central and eastern parts of the North Island, and to a lesser extent in Otago and Southland. *Size of bubble represents the number of properties in the Territorial Authority 20 | CoreLogic Quarterly Property Market & Economic Update New Zealand Q1 2019 © Copyright 2019. CoreLogic and its licensors are the sole and exclusive owners of all rights, title and interest (including intellectual property rights) the CoreLogic Data contained in this publication. All rights reserved.
Three Month Value Change (%)

The emerging weakness in Auckland is the clearest feature of the timelier three
month changes in values, with several parts of the wider city/region showing blue
(modest price falls). Most other parts of the country look stronger, other than again
Canterbury and parts of the upper South Island.

                                               *Size of bubble represents the number of properties in the Territorial Authority

                                                    CoreLogic Quarterly Property Market & Economic Update New Zealand Q1 2019 | 21

                                                           © Copyright 2019. CoreLogic and its licensors are the sole and exclusive owners of all rights, title and interest
                                                             (including intellectual property rights) the CoreLogic Data contained in this publication. All rights reserved.
Rent
National Annual Change in Value and Rent (%)
25% National rents averaged $433 per week in
the three months to March 2019, up by 6.0%
from $408 a year earlier. Rental growth has
20 %
ticked up a few notches in the past few months,
as landlords perhaps try to recoup the extra
15% costs imposed on them from new government
measures such as insulation requirements.
10%
However, a 6.0% annual rise in rents isn’t
completely out of sync with past norms.
5% Ultimately, any rent increases that landlords
can successfully push through tend to be
0% anchored simply by how much tenants can
afford to pay – itself determined by wage
growth. So with wage growth relatively limited
-5 % at present, we wouldn’t envisage rental growth
accelerating much further.
-10%
Several of the main centres are seeing sizeable
rises in rents at present – at least 7% annually in
-15% Wellington, Dunedin, Tauranga, and Hamilton. In
1998 20 01 20 04 20 07 2010 2013 2016 2019 Wellington and Dunedin in particular, rents will
be rising for the same reason as property prices
Gross Rental Yield – National (%) – shortages of property and robust demand.
6% From an investors’ perspective, it will be
heartening to see gross rental yields now
rising, after a long period where they’ve
5% dropped. Of course, from the troughs of 3.1%
nationally in 2017, the current average yield of
3.3% isn’t exactly a huge amount higher – but
given the slowdown of capital gains, at least it’s
4% moving in the right direction for landlords.
3%
2%
1%
0%
1998 20 01 20 04 20 07 2010 2013 2016 2019
Median Weekly Rent Annual Change in Rent Gross Yield
Auckland $526 2.7% 2.2%
Hamilton $389 7.2% 3.5%
Tauranga $466 8.0% 3.3%
Wellington $525 8.9% 3.3%
Christchurch $372 3.5% 3.9%
Dunedin $352 8.5% 4.1%
Sources: CoreLogic NZ and MBIE
22 | CoreLogic Quarterly Property Market & Economic Update New Zealand Q1 2019
© Copyright 2019. CoreLogic and its licensors are the sole and exclusive owners of all rights, title and interest
(including intellectual property rights) the CoreLogic Data contained in this publication. All rights reserved.Buyer Classification
Buyer Classification – New Zealand (% of sales)
Many of the same patterns that we saw for
30% buyer classification in 2018 have remained
30% 27% in place in the first three months of 2019.
26% Movers (i.e. existing owner occupiers who are
24% relocating) remain slightly less of a presence
than normal in terms of their percentage share
21% 24% of purchases, with the key areas of interest
20% Mover being activity from first home buyers (FHBs)
First Home Buyer and multiple property owners (MPOs) with
Multiple Property Owner Mortgage
Multiple Property Owner Cash a mortgage.
New to Market
ReEntry 13% Across NZ, FHBs accounted for 24% of
Other purchases in Q1 2019, basically unchanged
10% 10% from the final two quarters of 2018. However,
putting that into a longer-term context, FHBs
6% have a larger market share than at any time
5%
since 2007 – and are certainly playing a more
4% 5%
important role than when they only made 18% of
4% 2%
purchases back in Q1 2014. Access to KiwiSaver
0% for the deposit and a willingness to compromise
2006 2008 2010 2012 2014 2016 2018 on location and/or property type (and hence
access lower value housing) are factors allowing
FHBs to continue in the market.
NZ Property Transfers by Non-Citizens or no Resident Visa
(% of total transfers) Mortgaged MPOs have arrested the slide that
they experienced in the aftermath of LVR III
3.5%
in October 2016 (which required them to have
a 40% deposit).After hitting a trough of 22%
3.0% in Q4 2017, they now account for 24% of
purchases. That’s the same as FHBs, whereas
historically mortgaged MPOs have tended
2.5% to enjoy a clear buffer over FHBs in terms of
market share. One difference now is that with
gross rental yields generally low, it’s harder for
2.0%
some would-be investors to make the sums
stack up – especially since costs are rising too
1.5% (e.g. extra insulation requirements, the tax ring-
fence for rental property losses).
1.0% As noted, movers are just ticking along. Their
share of purchases in Q1 2019 was 27%, down a
touch from 28% a year ago and not really much
0. 5%
different from historical norms. With the costs
involved to move and also many with already-
0. 0% large mortgages, staying in the current property
2016 Q4 2017 Q2 2017 Q4 2018 Q2 2018 Q4 and perhaps renovating (rather than relocating)
is a choice many people are making currently.
Source: Statistics New Zealand
CoreLogic Quarterly Property Market & Economic Update New Zealand Q1 2019 | 23
© Copyright 2019. CoreLogic and its licensors are the sole and exclusive owners of all rights, title and interest
(including intellectual property rights) the CoreLogic Data contained in this publication. All rights reserved.Main Cities Housing
Market Indicators
CoreLogic Quarterly Property Market & Economic Update New Zealand Q1 2019 | 24
© Copyright 2019. CoreLogic and its licensors are the sole and exclusive owners of all rights, title and interest
(including intellectual property rights) the CoreLogic Data contained in this publication. All rights reserved.CoreLogic Quarterly Property Market & Economic Update New Zealand Q1 2019 | 25
© Copyright 2019. CoreLogic and its licensors are the sole and exclusive owners of all rights, title and interest
(including intellectual property rights) the CoreLogic Data contained in this publication. All rights reserved.Auckland Market Activity
Buyer Demand – Auckland (volume index)
Buyer demand as measured by valuations
activity is still subdued in Auckland, which isn’t
surprising given low affordability and no real
need to rush to make a purchase (because
listings/choice are high).
The fascinating aspect of buyer classification in
Auckland is that FHBs are the biggest individual
buyer group (27% of purchases), even though
the average property in the city costs more
than $1m. FHBs haven’t been this important to
Auckland’s demand since back in 2006-07, and
the latest figures surely reflect the willingness
of FHBs to move further out from the CBD or
to buy a smaller dwelling.
In terms of their share of purchases,
Auckland’s movers and mortgaged multiple
property owners (MPOs) are less active than
normal. It’s likely that many movers with
already-large debts are just preferring to
sit tight for now, while the low gross yields
(sometimes less than 2%) on offer in Auckland
Buyer Classification – Auckland (% of sales) are probably keeping a lid on the new demand
for property from investors.
There are reasonably clear signs in these figures
that the Foreign Buyer Ban is having an effect
in Auckland. The market share of ‘cash MPO’
(which will cover domestic cash investors,
30%
28% but also some overseas buyers) has reduced
27% recently, as has the ‘new to market’ category.
27% People from Australia and Singapore are exempt
27% 25%
from the ban, and foreign buyers can still invest
24% and hold apartments in large developments –
20% Mover but even so, there are signs in the latest buyer
Multiple Property Owner Mortgage classification stats that the ban has taken a
Multiple Property Owner Cash reasonable chunk of foreign buyers out of
First Home Buyer the market.
New to Market
Other
10% ReEntry 12%
7% 6%
4% 4%
0% 2%
2006 2008 2010 2012 2014 2016 2018
26 | CoreLogic Quarterly Property Market & Economic Update New Zealand Q1 2019
© Copyright 2019. CoreLogic and its licensors are the sole and exclusive owners of all rights, title and interest
(including intellectual property rights) the CoreLogic Data contained in this publication. All rights reserved.Auckland Values
Average value of housing stock Auckland ($)
The falls in Auckland property values in recent
months (which, to be clear, are only modest so
far) have been relatively widespread across the
area. Only Rodney has escaped price falls on
both a three-month and twelve-month horizon,
with the weakest market over the past year
being North Shore (down by 3.1%).
The drops in the past 12 months have been
1-2% in Papakura, Waitakere, Auckland City and
Manukau, and only a minor 0.5% in Franklin.
Annual and quarterly value change Auckland (%)
March 2019
Current Value 3 months 12 months Since 2007 peak
Rodney $953,096 0.2% 0.3% 62%
North Shore $1,197,945 -1.2% -3.1% 86%
Waitakere $814,078 -1.1% -1.3% 92%
Auckland City $1,230,817 -0.2% -1.1% 98%
Manukau $892,867 -1.5% -1.1% 95%
Papakura $691,235 -1.4% -1.7% 92%
Franklin $671,797 -0.3% -0.5% 70%
CoreLogic Quarterly Property Market & Economic Update New Zealand Q1 2019 | 27
© Copyright 2019. CoreLogic and its licensors are the sole and exclusive owners of all rights, title and interest
(including intellectual property rights) the CoreLogic Data contained in this publication. All rights reserved.Auckland Suburb Value Change Annual value change (%) 28 | CoreLogic Quarterly Property Market & Economic Update New Zealand Q1 2019 © Copyright 2019. CoreLogic and its licensors are the sole and exclusive owners of all rights, title and interest (including intellectual property rights) the CoreLogic Data contained in this publication. All rights reserved.
Even in a flat to slightly falling market, there’ll always
                     be variation. Currently, the weakness of values is centred
                     around the North and East of Auckland, with parts of the
                     West and South faring a little better. One key reason for
                     this will be that property is still a bit more affordable in
                     the West and South, so buyer demand is slightly stronger.

                                                                 *Size of bubble represents
                                                      the number of properties in the suburb.

                                                         Based on CoreLogic Median E-valuer

CoreLogic Quarterly Property Market & Economic Update New Zealand Q1 2019 | 29

       © Copyright 2019. CoreLogic and its licensors are the sole and exclusive owners of all rights, title and interest
         (including intellectual property rights) the CoreLogic Data contained in this publication. All rights reserved.
Current Auckland Suburb Values Auckland suburb values 2018 ($) Over the past five years, almost all parts of the country have seen large rises in property values. CoreLogic’s interactive ‘Mapping the Market’ product (www.corelogic.co.nz\mapping-market) shows these changes across the country, it’s freely available and updated quarterly. The heatmaps in ‘Mapping the Market’ are point-in-time snapshots from 2014 and 2019. Auckland is illustrated in the heatmap here. There are no longer any suburbs with a median property value below $500,000 in Auckland. Five years ago, about 20% of all suburbs were below that $500k threshold. At the end of February 2014, 13.8% of suburbs had a median value of at least $1m. Now that figure has risen to 48.0%. *Based on CoreLogic Median E-valuer 30 | CoreLogic Quarterly Property Market & Economic Update New Zealand Q1 2019 © Copyright 2019. CoreLogic and its licensors are the sole and exclusive owners of all rights, title and interest (including intellectual property rights) the CoreLogic Data contained in this publication. All rights reserved.
CoreLogic Quarterly Property Market & Economic Update New Zealand Q1 2019 | 31

       © Copyright 2019. CoreLogic and its licensors are the sole and exclusive owners of all rights, title and interest
         (including intellectual property rights) the CoreLogic Data contained in this publication. All rights reserved.
Hamilton Market Activity
Buyer Demand – Hamilton (volume index)
Similar to the story in Auckland,
mortgaged MPOs are just stepping back
a bit in Hamilton, and first home buyers
have come in and now account for a
record high share of purchases (29%) –
as well as that, they’re actually the
largest individual buyer group.
Mortgaged MPOs (investors) accounted
for 27% of Hamilton property purchases
in Q1 2019, the lowest for more than a
decade. Admittedly, at 11%, there is a little
more activity from cash MPOs in Hamilton
than typically tends to be the case.
Movers are also relatively inactive in
Hamilton (22%), so it’s become a key first
home buyer market. At 29%, FHBs’ share
of purchases in Q1 2019 was the largest of
any individual group, and well above their
previous best of 27% back in late 2006.
Buyer Classification – Hamilton (% of sales)
40%
31%
30% 29%
27%
27%
25%
22%
20% First Home Buyer
Mover
Multiple Property Owner Cash
Multiple Property Owner Mortgage
New to Market
ReEntry 11%
10% Other
7% 7%
4% 4%
0% 3% 1%
2006 2008 2010 2012 2014 2016 2018
32 | CoreLogic Quarterly Property Market & Economic Update New Zealand Q1 2019
© Copyright 2019. CoreLogic and its licensors are the sole and exclusive owners of all rights, title and interest
(including intellectual property rights) the CoreLogic Data contained in this publication. All rights reserved.Hamilton Values
Average value of housing stock – Hamilton ($)
Hamilton’s average property value rose by 1.6%
in the first three months of 2019, with the rise
over the full 12-month period to March coming
in at 4.5%.
Hamilton South East has shown the largest gain
in average property values since March last year
(7.0%), also recording a figure of 2.0% in the first
three months of 2019 alone. The smallest gain
in property values over the past 12 months has
been in Hamilton North East (at 3.0%), where
average values are already the highest (at more
than $722,000).
Annual and quarterly change in value – Hamilton (%)
March 2019
Current value 3 months 12 months Since Peak
Hamilton Central & North West $535,166 1.3% 4.0% 50%
Hamilton North East $722,263 1.3% 3.0% 61%
Hamilton South East $535,462 2.0% 7.0% 53%
Hamilton South West $519,467 1.8% 4.0% 52%
CoreLogic Quarterly Property Market & Economic Update New Zealand Q1 2019 | 33
© Copyright 2019. CoreLogic and its licensors are the sole and exclusive owners of all rights, title and interest
(including intellectual property rights) the CoreLogic Data contained in this publication. All rights reserved.Tauranga Market Activity
Buyer Demand – Tauranga (volume index)
In terms of the main centres of NZ, Tauranga’s
buyer classification make-up is different to the
others. First home buyers are generally less of
a presence in Tauranga, partly because house
prices are high in relation to local incomes.
By contrast, movers from both within the city
and from elsewhere – who have more wealth
and equity behind them – tend to be the key
purchasing group.
Indeed, in Q1 2019, movers accounted for 35%
of property purchases in Tauranga – that’s not
far off previous cyclical peaks. By contrast, FHBs
made just 17% of purchases, while the general
drop-off in market share for mortgaged MPOs
that’s been in progress since early 2016 hasn’t
really turned around yet either. They accounted
for 22% of purchases in Q1 2019.
Buyer Classification – Tauranga (% of sales)
First Home Buyer
Multiple Property Owner Mortgage
40% Multiple Property Owner Cash
Mover
New to Market
33% ReEntry
35%
Other
30%
22%
23%
20%
16%
17%
15%
10% 12%
6% 6%
6%
4%
3% 2%
0%
2006 2008 2010 2012 2014 2016 2018
34 | CoreLogic Quarterly Property Market & Economic Update New Zealand Q1 2019
© Copyright 2019. CoreLogic and its licensors are the sole and exclusive owners of all rights, title and interest
(including intellectual property rights) the CoreLogic Data contained in this publication. All rights reserved.Tauranga Values
Average value of housing stock – Tauranga ($)
Average property values in Tauranga were up by
1.7% in the first three months of 2019, taking the
gain over the last 12 months as a whole to 3.7%.
The level in Tauranga is now $733,102, about
$26,000 higher than a year ago and $57,000
above two years ago.
Annual and quarterly change in value – Tauranga (%)
CoreLogic Quarterly Property Market & Economic Update New Zealand Q1 2019 | 35
© Copyright 2019. CoreLogic and its licensors are the sole and exclusive owners of all rights, title and interest
(including intellectual property rights) the CoreLogic Data contained in this publication. All rights reserved.Wellington Market Activity
Buyer Demand – Wellington (volume index)
Overall activity levels in Wellington are perhaps
not as high as might be thought, given that the
steady growth in values that’s occurring would
normally be associated with a busy market.
However, it needs to be noted that listings are
low – so activity is likely to have been restrained
simply because of a limited supply of stock on
the market actually available to buy.
The purchases that are being made are often
going to first home buyers – in fact, they’re
accounting for as high a share (33%) as ever
before, and they’re the largest individual
buyer group.
The next largest buyer group, which is
mortgaged investors, are quite a long way
back, with a 27% market share. Although that’s
lower than normal, investors have at least made
a comeback in the past few quarters, from a
trough of 23% in Q4 2017. Rising rents and yields
in Wellington may have helped entice some
new investors into the market.
The recent comeback of mortgaged investors
Buyer Classification – Wellington (% of sales) has come at the expense of movers, who have
dropped down to just 20% of purchases. That’s
lower than ever before.
33%
30%
28% 27%
27%
27%
20% First Home Buyer
Mover 20%
Multiple Property Owner Cash
Multiple Property Owner Mortgage
New to Market
ReEntry
Other
10%
8% 9%
4% 5%
3% 4%
3% 2%
0%
2006 2008 2010 2012 2014 2016 2018
36 | CoreLogic Quarterly Property Market & Economic Update New Zealand Q1 2019
© Copyright 2019. CoreLogic and its licensors are the sole and exclusive owners of all rights, title and interest
(including intellectual property rights) the CoreLogic Data contained in this publication. All rights reserved.Wellington Values
Average value of housing stock – Wellington ($)
The growth in property values around
Wellington region remains pretty strong across
the board. The largest gains are being seen in
Upper Hutt and Masterton (both 12.3% in the
year to March), followed by Carterton (11.6%).
The other parts of the region are all seeing
values rise by about the 7-9% range, with
Porirua towards the top, and Kapiti Coast and
South Wairarapa a little further back.
Annual and quarterly change in value – Wellington (%)
March 2019
Current value 3 months 12 months Since Peak
Porirua $597,865 1.1% 8.9% 57%
Upper Hutt $542,220 2.9% 12.3% 54%
Lower Hutt $576,086 3.0% 8.2% 47%
Wellington City $828,645 1.9% 7.9% 56%
Carterton $425,136 1.8% 11.6% 53%
Kapiti Coast $586,842 1.7% 6.8% 53%
Masterton $377,865 1.2% 12.3% 32%
South Wairarapa $514,326 2.3% 6.7% 52%
CoreLogic Quarterly Property Market & Economic Update New Zealand Q1 2019 | 37
© Copyright 2019. CoreLogic and its licensors are the sole and exclusive owners of all rights, title and interest
(including intellectual property rights) the CoreLogic Data contained in this publication. All rights reserved.You can also read