ECONOMIC STUDY OF THE BENEFITS TO THE NEW ZEALAND ECONOMY OF NEW COMPETITION IN THE NEW ZEALAND MOBILE MARKET - 29 SEPTEMBER 2011 - Southern Cross ...
←
→
Page content transcription
If your browser does not render page correctly, please read the page content below
ECONOMIC STUDY OF THE BENEFITS TO THE
    NEW ZEALAND ECONOMY OF NEW
COMPETITION IN THE NEW ZEALAND MOBILE
                MARKET

           29 SEPTEMBER 2011

        © Venture Consulting 2011.
Contents
1 Executive Summary 1
2 Introduction 3
2.1 About Venture Consulting 4
3 Background 5
3.1 Brief History of Mobile Competition in New Zealand 5
3.2 Regulation 6
3.3 Effect of Low Competition on Consumers 8
3.4 Assessing the Level of Competition in the New Zealand over Time 9
3.5 Effect of 2degrees‟ Entry on Pricing Behaviour 10
4 Benefits of competition to the New Zealand Economy 12
4.1 Analysis and Methodology 12
4.2 Summary of Findings 12
4.3 Direct Contribution and Employment 13
4.4 Indirect Contribution and Employment 14
4.5 Competition Dividend 16
5 Intangible Benefits of Competition 20
5.1 Future Competition Dividend 20
5.2 Improvements in Pricing for Other Mobile Services 20
5.3 Improvements in Non-Price Competition for Mobile Services 20
5.4 Improvements in Pricing for Fixed Line Services 21
5.5 Productivity Gains to the Economy 21
6 Concluding Remarks 22
© Venture Consulting 2011.Economic Study – Competition in NZ Mobile Market
1 Executive Summary
The value to December 2010 of the direct and indirect benefits to the New Zealand economy from
increased competition in the mobile market, driven by Two Degrees Mobile Limited (2degrees),
amounts to $2.24 billion.
We expect further benefits over the following 11 years (2011-2021) of $7.8 billion, bringing the total
value of benefits to the New Zealand economy to at least $10.1 billion in today’s money.
This investment will support more than 1,460 New Zealand FTE jobs.
Until recently, the New Zealand mobile market was characterised by high prices, low usage and a high
concentration of market power. In October 2006, a report by the New Zealand Commerce Commission found
that there were significant barriers to entry to the New Zealand mobile market. The report set a clear agenda
for improving the competitiveness of the mobile market.
Since then, the regulatory environment has steadily evolved, reducing these barriers to entry. In August 2009,
a new facilities based operator entered the mobile market increasing competition. This operator, 2degrees,
has invested into the New Zealand economy by building a new network, employing New Zealand workers and
supporting local businesses.
In addition, the increase in competition has delivered significant benefits to consumers through lower prices.
This report assesses and analyses the benefit to the economy of increased competition in the mobile market
in three ways:
1. The Direct Investment of both capital and reinvested revenues, as well as forecast expenditure to 2021:
2degrees has directly contributed $580 million to the New Zealand economy to December 2010, and is
likely to invest a further $4.7 billion from 2011 to 2021;
2. Indirect Investment through the support of NZ businesses and the wider economy: 2degrees has driven
a further $298 million of investment to date and will deliver a further $3.1 billion from 2011 to 2021;
3. The Competition Dividend representing the savings delivered to all New Zealand mobile consumers
through lower mobile voice pricing as a result of competition: Since Q3 2007, New Zealand mobile
consumers have benefited by $1.36 billion, representing an average saving of 21% during the period.
Further savings will be made over the next ten years (not quantified in this report).
Exhibit 1: Value of new competition in the New Zealand Mobile Market ($‘000)
($’000 – 2011 dollars) 2007-2010 2011-2021* Total to 2021*
Direct Investment
580,300 4,700,000 5,300,000
Indirect Investment
297,700 3,100,000 3,400,000
Competition Dividend
1,365,000 1,400,000^
*Note: To the nearest $100 million
^Note: The future competition dividend has not been forecast
© Venture Consulting 2011. 1Economic Study – Competition in NZ Mobile Market
We consider the total value of benefits to the New Zealand economy of $10 billion to be a conservative
estimate due to the exclusion of intangible benefits (including the likely future competition dividend and the
historic and future productivity benefits of mobile competition) from our analysis.
© Venture Consulting 2011. 2Economic Study – Competition in NZ Mobile Market
2 Introduction
In 2006 and 2007 fundamental changes were made to New Zealand telecommunications regulation, which
enabled the market entry of a third network operator. The new entrant, 2degrees, began its network build in
2007 (as NZ Communications). The launch and continued rapid expansion of 2degrees has had a significant
impact on New Zealand‟s telecommunications landscape. 2degrees has made a solid start in penetrating the
1
market, attracting more than 11% subscriber market share in the 19 months since its launch in August 2009 .
Significantly, 2degrees‟ entry into the market has served to break the existing duopoly between Telecom NZ
(Telecom) and Vodafone NZ (Vodafone).
2degrees‟ market entry and subsequent growth have provided considerable benefits to the New Zealand
economy. To date, 2degrees has invested substantial capital into its New Zealand mobile network, with a
2
further $100m network investment currently underway. 2degrees has also grown to employ over 574 staff in
New Zealand.
Moreover, the mobile market has experienced a „Competition Dividend‟ as consumer prices have fallen
following changes to regulation and the launch and expansion of 2degrees. Until 2degrees‟ entry in 2009,
New Zealand stood out as the only OECD country to have fewer than three mobile networks, with four or more
network operators in many countries. Having just two mobile networks restricted the level of competition in the
New Zealand mobile market. As 2degrees prepared to enter the market, the incumbent mobile operators took
steps to protect their strong market positions. 2degrees‟ launch in August 2009 pushed price competition
further with substantial discounts in headline rates compared to the incumbents‟ pricing at the time. These
lower prices and higher inclusive minutes across mobile plans have delivered considerable savings for all
New Zealand mobile customers, regardless of their choice of mobile carrier.
It is against this backdrop that Venture Consulting has been commissioned by 2degrees to prepare an
independent assessment of the impact that increased competition has had on the telecommunications market
and on the wider New Zealand economy. The study seeks to measure the value of the economic benefit
generated by increased competition as a result of the entry of 2degrees into the market and the regulatory
changes that have made it possible.
This report is structured as follows:
Chapter 3 provides an overview of the New Zealand mobile market, with a focus on the factors that
have influenced mobile competition
Chapter 4 analyses the direct and indirect contributions as well as the value provided to the customer
Chapter 5 reviews intangible benefits that have not been included in the valuations
Chapter 6 points to conclusions that may be considered as a result of the outputs of this study
In writing this report, we have had access to 2degrees‟ internal data, including historical financials and a range
of forward-looking business forecasts. These have been used in assessing the direct and indirect contribution
driven by 2degrees.
All amounts in this report are in stated in New Zealand dollars.
1
2degrees public announcement, 21 March 2011, Telecom 2011 half year report, Vodafone 2011 half year report
2
2degrees internal
© Venture Consulting 2011. 3Economic Study – Competition in NZ Mobile Market
2.1 About Venture Consulting
Venture Consulting is the region‟s leading independent telecommunications and digital media strategy
consultancy firm. The firm was formed in January 2009, following a local management buyout of the Sydney
office of global management consultancy Spectrum Value Partners. Venture Consulting‟s head office is in
Sydney and it has a JV office in Singapore. It is part of a global consulting network that extends to London,
New York and Dubai and has access to a team of fifty full time consultants and over 1,000 media practitioners.
Venture Consulting delivers corporate and commercial strategy, market entry planning and support,
transaction support, bid management, operational improvement, policy and regulatory advice, rights
management, strategic technology decision support and strategy implementation. Venture Consulting‟s clients
include leading media players and telecoms operators, new market entrants, policy makers, regulators,
vendors and financiers.
© Venture Consulting 2011. 4Economic Study – Competition in NZ Mobile Market
3 Background
3.1 Brief History of Mobile Competition in New Zealand
Telecom was the first mobile operator in New Zealand entering the market in 1987 with an 800 MHz AMPS
mobile network. Telecom remained the sole mobile network operator until 1993 when BellSouth launched its
900 MHz GSM mobile network. In 1998, Vodafone entered the market by acquiring BellSouth‟s operations
which, by then, had grown to achieve a mobile subscriber market share of nearly 20% (on a base of 19%
mobile penetration at that time).
The following years saw Vodafone rapidly expand its market share to nearly 40% in 2000, and then gain
market leadership (over 50% share) in both revenue (2002) and then subscribers (2003).
From 2003 to 2009, market share remained reasonably stable with little change in subscriber market share
3
between the two mobile operators in New Zealand .
3.1.1 2degrees’ Market Entry
In July 2000, the Hautaki Trust was established to acquire spectrum management rights and enter into
commercial arrangements for the benefit of Māori. Simultaneously, Hautaki secured an agreement with the
Crown to purchase 2100 MHz spectrum.
In late 2001, Hautaki invested in Econet Wireless New Zealand and gave it rights to Hautaki‟s 2100 MHz
spectrum. Econet subsequently changed its name to NZ Communications. Over the following five years,
Hautaki and its investment partners sought regulatory changes that would improve investor confidence in the
creation of a third mobile operator. With a number of market changes achieved, NZ Communications obtained
capital and commenced a mobile network build in 2007.
In April 2009, Two Degrees Mobile Limited (2degrees, previously NZ Communications) formally announced its
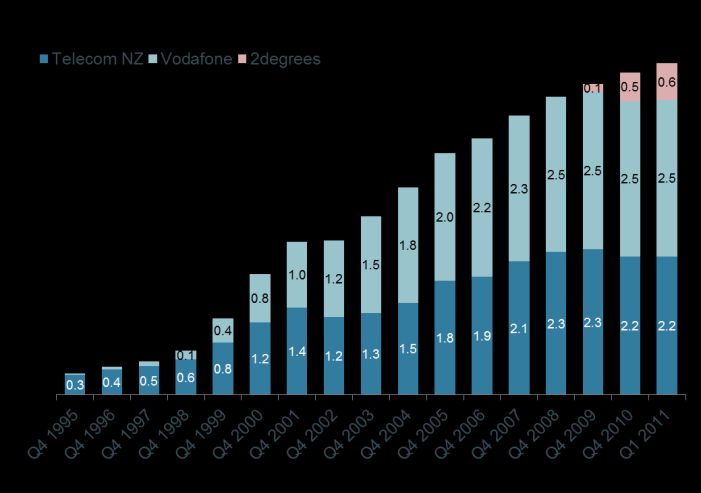
intention to enter the mobile market, setting its launch date for August that year. By March 2011, after just 19
months of retail operation, 2degrees had grown to 11% subscriber market share4.
Exhibit 2: NZ Mobile Subscribers by Carrier 1995-1Q 2011 (millions)
Source: Telecom and Vodafone annual reports, 2degrees
3
Vodafone and Telecom annual reports, 2003-2009
4
NBR, „2degrees big reveal: 580,112 customers‟, 22 March 2011
© Venture Consulting 2011. 5Economic Study – Competition in NZ Mobile Market
Exhibit 3: Closing Subscriber Shares, 2002-1Q 2011
Telecom and Vodafone annual reports, 2degrees
3.1.2 MVNO Market
In New Zealand, the current Mobile Virtual Network Operators (MVNOs) typically resell mobile voice and data
5
services via a wholesale arrangement with Vodafone or Telecom . MVNOs have had minimal impact on the
New Zealand mobile market, with none gaining substantial scale. TelstraClear is the largest MVNO with an
estimated 30,000 subscribers6. Other MVNOs include CallPlus/Slingshot, Compass, Orcon, Black+White and
Digital Island.
3.2 Regulation
In May 2006, the New Zealand Commerce Commission announced that it would examine the reasons for the
7
“lack of new entry in the mobile market” , signalling a clear intention to take substantial action on the issue.
Its October 2006 report found that significant barriers to entry were restricting the level of competition in the
mobile market8. Those barriers to entry included:
“The unavailability of spectrum in the 850/900 MHz range for new entrants”, raising the cost of entry9
(see section 3.4)
The investment required to build a network with near-equivalent network coverage to the incumbents.
This could deter a potential competitor from entering due to the increased risk of a costly exit, due to
the sunk costs, especially where existing players may respond aggressively to a new entrant 10.
5
While in New Zealand MVNOs are essentially distributors of mobile services offered by the network operators, overseas many MVNOs own
their own infrastructure, enabling them to compete more directly and differentiate itself as an independent service.
6
NBR, „Australia‟s M2 buys Vodafone NZ partner Black+White‟, 3 November 2010
7
Commerce, Commission, „Schedule 3 Investigation into the Extension of Regulation of Designated and Specified Services, Draft Report‟,
Mar 2006
8
Commerce Commission, „A Review of Cellular Mobile Market Entry Issues‟, Oct 2006
9
P39, Commerce Commission, „A Review of Cellular Mobile Market Entry Issues‟, Oct 2006
10
P14, Commerce Commission, „A Review of Cellular Mobile Market Entry Issues‟, Oct 2006
© Venture Consulting 2011. 6Economic Study – Competition in NZ Mobile Market
The high subscriber acquisition costs associated with highly penetrated mobile markets, since in
these markets subscribers need to be acquired from their existing mobile provider. This is particularly
difficult for a new entrant given that they would have to build up from a base of zero customers
The practice of setting different prices for on-net and off-net calls (also known as closed network
pricing), thereby disincentivising a mobile user from making calls or texting users on other networks.
In New Zealand, this has created „communities of interest‟ (or „closed calling circles‟)11.
12
Amendments to the Telecommunications Act implemented in December 2006 brought fundamental changes
to the New Zealand mobile market regulatory regime and the potential for increased competition. The changes
were designed to establish a market environment where it was possible for a third mobile operator to
commence operations and compete. Simultaneously, a regime of on-going telecommunications monitoring to
ensure regulatory compliance was also introduced.
Since then, the Commerce Commission has continued to move towards an open and competitive mobile
market, in an attempt to bring New Zealand in line with global mobile market best practice. Some of the most
significant changes, which facilitated the entry of a third mobile network operator, have included:
April 2007 – The introduction of mobile number portability. This enabled customers to retain their
phone number when changing network providers. Keeping a mobile number can have a significant
impact on a consumer‟s decision to change mobile providers.
April 2007 – Availability of 900 MHz spectrum. It took some time, and Cabinet intervention, for
2degrees to secure the spectrum required to launch commercial operations. Historically, under the
prevailing management rights regime, Telecom and Vodafone dominated the market for spectrum
(with Vodafone owning management rights to 100% of the usable 900 MHz spectrum). In July 2006
the Ministry of Economic Development published an internationally peer-reviewed report13 that
outlined potential approaches to spectrum allocation. In April 2007, Cabinet determined that a 7.5
MHz pair of 800/900 MHz spectrum should not be offered for renewal but offered by auction. As a
part of this process and with the investment of the Hautaki Trust, 2degrees acquired 27 MHz of
spectrum within the 800-950MHz, 1800MHz and 2100MHz ranges in five lots. This acquisition of
spectrum management rights enabled 2degrees to enter market in August 2009 as New Zealand‟s
3rd mobile network operator.
May 2011 – Regulation of mobile termination rates (MTRs). In November 2008 the Commerce
Commission commenced its investigation into whether the mobile termination rates operators charge
each other to terminate calls between their respective networks should be regulated, due to concerns
that a combination of above cost MTRs with significant on-net discounting makes it difficult for small
operators to compete. The Commission identified that the combination of above cost MTRs and
significant on-net discounting makes it difficult for small operators to set off-net retail prices that
match incumbent on-net retail prices and encourages incumbent operators to set high off-net retail
prices which reduced the number of calls that small operators receive (making the small network less
attractive). The Minister accepted the Commission's recommendation to regulate mobile termination
11
Note that January 2011 research carried out by Synovate Research for 2degrees shows that this often has the result of making consumers
feel that it is highly important for them to be on the same network as their family or friends making it significantly harder for a new entrant to
enter the market.
12
Telecommunications Amendment Act (No 2) 2006 with date of assent being 18 December 2006
13
PWC/NZIER, „Methodology for pricing the renewal of spectrum rights for cellular services‟, July 2006
© Venture Consulting 2011. 7Economic Study – Competition in NZ Mobile Market
rates in August 2010 and the Commission issued the regulated terms on which regulation would
apply on 5 May 2011.
Other initiatives, some of which were concluded against a regulatory or policy backdrop, include the
introduction of regimes governing national roaming, number range availability, prohibition on handset locking,
and the National Environmental Standards.
3.3 Effect of Low Competition on Consumers
New Zealand consumers have rapidly adopted mobile services. Mobile connections exceeded the
New Zealand population for the first time in 2007 (crossing 100% penetration). Today, penetration of mobile
connections in New Zealand is close to 120% of population. This places New Zealand near the average of
14 15
developed countries.
While the growth of mobile penetration in New Zealand has been strong, mobile call usage remains
significantly below that of similar markets. In 2009, New Zealand was ranked almost at the bottom
th 16
(49 out of 50 countries) for outgoing call minutes per user per month.
Exhibit 4: 2009 Minutes of Usage per Connection per Month
Source: Ovum
14
Merrill Lynch, „Voice and data divergence‟, June 2009
15
Ovum, February 2011, „Global Mobile Market Outlook 2010-15‟
16
Ibid
© Venture Consulting 2011. 8Economic Study – Competition in NZ Mobile Market
3.4 Assessing the Level of Competition in the New Zealand over Time
Between 2002 and 2008, and especially prior to 2007, New Zealand was consistently perceived by analysts to
be “uncompetitive”. They cited “high pricing compared to that experienced in more competitive markets”17.
We have looked at competition in the New Zealand mobile market based on three common indicators of
strong competition:
1. Pricing by comparison to other countries – low pricing and a continued downward pricing trend
suggest a high level of competition
2. EBITDA margins – in competitive markets margins remain lower as the value is passed on to
consumers
3. HHI (Herfindahl-Hirschman Index) – an indication of concentration of market power.
The overall picture from these three metrics should provide a clear indication of the level of competition in the
market.
OECD benchmarks and rankings provide valuable insight into New Zealand‟s performance. OECD
benchmarks compare three usage baskets representing typical low usage, medium usage and high usage
customers. Note that these baskets have been chosen to provide a cross-country comparison, which
compares like with like, and therefore do not represent the average usage profile in New Zealand. In fact, as
outlined above, New Zealand mobile users have very low mobile usage. Despite this, however, the tool is
useful and it shows that New Zealand has performed well below the OECD average in 2002, 200518 and
200819 when it was consistently amongst the bottom countries (i.e. higher priced) in the OECD. This is shown
in exhibit 5.
In November 2009 the Commerce Commission‟s Telecommunications Market Monitoring Report- Six Months
to June 2009 noted:
“The entry of 2degrees into the 2G prepaid market has brought lower prices. For the first time in the
Commission’s analysis New Zealand’s prepay prices are benchmarked at below the OECD average”.20
Exhibit 5: NZ Pricing vs. OECD Baskets (NZ Pricing as % of OECD average)
Source: Commerce Commission
17
IDC, „New Zealand Telecommunications Analysis 2008-2012‟, January 2008
18
P8, „Benchmarking the Comparative Performance of New Zealand‟s Telecommunications Regime‟, Ministry of Economic Development,
2005
19
P6, „Telecommunications Key Statistics – March Quarter 2008‟, Commerce Commission
20
P4, „Telecommunications Market Monitoring Report- Six Months to June 2009‟, Commerce Commission
© Venture Consulting 2011. 9Economic Study – Competition in NZ Mobile Market
There is limited information around the average mobile EBITDA margin that has been achieved in the market.
However, Telecom‟s annual report shows that mobile EBITDA margins were at 40% in FY03 (38% in 2001,
36% in 2002). Merrill Lynch estimates that the EBITDA service margin across the New Zealand market was at
21
43.3% in Q1 2009 . These are some of the highest margins in the developed world, again suggesting a low
level of competition.
New Zealand was the last OECD country to have just two mobile network operators (each on different
technology platforms), with most OECD countries having had three or more mobile networks for many years.
Merrill Lynch has calculated the HHI in June 2009 for Q2 2009. The HHI for the New Zealand mobile market
was calculated at 0.501, indicating a very high level of concentration of market power and hence low
competition. This ranks New Zealand as having amongst the highest concentration of power of the 25
countries that were analysed in Q2 2009.
Exhibit 6: Herfindahl-Hirschman Index, Developed Countries, Q2 2009
Source: Merrill Lynch
Therefore, the combined evidence of relatively high pricing, very high EBITDA margins and a high HHI
indicate that New Zealand has historically had an uncompetitive mobile market. This confirms the views of
other analysts and the Commerce Commission‟s October 2006 review, which found a „lack of effective
competition‟22. However, from 2006 (and especially from 2009) there have been improvements made to the
level of competition, which is demonstrated in pricing and churn levels.
3.5 Effect of 2degrees’ Entry on Pricing Behaviour
Both the improved regulatory environment and the entry of 2degrees into the market have had a significant
effect on pricing.
This can be seen directly in a tactical sense too. 2degrees has typically led prices lower and been first with
pricing initiatives. Prior to launch, the standard prepaid rate in New Zealand was 89c per minute. Upon its
launch in August 2009, 2degrees immediately made an impact by introducing standard rates of 44c per minute
(less than half the usual rate at the time).
21
Merrill Lynch, „Voice and data divergence‟, June 2009
22
P5, Commerce Commission, „A Review of Cellular Mobile Market Entry Issues‟, Oct 2006
© Venture Consulting 2011. 10Economic Study – Competition in NZ Mobile Market
Vodafone and, to a lesser extent, Telecom have often reacted directly to increased or imminent competition
and/or new plans and pricing offered by 2degrees. One example is the launch of top up bonuses on 2degrees‟
prepaid plans in August 2009. Shortly after this, in October 2009, Telecom introduced its own top up bonus on
prepaid.
2degrees launched its postpaid plans in September 2010. Its plans demonstrated significant value for many
users compared to other offerings in the market. 2degrees was the first in the market to enable customers to
carry over unused minutes through to the next month. For businesses, the $149 plan remains the only
available unlimited calling plan in the market.
Following the launch of 2degrees postpaid plans, more competitive postpaid offerings have been offered by
competitors. For example, in April 2011, Vodafone introduced its double up minutes promotion on selected
plans, offering a higher number of voice minutes for the same monthly rate.
In December 2010, less than 3 months after 2degrees launched 3G Mobile Broadband, Vodafone shifted its
price and GB offerings to match 2degrees and increased the standard life of data to 60 days.
As Vodafone and Telecom continue to operate in a more competitive market, rates in the overall market are
likely to continue to be under pressure, driven down by price competition. This continues to be of benefit not
just to 2degrees customers, but to all New Zealand mobile consumers.
© Venture Consulting 2011. 11Economic Study – Competition in NZ Mobile Market
4 Benefits of competition to the New Zealand Economy
4.1 Analysis and Methodology
In order to determine the benefit to the economy derived from the competitive market that has been delivered
through changes in regulation and the entry of 2degrees into the market we have undertaken the following
analysis:
1. Determined the total direct investment of both capital and reinvested revenues to date (and internal
forecasts for 2011) and modelled the likely direct expenditure over the 10 year horizon (2012-2021)
through analysis of 2degrees‟ accounts. This benefit has been calculated in terms of dollar
investments and jobs created.
2. Calculated the indirect / downstream economic benefits of related expenditure by 2degrees‟ suppliers
using 2degrees‟ vendor payments to New Zealand based companies from 2007 to 2011 (year to
date), combined with industry data from Statistics New Zealand. These benefits have been calculated
in dollar terms. We have also used Statistics New Zealand data to estimate the number of jobs
supported by this expenditure. This methodology has been carried forward to estimate the indirect
benefits which will be generated by future direct investment over the period from 2012-2021.
3. Calculated the value that has been delivered to consumers through increased competition
(the „Competition Dividend’), through direct savings and induced savings, to all New Zealand mobile
users to 2010.
In looking at historic and future benefits, we have adjusted all values to 2011 New Zealand dollars. For historic
numbers we have adjusted by the annual inflation rates from the RBNZ23. Future expenditure has been
adjusted by the average inflation rate in the 4 years to 2011 (3.2%).
4.2 Summary of Findings
A summary of our findings is below:
Exhibit 7: Value of new competition in the New Zealand Mobile Market ($‘000)
($’000 – 2011 dollars) 2007-2010 2011-2021* Total to 2021*
Direct Investment
580,300 4,700,000 5,300,000
Indirect Investment
297,700 3,100,000 3,400,000
Competition Dividend
1,365,000 1,400,000^
Note: To the nearest $100 million
*
^Note: The future competition dividend has not been forecast
23
RBNZ, „Inflation Calculator‟, http://www.rbnz.govt.nz/
© Venture Consulting 2011. 12Economic Study – Competition in NZ Mobile Market
4.3 Direct Contribution and Employment
Exhibit 8: Direct Expenditure ($‘000)
($’000 – 2011 dollars) 2007-2008 2009-2010 2011-2021 Total to 2021
(Pre-launch (Operations
Construction to date)
phase)
Capex 26,300 230,500
3,700,000* 4,200,000*
Opex 17,200 194,400
Contributions to 45,000 67,000 1,000,000* 1,100,000*
Government24
*Note: To the nearest $100 million
The direct contribution made through the entry of 2degrees has been calculated based on the total sum of
expenditure, both capital expenditure and operational expenditure. This includes network build costs, wages to
employees and commissions to partners.
Since 2007 2degrees has directly invested more than $580 million in the New Zealand economy, through
capital construction and through partnerships with the local retail and services industries. Additionally,
2degrees has directly supported the creation of 574 FTE jobs. The exhibit below outlines the investment from
2degrees from early network construction in 2007 to 2010:
Exhibit 9: Total Expenditure (2007-2010) $m
24
GST and company tax.
© Venture Consulting 2011. 13Economic Study – Competition in NZ Mobile Market
The exhibit below breaks down the historic expenditure in more detail:
Exhibit 10: Expenditure by category (2007-2010) ($‘000)
2007 2008 2009 2010
Construction 913 23,191 102,462 114,690
Site Costs 6,341 6,551
Wages 4,734 10,830 16,431 26,400
FTEs 67 153 231 372
OPEX - - 14,973 113,265
Government 15,012 25,551 40,290 22,709
TOTAL 20,659 59,572 180,497 283,615
To estimate the likely future direct contributions we employed exactly the same methodology, based upon
2degrees‟ internal management forecasts. On this basis, future benefits are estimated to be $5.3 billion
(to the nearest $100 million). In addition, it is estimated that the 2degrees workforce will grow to 850-900 FTE
employees over the next 10 years. For reasons of commercial confidentiality, this report does not detail the
components or conditions of these future benefits.
4.4 Indirect Contribution and Employment
Exhibit 11: Indirect Expenditure ($‘000)
2007-2008 2009-2010
($’000 – 2011 dollars) (Construction (Operations to 2011-2021 Total to 2021
phase) 2010)
Suppliers 14,000 50,000 1,000,000* 1,100,000*
Multiplier Effect on Private
22,000 212,000 2,100,000* 2,300,000*
Investment
*Note: To the nearest $100 million
2degrees is a supporter of many other businesses through its on-going supplier relationships – large-scale
construction companies, import and freight companies, multinational service industry providers, as well as
multi-brand retailers and small business such as dairies and convenience stores.
© Venture Consulting 2011. 14Economic Study – Competition in NZ Mobile Market
The expenditure with these businesses generates in turn additional investment and expenditure with other
businesses as well as additional tax revenue for the government, multiplying the effect of 2degrees
expenditure.
In order to quantify the value of this indirect contribution, we reviewed 2degrees‟ vendor payments 2008-2011.
We examined in detail those vendors with whom 2degrees spent $50,000 or more in any financial year. This
accounts for a significant portion of the total vendor payments in all years. These vendors were categorised:
Construction Related
Equipment / IT vendors
Services
Retailers
Excluded (foreign entities, other excluded payments)
Excluded vendors included payments made to foreign based companies (i.e. those not registered as a
business in New Zealand), payments to telecommunications companies and payments to businesses that are
less likely to generate incremental investment into the New Zealand economy. Excluded payments
represented roughly 35% of 2degrees expenditure to date.
The remaining expenditure was then totalled. For reasons of commercial confidentiality the names of vendors
and the value of payments made to them cannot be released as a part of this report. Additionally it was
assumed that „smaller vendors‟, for whom payments never totalled more than $50,000, had a similar
breakdown into the above 5 categories as the larger vendors.
For each of the construction, equipment/IT, services and retailers categories, we estimated the proportion of
2degrees‟ payments that would be used to fund further investments to other businesses – the indirect
investment from suppliers. This estimate has been based on extracting the estimated value added for each
type of business.
To do this, first we classified each of the larger vendors (those that had at least $50,000 of payments from
2degrees in at least one year between 2008 and 2011) according to the ANZSIC 1996 classification25 to find
the estimated value added for that vendor (based on the average value add – as a proportion of gross outputs
– across the vendor‟s industry). A weighted average of value added proportion was then calculated for each of
the four industry groups above based on the classification of the vendors within the grouping and the relative
size. This estimated value added proportion was then used to calculate the total value added for all vendors in
the industry group, including larger vendors ($50,000 plus in at least one year) and the estimated spend by
„smaller vendors‟. The estimated value added for that industry group was then subtracted from 2degrees‟
vendor payments, leaving the estimated payments from 2degrees that would subsequently be spent with the
suppliers to 2degrees‟ vendors.
From 2007 to 2010, the indirect benefit of 2degrees expenditure to the NZ economy is $64 million.
It should be noted in this analysis that it is possible that some of this $64 million in inputs is sourced from
foreign companies - without a detailed audit of the accounts of each of the vendors, we do not have the
information required to discount this foreign expenditure. However, the inverse is also true - for each of the
foreign vendors excluded from this analysis, there will be domestic spend which has not been counted.
On balance we believe our approach is a fair calculation of the likely indirect value that 2degrees‟ expenditure
generates.
25
Statistics New Zealand, „ANZSIC Industrial Classification 1996‟
© Venture Consulting 2011. 15Economic Study – Competition in NZ Mobile Market
It is difficult to accurately forecast both the level of expenditure and the exact identity of the vendors with which
the expenditure will be spent. We have reviewed the historical spend with vendors and compared this to
corresponding drivers in direct benefits (for example the historical vendor payments to retailers have been
compared to the total commissions paid between 2008 and 2011). Based on this historical trend and
relationship between internal business costs and included vendor payments and having analysed a range of
internal business forecasts, we have forecast vendor payments for each of the four industry groups. Using this
approach we have determined the likely future indirect contribution to the NZ economy will be $1 billion
(to the nearest $100 million).
Expenditure with vendors not only generates further spend with other vendors; it also contributes to the
employment of Kiwis within those companies. In order to quantify the level of employment supported by
2degrees‟ expenditure we used Statistics New Zealand average wage figures and the percentage of revenue
which is spent on wages for each of the four industry groups to determine the dollar value of 2degrees‟
expenditure that has directly contributed to jobs in the NZ economy. Using this approach we have determined
that 2degrees‟ expenditure has supported an average of 230 FTE jobs since 2007 and will support an
additional 610 FTE jobs over the ten year horizon.
Using figures from the OECD for the multiplier effect of cash in the economy we have calculated that the
spend by 2degrees‟ vendors, both with their suppliers and in the form of wages together with the wages paid
by 2degrees directly to its staff, has generated an additional $233 million to 2010 and will generate
$2.1 billion between 2011 and 2021.
This brings the total indirect benefits generated by 2degrees from 2007-2021 to $3.4 billion.
4.5 Competition Dividend
Exhibit 12: Direct and induced value of the competition dividend ($‘000)
($’000 – 2011 dollars) 2007-2010
Direct 1,225,400
Induced 139,600
Total 1,3645,000
As outlined in section 3.3 of this report, 2006 and 2007 saw a large number of regulatory changes in the
New Zealand mobile market. These changes were primarily focused on the creation of a regulatory framework
which would encourage and facilitate the entry of a third player into the market in order to foster competition.
Competition in the mobile market benefits all New Zealand mobile consumers, irrespective of their carrier, as it
drives price decreases (see sections 3.5 and 3.6) together with innovation and investment.
The entry of 2degrees was clearly flagged (and facilitated by) the regulatory changes, and the competitive
dynamics in the market started to shift in anticipation of its entry shortly afterwards. In March 2007, NZ
Communications had announced its intention to build New Zealand‟s third mobile network, having signed a
26
contract with Huawei .
26 th
Cellular News, „New Zealand Operator Signs Huawei Contract‟, 29 March 2007
© Venture Consulting 2011. 16Economic Study – Competition in NZ Mobile Market
In addition, it was also reported that NZ Communications had received substantial capital from private
27
equity , and was continuing to negotiate a roaming agreement with Vodafone. It was therefore becoming
clear to the telecommunications market that a new entrant was imminent. We have therefore determined that,
on balance, mid 2007 is the date from which the changes to regulation and the imminent threat of a third
operator had a significant impact upon the behaviour and pricing of incumbent operators.
Therefore, in order to quantify the consumer benefits brought about by the regulatory shift and subsequent
market entry of 2degrees, we have calculated the consumer surplus gains since quarter 3 of 2007. This period
captures the full impact of the New Zealand Government‟s regulatory push to enable competition into the
mobile market, which can be seen both as direct reductions in costs and as an increase in call minutes prior to
its entry.
To ensure that all pricing benefits across the market that result from improved competition are captured, we
have considered metrics at a market wide level – determining the average consumer spend on mobile voice
services (voice ARPU), the average minutes of use and the average price per minute of use, each from 2004
to 2011. A forecast of market pricing without the regulatory changes and subsequent entry of 2degrees was
created using the trend of prices from 2004 - Q2 2007. This was then compared to the actual price per minute
over the same period to determine the consumer saving from increased competition. By 2011, the gap
between the previous trend line and the actual price per minute that New Zealand mobile consumers were
paying demonstrated a 25% savings on call costs.
Exhibit 13: New Zealand Mobile Market – Cost Per Minute (Voice Calls) ($)
As call rates improved over the period from July 2007, there was also an increase in the number of minutes of
usage (since there is an increase in the quantity demanded). Therefore there are two parts to the consumer
benefit created. First, the „direct savings‟ which arise from reduced rates based on the minutes of usage that
would have occurred had there been no additional decrease in rates beyond the trend (the minutes of usage
that would have occurred is estimated here by the trend line for minutes of usage from 2004 – Q2 2007,
27 th
Scoop, „NZ Communications Signs Deal With Chinese‟, 27 March 2007
© Venture Consulting 2011. 17Economic Study – Competition in NZ Mobile Market
shown in exhibit 14). Secondly, there is the value provided on the additional calls that are made due to the
increase in quantity demanded. That is, the „induced savings‟.
Exhibit 14: New Zealand Mobile Market – Minutes of Use per Connection per Month
Exhibit 15: Consumer Benefit Methodology
This is also seen in the demand curve in exhibit 15. This demand curve represents the quantity of call minutes
demanded at each price point. With a fall in mobile voice call prices, there is a higher quantity demanded.
© Venture Consulting 2011. 18Economic Study – Competition in NZ Mobile Market
Post 2degrees‟ entry, the market price in year t is pt, with the corresponding volume of call minutes being qt.
*
A higher price that would have been charged without competition is illustrated by pt with the corresponding
lower demand being qt*. So (assuming a linear demand curve), the gain in the consumer surplus is the sum of
the rectangular area A (representing „direct savings‟) and the triangular area B (representing „induced
savings‟).
Therefore, the model calculates the „direct savings‟ to consumers (the area of rectangle A) as:
qt*x (pt*-pt)
The induced savings (triangle B) are calculated as:
0.5 x(qt-qt*) x (pt*-pt).
This estimates the additional consumer surplus associated with the increase in demand that is stimulated by
the price reduction – i.e. it reflects the difference between the consumers‟ valuation of the service and the
price paid for each additional unit purchased.
Using this methodology we have determined that since Q3 2007 there has been a direct benefit to
New Zealand mobile consumers of $1.26 billion in savings and additional value in plan inclusions.
Further, we estimate there has been an induced savings of $140 million, bringing the total dividend from
increased competition to $1.36 billion.
© Venture Consulting 2011. 19Economic Study – Competition in NZ Mobile Market
5 Intangible Benefits of Competition
In order to keep our estimates of the value of improved competition in the New Zealand mobile market and the
entry of 2degrees conservative, there are a number of other key benefits for which we have not incorporated
into our detailed modelling.
5.1 Future Competition Dividend
28
Concept Economics‟ study in 2009 showed that when a new entrant has entered the market in international
markets, price declines of between 21% (Australia) and 60% (Sweden) have been experienced (with UK
having experienced 40% price declines). So it can be shown that the discount seen in pricing to date (25% by
2011) is at the low end of what has been experienced internationally with the arrival of a new entrant.
Therefore, it is likely that consumer value may continue to be unlocked with further price discounting in the
market as 2degrees continues to grow.
However, as the on-going benefit of price reductions brought about by competition would inherently be more
subjective than the benefit to date, we have not included a forecast for this. However, our estimate for the
future „competition dividend‟ would be in the range of $3-5 billion, based on a combination of analyst forecasts,
international experience and our own analysis.
5.2 Improvements in Pricing for Other Mobile Services
It was determined that we would not include any pricing benefits for either SMS messaging or for mobile data.
Though it is highly likely that 2degrees‟ existence in the mobile market has placed pressure on the mobile data
market, the uptake of mobile data services was minimal prior to 2009 and it is therefore difficult to quantify
what the pricing in the market may have been without 2degrees and hence it is also difficult to quantify the
benefit to consumers. 2degrees‟ launch of mobile broadband plans in August 2010 brought significant
discounts to other operators‟ plans offering 3GB for $50 (which could be used over 60 days) and shortly
thereafter introduced a 12GB for $120 (over 120 days). Standard prepaid rates prior to the entry of 2degrees
were 20 cents per SMS – At launch, 2degrees brought in plans that priced SMSs at just 9 cents per text.
These plans continue to lead the market in August 2011 further demonstrating the price leadership that
2degrees takes in the market and which is indicative of the benefit to consumers.
5.3 Improvements in Non-Price Competition for Mobile Services
Competition between mobile networks extends well beyond price. The increase in competition that results
from having a third mobile network in New Zealand therefore brings a range of non-price benefits to
consumers and businesses. Specific types of non-price benefits that could result from the entry of the third
mobile network operator include:
Improved quality of service – There will be increased pressure to provide enhanced network quality and
customer service.
Innovation – Mobile operators will have heightened incentives to offer innovative services to consumers
and business in order to win their custom.
Faster adoption – Lower prices bring forward the adoption rate of new technologies, such as mobile
broadband. In addition, the intensified competition may well bring forward network investments (e.g., in
LTE) making new services available earlier than would have occurred under a duopoly.
28
P12, „Assessment of the Consumer Benefits of Mobile Termination Regulation in New Zealand‟, Concept Economics, July 2009
© Venture Consulting 2011. 20Economic Study – Competition in NZ Mobile Market
Coverage pressure – Coverage is a further service dimension over which firms compete. As 2degrees
improves its coverage in urban areas and pushes its network into regional areas, the incumbents will be
incentivised to respond through increasing their own coverage.
Network redundancy – A third network provides a further back-up source of communication in the event
of emergency or in the event of network failures of one or more of the incumbent networks.
The importance of this has become apparent over the past two years.
Due to the complexity of the analysis required, we have not sought to quantify the benefits of enhanced non-
price competition.
5.4 Improvements in Pricing for Fixed Line Services
Improvements to mobile competition can also have a flow on effect to fixed line telecommunications.
While fixed line and mobile services are not direct substitutes, fixed to mobile substitution is an observed
29
consequence of the availability of mobile services , especially where mobile services are supplied at a rate
competitive to fixed line pricing. This will mean that improved mobile pricing can have the effect of decreasing
fixed pricing too (through a shift in supply). However to date there has been little improvement in fixed call
pricing in New Zealand. Therefore, we have not included any benefit for improvements to fixed pricing.
5.5 Productivity Gains to the Economy
Numerous international studies have shown that mobile users can achieve gains in productivity as a result of
their mobile usage. This is a result of reducing need for travel (saving time and expenditure on travel) and
improved efficiency while travelling or working off-site.
McKinsey research (2006) demonstrated a 6% improvement in productivity for Chinese workers as a result of
mobile usage in China based on work time saved30. Econtech (2007) found that companies (within their
survey) on Telstra‟s Next G network in Australia received an average 9.3% increase in productivity (compared
to their previous mobile network). All users surveyed reported some productivity gains – between 1.1% and
27.3%31. Econtech noted that the participants may have been more likely to benefit from the Next G network
than the wider user base.
Therefore, in addition to the direct savings provided to consumers through improved competition, there will be
a further productivity benefit as mobile users increase their usage in response to the reduced prices.
It is difficult to quantify the benefit to the New Zealand economy from these expected improvements in
productivity. To be conservative we have not included any productivity gains in our core analysis, however
they are potentially significant.
29
OECD,‟OECD Communications Outlook 2007‟
30
McKinsey Research, „Wireless Unbound‟, The Surprising Economic Value and Untapped Potential of the Mobile Phone‟, December 2006
31
Econtech, „Productivity Gains of Next G: Results on the Customer Survey‟, December 2007
© Venture Consulting 2011. 21Economic Study – Competition in NZ Mobile Market
6 Concluding Remarks
The last 5 years have seen significant progress in developing a competitive mobile market in New Zealand.
Since Q3 2007 there has been a direct benefit to New Zealand mobile consumers of $1.36 billion, brought
about through increased competition. This saving represents a saving of approximately 21% during the period.
2degrees has directly contributed $580 million to the New Zealand economy to December 2010, and can be
expected to invest a further $4.7 billion over the 10 year horizon. This investment will generate a further
$3.1 billion dollars for the New Zealand economy. This expenditure will support more than 1,460 FTE jobs
directly and indirectly.
With regulators clearly identifying the issues in 2006 and committing to act to encourage new investments into
the market, the New Zealand economy has benefited with the entry of 2degrees. 2degrees has invested in a
new mobile network for New Zealanders and delivered substantial savings to its own customers, while also
leading the market towards lower pricing. This is reflected in our analysis, which shows that this investment
has created significant value for the New Zealand economy and underlines the importance of competition in
the market.
While there has been significant progress, there still is further action that can be taken to achieve global
mobile market regulatory best practise thereby ensuring a sustainable competitive mobile market environment
in New Zealand. In its review of the New Zealand mobile market in October 2006, as well as subsequent
reviews, the Commerce Commission has noted a number of key requirements to drive long term competition
in mobile markets, eliminating potential barriers to entry.
Certain factors identified by the Commerce Commission in 2006 as inhibiting competition in the mobile market
remain unresolved. These include access to radio spectrum32 and high differentials between on-net and off-
net pricing33, both of which are subject to current regulatory and policy considerations. For example, the
allocation of the digital dividend spectrum in the 700 MHz band presents an opportunity encourage
competition and should be used to address historical inequities in spectrum holdings between operators.
The Commerce Commission also continues to monitor on-net/off-net price differentials and has indicated it will
intervene further if cost-based mobile termination rates fail to address competition concerns identified during
the mobile termination rate inquiry.
As outlined in section 3.4 the Commission has made significant progress in working towards a regulatory
environment, which is in line with global best practise and promotes competition. This has been a major factor
in delivering the value to New Zealand consumers and the wider economy that has been demonstrated in
section 5 of this report.
32
P12-14, Commerce Commission, „A Review of Cellular Mobile Market Entry Issues‟, Oct 2006
33
P16, 17, Commerce Commission, „A Review of Cellular Mobile Market Entry Issues‟, Oct 2006
© Venture Consulting 2011. 22You can also read