WHAT HAPPENED TO THE COVID COHORT? - Lessons for levelling up in 2021 and beyond - UCAS
←
→
Page content transcription
If your browser does not render page correctly, please read the page content below

WHAT
HAPPENED TO
THE COVID
COHORT?
Lessons for levelling up
in 2021 and beyond

1

    WIDENING ACCESS AND PARTICIPATION (WP) IS
    ABOUT ENSURING THAT FUTURE GENERATIONS HAVE
    EQUAL OPPORTUNITIES TO ACCESS AND SUCCEED IN
    HIGHER EDUCATION (HE).

    FOR UCAS, WP IS ABOUT SUPPORTING EVERYONE
    WITH THE POTENTIAL TO BENEFIT FROM HE TO MAKE
    ASPIRATIONAL CHOICES ABOUT THEIR NEXT STEPS,
    REGARDLESS OF THEIR BACKGROUND AND ACCESS
    TO SUPPORT.
2

EXECUTIVE SUMMARY
The impact of COVID on students, especially those from a                                           Tackle the impending squeeze on HE and apprenticeship places:
disadvantaged background, was one of the biggest concerns the                                      Progress in narrowing the gap between the most and least advantaged
education sector faced this year, with many, such as the Education                                 has slowed since 2015. This, combined with a rising 18 year old
Endowment Foundation (EEF), fearing that the progress seen over the                                population (around 90,000 additional applicants are forecast by 2025),
past decade would be reversed1. Despite school closures as the nation                              presents a potential pinch on HE and apprenticeship places. Without
went into lockdown and huge variation in learning experiences – 77%                                growth in post-secondary education places, competition will increase.
of applicants reported they had been personally impacted by COVID2 –                               Those from disadvantaged backgrounds are much more likely to be at the
more students from the most disadvantaged backgrounds across the UK                                lower end of the attainment spectrum, with 13.4% of 18 year old POLAR4
entered HE in 2020 than ever before. This was reflected even in the most                           Q1 (the most disadvantaged) applicants achieving grades below CCC at
selective universities and courses.                                                                A level in 2020, double that of their advantaged peers in POLAR4 Q5 –
                                                                                                   therefore, without action, there is real potential for this capacity squeeze
This happened for several reasons: students (particularly mature                                   to have a greater impact on disadvantaged students.
students) saw higher education (HE) as a stable option during a
turbulent time for the labour market, more students met the terms of                               Levelling up opportunity to access education: Analysis within this
their offers on ‘centre assessment grades’ (‘estimations’ in Scotland) than                        report models the scale of change required to deliver a step change
on their original exam results, the government increased capacity across                           in social justice. The annual admission of 70 more of the most
HE, and there was an immense UK-wide effort to offer more support                                  disadvantaged English 18 year old pupils to each higher tariff provider
than ever to the COVID cohort.                                                                     could all but eliminate the equality gap highlighted through UCAS’
                                                                                                   multiple equality measure (MEM) in just a decade. In 2020, each
Despite progress against the odds, the following challenges remain – and                           higher tariff provider accepted an average of 75 students from such
these are where we all must now focus our efforts:                                                 backgrounds. Based on this current rate of progress, the gap would not be
                                                                                                   eliminated until 2352 – taking 332 years.
Learn lessons from 2020 to support the class of 2021: Students
hoping to go to university or college in autumn 2021 are playing catch-                            The majority of analysis in this report covers UK 18 year old students.
up, both academically and in defining their next steps. Without sustained                          Where age or domicile differs from this, it is explicitly referenced in the
effort, they may become the forgotten COVID cohort – less visible than                             text or accompanying footnotes3. The recommendations accompanying
last year’s entrants, but arguably starting from an equally bad or worse                           this report are designed to propose practical steps that, taken together,
position. Ensuring disadvantaged students are supported in accessing HE                            will ensure the lessons learnt from 2020 endure into 2021 and beyond.
in 2021 will be critical, especially those who have experienced significant                        The recommendations are relevant to UCAS, universities, colleges, schools,
educational disruption.                                                                            expert groups, and government policy.

1
    https://educationendowmentfoundation.org.uk/public/files/REA_-_Impact_of_school_closures_on_the_attainment_gap_summary.pdf
2
    UCAS / Youthsight survey of 17-19 year old applicants.
3
  The major exception is analysis using the UCAS MEM, free school meals (FSM), and ethnic group, which is carried out using the National Pupil Database (NPD, source: Department for
Education), and so is limited to English domiciled 18 year old students only. Further information on this, rounding, and other inclusion criteria, can be found in the Technical Appendix at the
end of this document.
3

    KEY 2020 INSIGHTS
    >   The UK 18 year old entry rate rose to a record 37.0%, from 34.1% in
        2019.

    >   Record UK application (41.5% for 18 year olds) and acceptance
        rates (89.1% for 18 year olds), resulting in growth in participation
        across all POLAR4 groups.

    >   The UCAS MEM equality gap narrowed, with the most advantaged
        English school pupils (group five) 4.23 times more likely to enter HE
        than the most disadvantaged (group one), compared to 4.40 times
        in 2019. The gap from 2010 has now narrowed by 26.4%.

    >   Record numbers of 18 year old acceptances from the lowest
        participation areas: 29,020 UK students from POLAR4 Q1, 1,645
        Scottish students from SIMD Q1, and over 14,000 acceptances of
        18 year old English pupils receiving free school meals (FSM).

    >   Significant growth in mature student acceptances, reflecting a
        demand for up- and re-skilling as the economy entered recession –
        the work of doctors, medical professionals, and NHS staff inspired
        applications to health and social care programmes, including
        nursing. Mature students (aged 21 or over) significantly increased to
        114,440, representing the largest single year growth since 2009.

    >   Higher tariff providers and medicine courses accepted more
        disadvantaged students, with the MEM entry rate ratio for English
        18 year old applicants to medicine narrowing. Nonetheless, the
        equality gap remains stark – advantaged students remain nearly 25
        times more likely than their disadvantaged peers to be placed on
        medicine courses.

    >   A record number of students declaring disabilities, mental health
        conditions, or specific learning difficulties were accepted into HE.
        Nearly 4% of UK applicants now flag a mental health condition in
        their application, with a 10.4% increase in the number of accepted
        applicants declaring in 2020.

    >   Regional gaps in entry persist, with 49.1% of London-based 18 year
        olds entering HE, compared to 32.4% of those from the South West.
Explore all the end of cycle data and view the definition of key terms in our interactive dashboard on ucas.com                                                   4

The report therefore recommends:

  IN THE SHORT TERM, 2021

  1       Sustain efforts made in 2020 recognising the significant challenge facing those looking to progress to HE in 2021 by:                                          UCAS, policymakers, qualification
          >    maintaining the uplift in capacity in HE places and improved support for employers to take on apprentices or offer T Level placements                     regulators in each devolved nation,
                                                                                                                                                                         schools, universities, and colleges.
          >    prioritising catch-up arrangements, including national online programmes
          >    recognising educational disruption in the assessment and awarding of qualifications
          >    demonstrating flexibility where at all possible

  2       Adopt UCAS’ MEM as the default mechanism for measuring participation, providing a true sense of progress.                                                      UCAS, policymakers, and higher
                                                                                                                                                                         education regulators in each devolved
                                                                                                                                                                         nation, universities, and colleges.

  3       Promote sharing of information at the application stage, including that related to disability, learning difference and mental health, by building confidence   UCAS, expert groups, and outreach
          in students to trust that UCAS and universities and colleges will use this information to arrange appropriate support and inform future improvements.          organisations such as HELOA

   IN THE MEDIUM TO LONG TERM, 2022-2025

  4       Enhance understanding of an individual’s circumstances through improving the information UCAS collects from applicants, including disability, learning         UCAS, expert groups, and charities
          difference and mental health, gender identity, free school meal status, refugee status, whether they are veterans or Service children, have care or
          parenting responsibilities, or are estranged from their parents.

  5       Better tailor course provision and support to account for each applicant’s need. In light of rising numbers, this is especially relevant for mature students   Universities and colleges
          and those with mental health conditions, learning differences or disabilities – who are among those most likely to drop out. For subject areas where
          mental health declarations are low, target messaging to improve visibility of support.

  6       Increase the number of HE places and apprenticeships to reflect the growing 18 year old population and ensure disadvantaged students do not miss out           Policymakers, universities, and colleges
          as a result of increased competition.

  7       Consider how a post-qualification admissions system might improve the application experience and outcomes for disadvantaged students. HE admissions            Policymakers, UCAS, universities,
          reform should be used as an opportunity to explore how technical education and apprenticeships could be integrated into the UCAS application process.          colleges, and schools

  8       Explore the benefits of a UK shared apprenticeships admissions service to enable students to consider and connect to all post-secondary education              UCAS
          options in a single location.

The analysis and recommendations contained in this report are anchored in UCAS’ strategy, Discover Your Future, which sets out our aim to support students in exploring all post-secondary
education options, including apprenticeships, higher technical qualifications, and part-time study.
5

    SECTION 1: WHAT HAPPENED IN 2020?
                                      With students outside of a formal education setting since March, there                                 oversimplify.
                                      were concerns that less support would mean many young people would
                                      struggle to make their next step after school or college. In May, the Sutton
                                      Trust4 published evidence on the inequality of access to information and
    SUMMARY                           advice, digital poverty, financial uncertainties, and varying school and
    >   Despite a decade of           college support. The EEF published similar research5, noting that ‘school
        progress in WP, headway       closures are likely to reverse progress made to narrow the gap in the last
        has slowed in more recent     decade.’ This was against the backdrop of findings from the Education
                                                                                                                                                                                       Free
        years, with the MEM           Policy Institute (EPI) Education in England: Annual Report 20206 that
                                                                                                                                                                                   School Meal
        equality gap narrowing by     suggested the stalling of the gap at secondary level had occurred even
                                                                                                                                                                                     Status
        an average of 1.1% year       before the COVID pandemic had impacted the education system.
                                                                                                                                                                                      (FSM)
        on year since 2015 versus                                                                                                                                                                                Index of
                                      2020 saw a continuation of gradual progress in WP in HE, with record entry
        4.4% across the previous                                                                                                                                                                                 multiple
                                      rates among the lowest participation areas (using the POLAR4 and SIMD                                                Ethnicity
        five years.                                                                                                                                                                                             deprivation
                                      measures) and those receiving free school meals (FSM). The number of
                                      mature students (aged 21 or over) entering HE also significantly increased                                                                                                  (IMD)
    >   2020 sees a continuation
        of gradual progress in        to 114,440, the largest single year growth since 2009.
        WP. This holds true at                                                                                                                                                        MEM
                                      Regarding ethnicity, the overall entry rate for Black students reached
        sector-level and across
                                      47.5%. Entry to higher tariff providers, where historically entry has been
        all tariff groups and most
                                      low, also reached a record level, with 10.2% of Black students entering
        measures.                                                                                                                                           Gender                                                POLAR3
                                      this group of providers. However, the Black ethnic group remains the least
    >   Placed numbers of mature      likely to enter higher tariff providers – 3.94 times less likely than those
        students (aged 21 or over)    from the Chinese ethnic group.
        significantly increased to                                                                                                                                                  School type
                                      While the progress in each of these groups is important to note, to really
        114,440, the largest single
                                      understand the full impact of the pandemic in 2020 we must consider
        year growth since 2009
                                      all the different aspects of disadvantage. To do this, UCAS developed
        (+7,000).
                                      the multiple equality measure (MEM)7 in 2015. This approach avoids
                                                                                                                                             FIGURE 1: Equality factors included in the UCAS MEM
    >   Record numbers of English     focusing on one measure or metric, which can create blind spots or
        18 year old students from
        the most disadvantaged        4
                                          www.suttontrust.com/wp-content/uploads/2020/05/COVID-19-and-Social-Mobility-Impact-Brief-2.pdf
        backgrounds were
        accepted onto medicine        5
                                          https://educationendowmentfoundation.org.uk/public/files/REA_-_Impact_of_school_closures_on_the_attainment_gap_summary.pdf
        courses in 2020.              6
                                          https://epi.org.uk/publications-and-research/education-in-england-annual-report-2020/
                                      7
                                           s discussed in the linked report, the MEM is derived using data available in the National Pupil Database (NPD, source: DfE), and, as such, its constituent variables are limited to those
                                          A
                                          available in this data set. UCAS is continuously looking to develop the MEM by improving and expanding the data fields included, when possible.
6

                                                                                           Participation in higher tariff providers has always been a key measure of progress in WP. The following tables
THE EQUALITY GAP NARROWED ACROSS ALL                                                       illustrate entry rate ratios for various equality measures. The value of the entry rate ratio indicates how many times
TARIFF GROUPS AND MOST MEASURES                                                            more likely the advantaged group is to enter HE than the disadvantaged group, and colour shading shows whether
                                                                                           2020 saw a widening (red), plateauing (orange), or narrowing (green) of the equality gaps.

                                                                                           Overall, the challenge is greater for higher tariff providers across most measures, namely POLAR4, SIMD, MEM, FSM,
                                                                                           and ethnicity. Gender is the prominent exception, where the gap is widest at lower tariff providers, while medium
                                                                                           tariff providers see a notable difference in geographical inequality by region. The year-on-year picture is broadly
                                                                                           positive across tariff groups with only FSM plateauing, and the geographical region and gender gaps widening.

                                                                                                                     POLAR4 (UK domiciled)              SIMD (Scottish            MEM (English domiciled)        FSM (English domiciled)
                                                                                                                           (Q5:Q1)                    domiciled) (Q5:Q1)          (Group five: Group one)           (Non-FSM: FSM)

                                                                                               Overall                          2.20                           2.99                           4.23                            1.88

                                                                                               Higher tariff                    4.70                           3.19                          12.02                            3.15

                                                                                               Medium tariff                    1.92                           2.68                           3.86                            1.98

                                                                                               Lower tariff                     1.05                            -*8                           1.59                            1.31

                                                                                           TABLE 1: 2020 entry rate ratios for POLAR4, SIMD, MEM, and FSM

                                                                                                                                     Men                                    Women                        Entry rate ratio (Women:Men)

FIGURE 2: Entry rate ratio between the most and least advantaged students entering HE by       Overall                              31.3%                                    43.0%                                     1.38
provider type (2006-2020)
                                                                                               Higher tariff                        11.4%                                    15.3%                                     1.34
There were increases in acceptances across all MEM groups in 2020.                             Medium tariff                        10.7%                                    14.0%                                     1.30
Importantly, the entry rate of students in MEM group one (the most
                                                                                               Lower tariff                          9.2%                                    13.8%                                     1.50
disadvantaged group) increased by 9.3% proportionally, to 14.4% overall.
As a result, while the equality gap measured by UCAS’ MEM remains                          TABLE 2: 2020 entry rates and entry rate ratios for gender (UK domiciled)
substantial, it is the lowest on record, with 2020 reporting the largest
single year proportional decrease since 2014. Nonetheless, and as Figure
2 above shows, headway has slowed in more recent years, with the MEM
equality gap narrowing by an average of 1.1% year on year since 2015                       8
                                                                                               I n 2020, there were only ten SIMD quintile 1 acceptances and 30 quintile 5 acceptances to lower tariff providers. As such, the SIMD entry
versus 4.4% across the previous five years.                                                     rates to lower tariff providers are too small to determine a statistically reliable entry rate ratio. The value of the ratio in 2020 is 3.29
7
Entry rate ratio OUTCOMES FOR DISADVANTAGED STUDENTS
(ethnic group
with highest
LOOKING TO STUDY IN THE MOST SELECTIVE
Any other
Asian Black Chinese Mixed White
entry rate: PROVIDERS AND MEDICINE COURSES IMPROVED
ethnic Group ethnic group
with lowest
IN 2020
entry rate in By the end of the 2020 cycle, 1,925 POLAR4 Q1 applicants were placed in
2020)
15 of the most selective universities and colleges9 – a 34.8% increase on
Overall 46.6% 53.1% 47.5% 71.7% 39.0% 32.6% 2.20 the previous cycle. In total, 34,045 UK 18 year old students were placed at
this group of providers by the end of the 2020 cycle – an 18.5% increase
Higher tariff 13.0% 14.2% 10.2% 40.2% 13.0% 10.7% 3.95
on 2019.
Medium tariff 17.2% 17.6% 17.5% 19.6% 13.1% 10.9% 1.80
Medicine remained one of the most competitive subjects in 2020, with
Lower tariff 16.5% 21.3% 19.9% 12.0% 12.9% 10.9% 1.95 only just over a third (34.9%) of choices made by English 18 year olds
applicants resulting in an offer10. Helped by the lifting of the cap on
TABLE 3: 2020 entry rates and entry rate ratios for ethnicity (English domiciled)
medical places in England in 2020, 105 English 18 year old students from
the most disadvantaged backgrounds (MEM group one) were accepted
Entry
onto medicine courses, compared to 80 in 2019 – a new record. Whilst an
rate
additional 25 places for those from the most disadvantaged backgrounds
ratio
(region is positive, the equality gap remains stark, and advantaged students
with remain nearly 25 times more likely than their disadvantaged peers to be
York- placed on medicine courses.
highest
shire East West East of
North North South South entry
and The Mid- Mid- Eng- London Ongoing efforts made by medical schools to expand and collaborate on
East West East West rate:
Hum- lands lands land outreach programmes, such as UKWPMED, will be central to reducing
region
ber this gap.
with
lowest
entry
rate in
2020)
Overall 33.2% 36.5% 34.6% 35.0% 35.3% 37.1% 49.1% 38.6% 32.4% 1.52
Higher tariff 11.5% 12.5% 10.7% 10.4% 10.2% 12.6% 18.9% 15.9% 12.8% 1.85 9
S elective providers’ are defined in Annex A: ‘Selective provider definition’ – www.
Medium tariff 10.8% 4.2% 10.7% 13.3% 9.4% 14.2% 17.0% 15.4% 12.9% 4.08 ucas.com/data-and-analysis/undergraduate-statistics-and-reports/ucas-
undergraduate-end-cycle-reports/2020-end-cycle-report
Lower tariff 11.0% 19.9% 13.2% 11.3% 15.6% 10.3% 13.3% 7.4% 6.7% 2.97
Note that each applicant can make up to five choices on their application in the
10
TABLE 4: 2020 entry rates and entry rate ratios for UK region (UK domiciled) UCAS main scheme, four of which can be to medicine courses.
8

SECTION 2: HOW WAS 2020 DIFFERENT?
                                   RECORD UK 18 YEAR OLD ENTRY RATES                                                        GRADING CHANGES HAD A
                                   SEES MORE DISADVANTAGED STUDENTS                                                         POSITIVE IMPACT ON WP
SUMMARY                            ENTER HE THAN EVER BEFORE
>   A record UK 18 year old
    entry rate of 37.0% sees       Due to the cancellation of exams across the UK in 2020, the qualifications               Through the collective efforts of the sector, more students from the most
    more disadvantaged             awarding process was different this year. Following ministerial                          disadvantaged backgrounds across the UK entered HE in 2020 than ever
    students enter HE than         announcements for England, Scotland, Wales and Northern Ireland,                         before, with just over 29,000 POLAR4 Q1 18 year old acceptances this
    ever before.                   it was decided that students would receive either their ‘centre assessment               year. This was supported by the government, with universities and colleges
                                   grade’ (CAG) (‘estimation’ in Scotland) or their ‘calculated grade’                      in England explicitly asked by the Universities Minister to prioritise
>   The grading change             (‘moderated result’ in Scotland) – whichever was higher.                                 disadvantaged students.
    had a positive impact
    on WP at all universities      Consequently, 165,72511 UCAS applicants received a grade higher than                     Across the UK, concern regarding the impact of the original grading
    and colleges, including        they were initially awarded. 84.5% of these 18 year olds were placed at                  for disadvantaged students was widespread. However, recent research
    15 of the most selective       their original firm choice university or college, or on a course at a university         from Ofqual12 suggests that, whether using the original calculated grades
    providers, and saw POLAR4      or college in the same or higher tariff band as their original firm choice –             or ‘final’ grades, no groups of students were systemically disadvantaged
    Q1 acceptances grow by         compared to 80.8% of all UK 18 year olds in 2019.                                        in 2020 based on their protected characteristics or socio-economic status.
    11.6% at these providers                                                                                                Evidence for this can be found by looking at the data at 19 August, prior to
    between 19 August and          The flexibility demonstrated by universities and colleges in accommodating               the policy changes, where the UK 18 year old entry rate was 34.3%13, a 1.3
    the end of the 2020 cycle.     this redistribution of students (supported by the government’s removal of                percentage point increase compared to the same point in the 2019 cycle
                                   number controls and the cap on medicine places) saw UK acceptances for                   and a record high. By this date, 26,190 POLAR4 Q1 applicants already held
>   As the economy shifts,         all ages reach 485,400 (up 4.5% on 2019) and the UK 18 year old entry                    confirmed places in HE – an increase of 1,270 from the same point in the
    older students look to         rate rise to a record 37.0% (up 2.9 percentage points on 2019).                          previous cycle.
    re- and up-skill through
    HE, with UCAS forecasting                                                                                               The Ofqual research also showed that the most consistent effect of the
    rising numbers of mature                                                                                                policy change was an uplift in final outcomes for all groups. With more
    applicants in 2021.                                                                                                     students meeting the terms of their offer, the number of placed UK 18
                                                                                                                            year old main scheme applicants increased by 5.5%, from before the
>   Mental health declarations                                                                                              policy change to the end of the 2020 cycle, with those placed at their
    continue to (modestly)                                                                                                  firm choice course increasing by 5.1%, and acceptances to higher tariff
    rise, but young men            11
                                        F igures in this paragraph are limited to applicants with a main scheme firm
                                                                                                                            providers growing by 7.5%. This contrasts with movements over the same
    are significantly (and               choice on 30 June.
                                                                                                                            period in 2019, in which there was a 1.6% uplift in main scheme applicant
    increasingly) less likely to                                                                                            acceptances (and a slight decrease in the number placed at higher tariff
                                   12
                                        www.gov.uk/government/news/summer-2020-outcomes-did-not-systemically-
    declare.                             disadvantage-students                                                              providers).
                                   13
                                         his figure (and all other in cycle figures) excludes RPAs; End of Cycle figures
                                        T
                                        include RPAs. Full details of inclusion criteria are in the Technical appendix.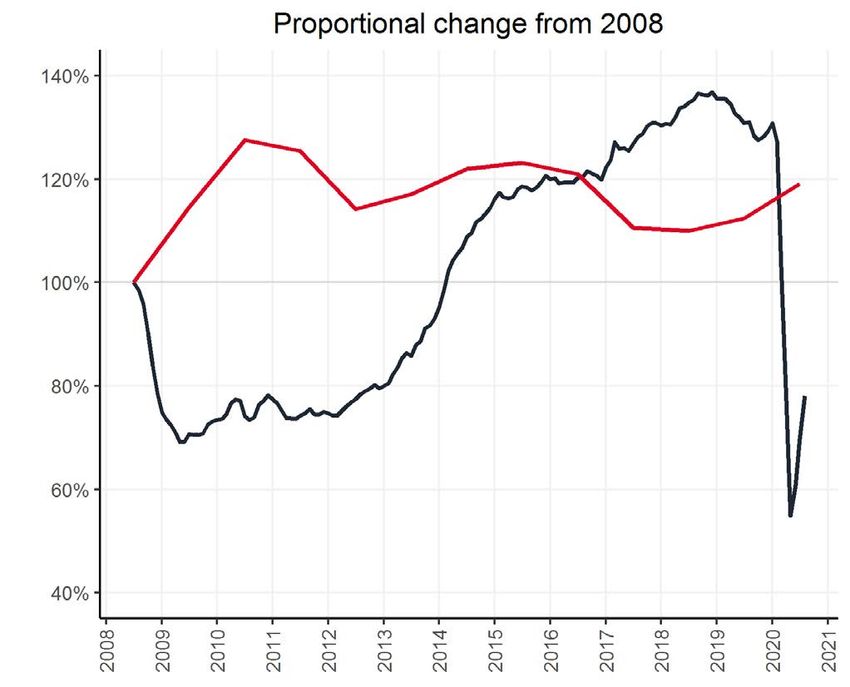
9
14
his figure is rounded to the nearest
T
5 due to the direct comparison with
THE ECONOMY WILL CHANGE an End of Cycle figure. (Other in cycle
THE MAKE-UP OF APPLICANTS figures are rounded to the nearest
10, as indicated in the Technical
Appendix.)
There were increases in acceptances across all POLAR4 groups. This UCAS analysis19 has previously shown that rises in mature applicants 15
www.theguardian.com/
included an increase in the total number of POLAR4 Q1 main scheme can be linked to a weaker job market. Between Q3 2019 and Q3 2020, education/2020/aug/19/how-
applicants placed at 15 of the most selective universities and colleges, job vacancies fell by 40.4%20, and this cycle saw a record number of will-the-a-level-u-turn-affect-uk-
from 1,72514 before the policy change to 1,925 by the end of the 2020 acceptances for mature UK students. The number of applicants aged 21 university-admissions
cycle – an 11.6% increase. – 50 increased by 5.8% on 2019, to reach a total of 149,720. Acceptances 16
nnex B: ‘Additional firm choice
A
among UK applicants rose to record levels for those in the 25 – 29 (23,790, deferrals estimation’ provides the
The grading change therefore resulted in an overall increase in access to +9.9% since 2019), 30 – 34 (14,960, +11.7%), and 35 and over (28,330, methodology used to produce this
this group of selective providers, benefitting all student groups, including +4.2%) categories. This has continued for those starting in 2021, with data estimate of additional deferrals.
the most disadvantaged. www.ucas.com/data-and-analysis/
from the 15 October deadline21 showing a 28% rise in applicants from the
undergraduate-statistics-and-
21+ age group.
Concerns had been raised that the reissue of grades after results day reports/ucas-undergraduate-end-
would result in some students having to defer, due to a lack of capacity cycle-reports/2020-end-cycle-report
for students meeting their offer conditions only after the change15. In 17
https://wonkhe.com/blogs/keep-
total, there were 1,520 deferred firm choice acceptances late in the cycle calm-students-still-want-to-study/
among applicants who had grade increases. Around 1,000 of these ‘late 18
F igures in the paragraph cover
deferrals’ would not have occurred had this group’s deferral rate been the applicants from all domiciles and all
same as expected based on the 2019 cycle16. age groups.
19
www.ucas.com/corporate/news-
and-key-documents/news/mature-
MORE STUDENTS SEEK OUT students-local-focused-and-female
CAREERS IN HEALTH AND SOCIAL CARE 20
www.ons.gov.uk/
THAN EVER BEFORE employmentandlabourmarket/
peopleinwork/
In July, UCAS reported17 that the number of new nursing applicants18 employmentandemployeetypes/
between 15 January and 30 June was 63% higher than the same period bulletins/uklabourmarket/
last year (12,840 in 2020, compared to 7,880 in 2019). The first lockdown october2020
period (23 March – 30 June deadline) itself saw nearly double the
21
www.ucas.com/data-and-analysis/
number of applications to nursing relative to the same period in the year undergraduate-statistics-and-
reports/ucas-undergraduate-releases/
previously (up 98% on 2019). Nearly half of all new applicants during
FIGURE 3: Relationship between job vacancies and mature application rate applicant-releases-2021/2021-
this period said COVID had increased their likelihood of applying, and for cycle-applicant-figures-15-october-
8% it was their main or only reason for applying. Further evidence of how Earlier UCAS research22 has found mature students to have different deadline
frontline workers inspired students is evidenced by the rise in health and motivations, expectations, and needs than their younger counterparts. www.ucas.com/file/175936/
22
social care acceptances – nursing acceptances reached a record high of However, a November 2020 report by TASO23 highlights the current absence download?token=UVSBJLVD
37,630 (up 23.8% on 2019). of consistent good practice to support the retention and attainment of 23
https://taso.org.uk/wp-content/
mature students. It is, therefore, important for universities and colleges to uploads/Full-report-Understanding-
continue to tailor course provision and support to account for a likely uplift gaps-in-the-student-experience-
in mature students, and to enable success – as noted by Universities UK Bridge-Group-and-Coventry-
with the CBI. University.pdf10
Over the past five years, the proportion of accepted applicants declaring a
A RECORD NUMBER OF APPLICANTS physical or mental health condition or impairment has increased year on
SHARING INFORMATION ABOUT DISABILITY year, from 9.4% in 2015 to 13.4% in 2020. This increase, largely driven by
AND MENTAL HEALTH the rise in mental health declarations, seemingly indicates that students are
increasingly comfortable sharing information about their support needs.
However, there is still a way to go: too many applicants still choose not to
Disability24 declare. Continuing efforts to frame the question positively for applicants
In total, 64,965 accepted UK applicants declared a physical or mental and their advisers are critical to ensuring students have an equitable chance
health condition in 2020 – an increase of 11.5% on 2019. Since 2012, there of success in HE. UCAS recognises its critical role in this process and, working
has been an overall rise of 82.1% in the proportion of accepted applicants with key organisations and sector bodies, has been exploring ways to
making a declaration – from 7.4% to 13.4% in 2020. Declarations in all improve the application to encourage more students to declare a disability,
categories reached a record high, but significant increases were seen in learning difference or mental health condition. Changes to the language,
accepted applicants declaring an autistic spectrum condition – rising 16.2% format, and help text will be introduced in future cycles.
(5,400 applicants), a specific learning difficulty – rising 10.7% (23,270),
a long-term illness – rising 10.7% and continuing a year-on-year increase MENTAL HEALTH DECLARATIONS CONTINUE
(4,745), and deafness and hearing impairments, also up 10.7% (1,100). TO (MODESTLY) RISE BUT SOME GROUPS ARE FAR
Over a quarter (26.9%) of all declarations by accepted applicants in 2020
were for a mental health condition. UCAS will be exploring this area next
LESS LIKELY TO DECLARE
year in a future publication. The impact of COVID on student mental health has been the centre of
much discussion and has seen the sector working together to explore
ways to address this major concern. In response, Student Minds launched
Student Space, a collaborative mental health programme to help
students find resources, tools, and information to support them through the
pandemic.
Since 2012, there has been a steady year on year rise in the number of
applicants declaring a mental health condition. In 2020, 17,455 accepted
students shared this information in their UCAS application – an increase of
10.4% on 2019, and a record high. However, when looking at the proportion
of accepted applicants who declared a mental health condition, this uplift is 24
‘Analysis in this section refers to UK
far more modest that it first appears – from 3.4% in 2019 to 3.6% in 2020, applicants of all ages, unless stated
suggesting that the year on year increases since 2015 (when the proportion otherwise in the text.
was only 1.5%) may be starting to level off. We should also be mindful that 25
digital.nhs.uk/data-and-information/
this data will underrepresent the number of students who will experience publications/statistical/mental-
difficulties with their mental health25, not least as the ongoing impacts of health-of-children-and-young-
FIGURE 4: Number of accepted applicants declaring an impairment or condition as part of people-in-england/2020-wave-1-
COVID continue to be felt.
the UCAS application follow-up11
By examining how mental health declarations intersect with other characteristics, analysis can start to pinpoint
where support may be in higher demand: applicants aged 21 – 24 (6.6% in 2020) are almost three times more
likely to declare than those aged 18 (2.3%), those from POLAR4 Q1 (4.6%) are more likely to declare than those
from POLAR4 Q5 (3.2%), and those from the Mixed (4.4%) or White (4.3%) ethnic groups are almost twice as likely
to declare than applicants in other ethnic groups.
Importantly, this data also highlights which groups are significantly less likely to declare – it should not be assumed
these students are less likely to face challenges with their mental health. For example, the number of female
applicants declaring a mental health condition is consistently higher than male, with the gap between rates of
declaration by male and female applicants growing since 2012. In 2020, female applicants were twice as likely
(4.7%) to declare a mental health condition than male (2.1%), whereas, in 2012, female applicants (0.9%) were only
1.6 times as likely to declare than males (0.6%). Research by the Mental Health Foundation26 has shown that men
with mental health conditions are more likely to be under-diagnosed and less likely to access support than women.
This stark gender gap is a concern because current efforts to reduce stigma seem to be failing to resonate with male
applicants.
One approach to tackle under-declaration may be to target messaging to those applying to subject areas where
mental health declarations are lowest – these are consistently:
1. Medicine and Dentistry (1.4% of all accepted applicants declared a mental health condition in 2020)
2. Engineering (1.4%)
3. Business and Admin Studies (1.5%)
4. Architecture, Building and Planning (1.8%)
Except for Medicine and Dentistry (which itself has a high POLAR4 Q5 entry), these courses tend to have a high
male:female ratio. In contrast, students accepted to courses in arts and languages (including European and Non-
European Languages and Literature, Creative Arts and Design, and Linguistics) are between three to six times
more likely to declare a mental health condition, and they also tend to present a higher female:male ratio. In these
instances, gender itself cannot be deemed to be the determining factor in the lower declarations – other issues will
be influencing this – however, it is worth considering when addressing the disparity at subject level.
26
www.mentalhealth.org.uk/a-to-z/m/men-and-mental-health12
SECTION 3: WHAT DOES THE FUTURE LOOK LIKE FOR LEVELLING UP?
WHAT WILL THE 2021
SUMMARY WP STORY LOOK LIKE?
> As the 18 year old
population rises, resulting
in around 90,000 Though analysis of the 2020 cycle is broadly positive for disadvantaged Therefore, the role of UK governments and qualification regulators in
additional applicants by students, the challenge of carrying this through to 2021 should not be recognising educational disruption in the assessment and awarding of
2025, there will be more underestimated. Current applicants have faced significant barriers to their qualifications will be critical. The flexibility of universities and colleges,
competition for university progression – when surveyed over the summer, 30% of those looking to plus government willingness to invest in maintaining capacity of HE and
and college places and apply in the upcoming cycle reported zero hours of contact time with their apprenticeships, will also be essential.
apprenticeships. There is school during lockdown, and 93% had concerns about making decisions
a risk that disadvantaged about their future28. To support students entering HE in 2021, UCAS will:
students, who are typically
Equally, the potential for disadvantaged students to experience a > provide greater transparency to advisers in schools and colleges
lower attaining, will be
disproportionate impact of the pandemic on their Level 3 attainment regarding the range of attainment levels universities and colleges
squeezed out.
is clear. Based on studies of previous school closures across different accept, rather than just what is marketed in prospectuses
> Modelling different countries, the EEF estimates29 that the socio-economic attainment gap > build on the extensive content on our website and online events to
scenarios illustrates the in England could widen by 36% (reversing progress in narrowing the gap provide students with trusted information and advice about their
scale of change that would seen since 2011), and school attendance rates appear lower for more options
be required to eliminate the disadvantaged areas and students. Meanwhile, in November, Teach First
equality gap at higher tariff reported30 that four out of five (84%) schools with the poorest pupils do > provide guidance on how information about COVID disruption faced
providers, with the current not have enough devices and internet access to ensure all self-isolating by an applicant is communicated in UCAS references or the personal
trend meaning the gap will pupils can keep learning. statement
take 332 years to close.27
> make enhancements to the Clearing Plus service, to provide a greater
> Higher technical education and more diverse range of options for applicants to choose from
and apprenticeships
present challenges and
opportunities for social 27
nnex C: ‘Forecasts for the higher tariff provider MEM equality gap’ provides (in part ii) the methodology used to produce this estimate www.ucas.com/data-and-
A
justice. analysis/undergraduate-statistics-and-reports/ucas-undergraduate-end-cycle-reports/2020-end-cycle-report
> Reforming HE admissions 28
F igures from the 2020 UCAS pre-applicant survey of Year 12/S5 students. The questions asked were ‘On average each week, how much contact time are you getting
offers an opportunity to with your teachers? This could be through online classes, Zoom calls, one-to-one phone calls with your teacher or similar.’ and ‘How worried, if at all, are you feeling
better support FE and about being able to make the right decision about your future?’
apprenticeship options. 29
https://educationendowmentfoundation.org.uk/public/files/EEF_(2020)_-_Impact_of_School_Closures_on_the_Attainment_Gap.pdf
30
www.teachfirst.org.uk/press-release/digital-divide13
WHAT WILL THE NEXT FIVE YEARS
ENTAIL IF WE ARE TO LEVEL UP?
The impact of COVID on educational inequalities, combined with a growing (compared with 49% across all placed applicants). This means that
population, has the potential to put the brakes on – or even reverse – recent disadvantaged students may be most vulnerable to an uplift in competition
progress in WP. for places.
2021 will bring the first increase in the 18 year old population since 2015 Devolved government policy in Scotland determines that places are
– a trend that is set to endure for the next six years. By 2025, Office for ringfenced for disadvantaged students. SIMD targets were introduced in
National Statistics (ONS) data projects a net increase of 114,060 18 year Scotland in 2007 and disadvantaged 18 year olds from SIMD Q1 are now
olds across the UK, bringing the total to 811,13031. By 2025, UCAS forecasts twice as likely to enter HE than in 2008. In addition, Scottish universities
there will around an additional 90,000 UK 18 year old applicants based on and colleges committed to setting minimum entry requirements
a projected application rate of 47.5%. The Higher Education Policy Institute for disadvantaged students from the 2020/21 cycle. Among 18 year old
(HEPI) has similarly suggested32 that, considering such projected increases females in Scotland, 15 January deadline application rates for SIMD Q1
in participation, around 358,000 more student places would be required in rose to 24% in the 2020 cycle (from an average of 23% across 2016 to
England alone by 2035. 2019)36 , while application rates among males remained constant at 12%.
Such a shift would change the nature of levelling up, with increased
competition for places likely to increase the selectivity of the HE sector.
Universities and colleges will need to make tougher decisions – and there
is a risk that lower attaining disadvantaged students will be squeezed out 31
www.ons.gov.uk/peoplepopulationandcommunity/populationandmigration/populationprojections/bulletins/
given they are on average 18 months behind their more advantaged peers, nationalpopulationprojections/2018based To obtain the population values provided here in this report, UCAS further
according to the EPI33. processes the ONS population forecasts to align with UK country-specific school year.
This ‘disadvantage gap’ is also found in UCAS’ data, with 13.4% of 18 year
32
www.hepi.ac.uk/wp-content/uploads/2020/10/Demand-for-Higher-Education-to-2035_HEPI-Report-134_FINAL.pdf
old POLAR4 Q1 applicants achieving below CCC at A level in 2020 – over 33
https://epi.org.uk/publications-and-research/education-in-england-annual-report-2020/
double that of POLAR4 Q5. The Equality and Human Rights Commission
suggests34 that, without intervention, persistent inequalities at both primary 34
www.equalityhumanrights.com/sites/default/files/equality_and_human_rights_commission_how_coronavirus_has_
and secondary level could increase post-pandemic, widening the pre-HE affected_equality_and_human_rights_2020.pdf
attainment gap. In addition, disadvantaged students are also more likely 35
ww.ucas.com/file/286346/download?token=DookHVk1 – figures based on 18 year olds domiciled in England, Northern
w
to be accepted with lower levels of attainment than the advertised entry Ireland, and Wales, with at least three predicted A levels, who have been accepted on courses for which A level entry
requirements. For example, in 2019, the UCAS report, Realising Ambition35, requirements have been supplied to UCAS.
showed that 60% of POLAR4 Q1 placed applicants were accepted on
courses with actual A level grades below advertised entry requirements 36
www.ucas.com/data-and-analysis/undergraduate-statistics-and-reports/ucas-undergraduate-releases/applicant-releases-
2020/2020-cycle-applicant-figures-15-january-deadline14
IMPROVING HOW CHOICES ARE MADE
IS CRUCIAL
A broader question is the extent to which disadvantaged applicants might
choose to apply for an undergraduate degree. In 2020, the 15 January
application rate for POLAR4 Q1 students was less than half that of POLAR
Q537 – aspiration remains a considerable barrier for disadvantaged students
in accessing HE. Moreover, as innovation and interest in alternatives to three-
year, full-time, undergraduate degree programmes grow, the challenge in
attracting disadvantaged applicants to more traditional forms of HE will
likely mount. 37
www.ucas.com/data-and-analysis/
undergraduate-statistics-and-
Graduate employability appears more important to disadvantaged reports/ucas-undergraduate-releases/
applicants, with 79% of POLAR4 Q1 18 year old applicants citing that applicant-releases-2020/2020-
their choice of subject was influenced by career prospects or requirements, cycle-applicant-figures-15-january-
compared to 74% of Q538. Organisations such as the Sutton Trust have long deadline
since championed apprenticeships as having the ‘potential to be powerful
vehicles for social mobility’39 – unsurprising given their promise of a salaried
38
F igures from the 2020 UCAS New
Applicant Survey. The question
route to a degree (and a likely fast track to employment).
asked was: ‘Which of the following
Higher technical education qualifications are to be newly approved from 2022 influenced your choice of subject(s)?
Please select all that apply’.
and, following the ‘Kickstart Scheme’ announcement in July, there was a
12% month-on-month increase in the number of listed opportunities on the 39
www.suttontrust.com/wp-content/
UCAS apprenticeship search tool, Career Finder. In addition, 30% of UK 18 uploads/2020/05/Degree-
year old applicants are seriously considering an apprenticeship at the point of Apprenticeships-Levelling-Up.pdf
their UCAS application (rising to 32% for POLAR4 Q1 students)40. 40
F igures from the 2020 UCAS New
This means that success in WP ought not to be defined by headline numbers Applicant Survey The question
around those from the most disadvantaged quintiles entering HE, but asked was: ‘In addition to your
application for higher education, are
considered holistically in terms of levelling up opportunity for all. Another (and
you seriously considering any of the
in many ways contrary) risk is that, short of attracting disadvantaged students following? Please tick all that apply’.
in greater numbers, the absence of a centralised application process and
transparency of route for technical education and apprenticeship pathways 41
www.gov.uk/government/
could create a barrier to entry. Such fairness challenges will need to be publications/apprenticeships-and-
addressed, as noted by the Social Mobility Commission41. social-mobility-fulfilling-potential15
LOOKING FURTHER INTO THE FUTURE,
HOW AMBITIOUS CAN WE BE?
The external environment means the next five years will see universities,
colleges, and apprenticeship providers required to redouble their efforts to
improve equality of access to post-secondary education. The combined Additional English
Additional yearly Forecasted year where
effect of the supply of 18 year old applicants outweighing demand 18 year old MEM group Yearly percentage point
proportional growth MEM group one and
for places, a likely widening of the attainment gap as a result of the one acceptances, per UK increase in MEM group
in total higher tariff group five entry rates
pandemic, and the growth in alternatives to a three-year degree (especially higher tariff provider, one entry rate
acceptances required are equal
apprenticeships) that do not currently fall under UCAS’ national shared per year
admissions service, means levelling up cannot be taken for granted.
However, collective investment in and commitment to WP is considerable.
5 0.8ppt 0.2% 2080
The UK HE sector spends upwards of £500 million annually to improve
access, provide financial support, and research or evaluate commitments
detailed in their access and participation plans42. This funds, for example, 10 0.9ppt 0.5% 2063
bursaries, adjustments for disabled students, and delivering outreach
activities and events to secondary schools and colleges.
30 1.7ppt 1.5% 2041
Modelling the scale of change required to widen access and participation is
important to understand the scale of action required. For example, if each 50 2.4ppt 2.5% 2034
higher tariff provider had admitted just an additional 70 MEM group one
students in 2020 (an increase in total acceptances to this group of providers
of 3.5%), the equality gap across higher tariff providers would be half of 70 3.1ppt 3.5% 2030
what it is now43. A consistent use of such practices as illustrated below, could
enable the eradication of the equality gap by 203044. TABLE 5: Modelling the scale of change required to widen access and participation
42
www.officeforstudents.org.uk/media/2efcda44-8715-4888-8d63-42c0fd6a31af/transforming-opportunity-in-higher-education.pdf
43
nnex C: ‘Forecasts for the higher tariff provider MEM equality gap’ provides (in part i) the methodology used to produce this estimate www.ucas.com/data-and-analysis/undergraduate-statistics-and-reports/
A
ucas-undergraduate-end-cycle-reports/2020-end-cycle-report
44
nnex C: ‘Forecasts for the higher tariff provider MEM equality gap’ provides (in part iii) the methodology used to produce this estimate www.ucas.com/data-and-analysis/undergraduate-statistics-and-reports/
A
ucas-undergraduate-end-cycle-reports/2020-end-cycle-report16
REFORMING THE ADMISSIONS SYSTEM TO PROVIDE
CHOICE AND LEVEL UP OPPORTUNITY
In November 2020, the Department for Education announced plans
to review the HE admissions service and consult on the introduction of a
form of post-qualification admissions.
Universities UK’s fair admissions review also recommended reforming
the undergraduate admissions system.
This is a welcome recommendation, and one that should be given serious
consideration. UCAS has delivered the UK’s national shared admissions
service for over 50 years, and has continually evolved the system to the
benefit of students, seeking to enhance student choice through the
provision of high quality information and advice, and presenting an array
of opportunities in a single location. Reform, innovation, and change in
admissions is continual and necessary as our education system changes.
While the current system works well for most people across the four
nations, some common challenges persist, including:
> the role of predicted grades
> unconditional offers
> access for disadvantaged students
> the efficacy of asking applicants to choose their options six months
before they know their exam results
While admissions reform will not address each of these issues alone, it can
contribute to an improvement. In early 2021, UCAS will release a report
looking at the case for reforming the admissions service and propose
a preferred option for reform to shape and inform the government’s
consultation. Our driving purpose is to promote student decision-making
and improve fairness, while avoiding any unintended consequences.15
16

TECHNICAL APPENDIX
>   The majority of analysis covers UK 18 year old students. Where only
    domicile is referenced in the text, the age can be assumed to be 18.
    Where only age is referenced, the domicile can be assumed to be UK.

>   The major exception is analysis using the UCAS multiple equality
    measure (MEM), free school meals (FSM), and ethnic group, which
    is carried out using the National Pupil Database (NPD, source:
    Department for Education), and so consequently is limited to English
    domiciled 18 year old students only.

>   Where age or domicile differs from the above, it is explicitly referenced
    in the text or accompanying footnotes.

>   RPAs are generally included in end of cycle figures and excluded from in
    cycle figures. Exceptions are indicated in the text.

>   End of cycle counts are generally rounded to the nearest five, and
    percentages to one decimal place. In line with previous reporting,
    in cycle counts are generally rounded to the nearest ten. Survey
    percentages are reported to the nearest whole number. Gap ratios are
    rounded to two decimal places. Where previously published figures
    are reported, the original level of precision is retained. Exceptions are
    indicated in the text.

>   Throughout the report, ‘firm choice’ refers to applicants’ main scheme
    firm choice courses on 30 June, and ‘firm choice university or college’
    indicates applicants’ main scheme firm choice providers on 30 June.
    Applicants without a main scheme firm choice on this date are
    excluded from these figures.
© UCAS 2020 All rights reserved. UCAS is a registered trade mark. UCAS, a company limited by guarantee, is registered in England and Wales. Registered number: 2839815. Registered charity number: 1024741 (England and Wales) and SC038598 (Scotland) Publication reference: MD-6772 Published by: UCAS, Rosehill, New Barn Lane, Cheltenham, GL52 3LZ.
You can also read