Q2 & first half report 2021 - Nordic Semiconductor
←
→
Page content transcription
If your browser does not render page correctly, please read the page content below
Q2 & first half report 2021

Content
3     Q2 highlights

4     Key figures

5     Q2 & H1 2021 review
       Operational review
       Revenue
       Financial results
       Financial position
       Cash flow
       Risk and uncertainty

15    Outlook

17    Condensed financial information

21    Notes to the condensed consolidated
      financial statements

25    Board and management confirmation

26    Alternative performance measures
NORDIC SEMICONDUCTOR | Q2 & FIRST HALF REPORT 2021 (UNAUDITED)
Q2 Highlights
Revenue of USD 147.6 million (+67%) Record order backlog of USD 1,253 million,
EBITDA of USD 29.2 million (+82%) stretching through 2022
First quarter with meaningful Cellular IoT revenue, Growth capped by wafer availability
USD 4.6 million (+289%) Launched
product
first catalog power management
Revenue EBITDA
USD million Revenue USD million EBITDA
35.0
160.0 147.6
143.2 29.2
30.0 28.6
140.0 127.1 26.9
119.4 24.9
120.0 25.0
100.0 88.5 20.0
16.0
80.0
15.0
60.0
10.0
40.0
20.0 5.0
0.0 0.0
Q2 2020 Q3 2020 Q4 2020 Q1 2021 Q2 2021 Q2 2020 Q3 2020 Q4 2020 Q1 2021 Q2 2021
Gross margin EBITDA margin
Gross Margin EBITDA Margin
24.0%
56% 25%
54.1%
21.1%
54% 52.7% 19.8%
51.9% 20% 18.1%
52% 50.9% 17.4%
50.2%
50% 15%
48%
46% 10%
44%
5%
42%
40% 0%
Q2 2020 Q3 2020 Q4 2020 Q1 2021 Q2 2021 Q2 2020 Q3 2020 Q4 2020 Q1 2021 Q2 2021
3
NORDIC SEMICONDUCTOR | Q2 & FIRST HALF REPORT 2021 (UNAUDITED)

Key figures
Q2 and first half 2021 financial summary

 Amount in USD million                      Q2 2021     Q2 2020    Change      H1 2021   H1 2020   Change
 Revenue                                        147.6      88.5      66.7%      290.8      158.7     83.3%

 Gross profit                                    75.1      45.9      63.6%       147.0      82.3     78.6%

 Gross margin %                               50.9%       51.9%    -1.0 p.p.    50.5%      51.9%   -1.3 p.p.

 EBITDA                                         29.2        16.0     82.1%        54.1      21.3    154.2%

 EBITDA %                                      19.8%       18.1%    1.7 p.p     18.6%     13.4%     5.2 p.p

 Operating profit (EBIT)                        20.1        8.4     138.3%        35.8       6.3    467.0%

 Operating profit % (EBIT)                     13.6%       9.5%     4.1 p.p      12.3%     4.0%    8.3 p.p.

 Net profit after tax                            17.3        5.7   202.6%        30.8       4.4    606.3%

 Cash and cash equivalents                                                       227.4     124.4     82.9%

 Order backlog                                                                 1 252.6     201.9    520.3%

 LTM opex excluding depreciation/LTM
                                                                                 31.5%     37.4%   -5.9 p.p.
 revenue

 Net working capital / LTM revenue                                               19.3%    26.0%    -6.7 p.p.

 Equity ratio                                                                   78.5%     67.4%     11.1 p.p.

 Number of employees                                                             1 087      822      32.2%

                                                                                                                4
NORDIC SEMICONDUCTOR | Q2 & FIRST HALF REPORT 2021 (UNAUDITED)

Q2 & H1 2021 review
Revenues amounted to USD 148 million in the second quarter 2021 and USD
291 million for the first half year, corresponding to growth of 67% and 83%
from the same periods last year. Growth is currently capped by the supply
of wafers, and the continued strong demand led to a further increase in
order backlog. At the end of June, the backlog stood at USD 1,253 million,
which was an increase of 520% year-on-year and 56% above the end of the
first quarter. Timing of deliveries will depend on the availability of wafers,
and the current backlog stretches through 2022.
Operational review                                          The tight supply situation across the semiconductor
Nordic Semiconductor (Nordic or the Group) has              industry also affects Nordic’s cellular IoT business, where
remained fully operational and in full compliance with      the company module-based product is dependent
national and local Covid-19 regulations throughout the      on a larger number of third-party components and
Covid-19 pandemic and has proceeded as planned              assembly capacity.
with all internal product development projects. The
restrictions on travels and physical meetings have          Nordic’s own backend production capacity and in-house
been compensated with extensive online developer            testing capabilities are sufficient to meet significantly
and customer support. Operations at the company’s           higher volumes, following last year’s investments in
main suppliers and distributors have also remained          additional testing equipment and component inventory
operational, although local Covid-19 restrictions and       buffers. The company has continued to invest in its in-
lockdowns have temporarily affected production and          house capacity in the first half of 2021.
shipments in some areas.
                                                            Order backlog continuing to increase
Continued supply chain constraints                          All Nordic’s main market verticals are experiencing
As described in the interim reports for Q4 2020 and         strong demand growth. Given the supply chain
Q1 2021, capacity constraints forced the company’s          capacity constraints this generates strong growth in
main wafer supplier to reduce the allocation of wafers      the order backlog. At the end of June 2021, the order
for 2021 compared to forecasted demand. The wafer           backlog was USD 1,253 million, compared to USD 202
allocation allowed Nordic to increase its production        million at the end of Q2 2020 and USD 803 million at
by a minimum 25% from 2020 to 2021. As demand has           the end of Q1 2021.
been significantly higher, the company has worked
continuously to advance the wafer delivery schedules.       Approximately 91% of the order backlog represent
Combined with a favorable product mix this has enabled      Bluetooth low energy and multiprotocol solutions, while
Nordic to deliver Q2 revenue roughly on par with Q1 and     the remainder is for proprietary products and cellular
allows the company to guide for a revenue level of USD      IoT projects. The solid Bluetooth order backlog reflects
130-150 million for Q3 2021. The wider range reflects the   demand from several tier-1 customers for high-volume
continued uncertainty regarding wafer availability.         products, as well as continued high demand in the
                                                            broad market.
Nordic is in continuous dialog with its suppliers,
distributors, and customers about the effects of the        Maintaining strong design market share
capacity constraints. The company is doing its utmost       FCC and Bluetooth SIG data compiled by DNB Markets
both to secure additional wafers and help its customers     show that Nordic had a market share of 42% of new
manage the challenges brought about by the supply           design certifications in the Bluetooth low energy market
chain constraints.                                          in the second quarter and 42% for the first half year
                                                            2021. The total number of certifications of new Bluetooth
Nordic continues its efforts to advance wafer deliveries,   low energy designs increased by 19% year-on-year to
to be able to support customers experiencing strong         363 in the second quarter, of which 153 designs had
end-user demand. The company expects suppliers to           Nordic inside.
maintain wafer deliveries at minimum the same level
also through the fourth quarter of the year.

                                                                                                                          5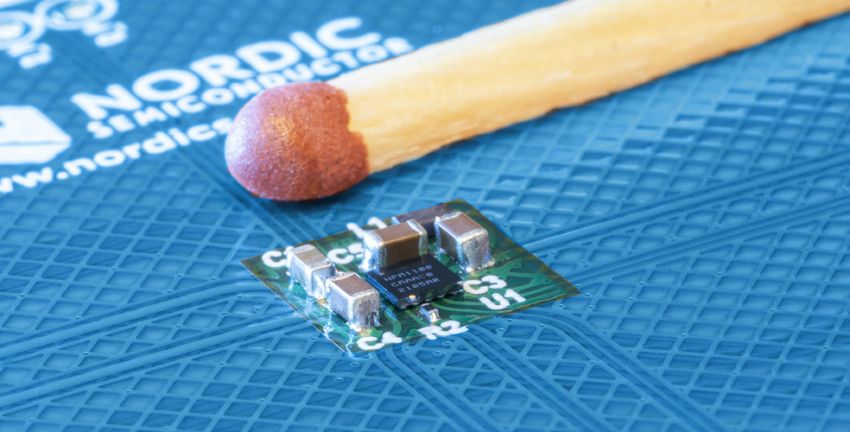
NORDIC SEMICONDUCTOR | Q2 & FIRST HALF REPORT 2021 (UNAUDITED)

Nordic shipped 53,000 development kits during the first      The dual core nRF5340 supports Bluetooth 5.2/Bluetooth
half of 2021. This was an increase of 23% from the same      low energy, Bluetooth mesh, Thread, and Zigbee, and
period last year. Given that these kits are reusable and     has been designed for highly complex applications. The
the company already has a high penetration among             SoC also meets the requirements of LE Audio and will
Bluetooth low energy developers, this represents a           enable multi-stream synchronized audio streaming over
strong sign of continued high interest in the technology.    Bluetooth low energy. Nordic has established support
Activity on the company’s developer community                for AI and machine learning on the nRF5340, as well
DevZone remains high.                                        as for use in the Matter project supported by Apple,
                                                             Amazon, Google, and several other major players.
Product launches and software developments
The flow of new product launches with Nordic inside          New partner programs and standardization efforts
continued through the first half 2021. As usual, the         In June 2021, Nordic launched the ‘Nordic Partner
launches cover a wide variety of applications, showing       Program’ to help customers accelerate time to market.
the ubiquitous nature of the technology, and included        The partner program includes both design partners and
several new asset trackers, Covid-19 contact tracing         solution partners. It creates an ecosystem that assists
solutions and other healthcare applications, and several     Nordic customers by providing products, services and
new modules from leading manufacturers.                      solutions that complement Nordic’s portfolio of hardware,
                                                             firmware, development tools and reference designs.
On the software side, the company launched a version         Initial partners include CA Engineering, Indesign, Sigma
1.5.1 of its nRF Connect SDK, which included support         Connectivity, Shenzhen Minew Technologies, Meshtech,
for Apple Homekit on the nRF52840 SoC and Zigbee             grandcentrix, NORBIT, and Telenor.
support for the nRF52833 and nRF52840. The company
has also teamed up with the cloud-based debugging
specialist Memfault to offer their platform for remote
debugging and monitoring on the nRF Connect SDK.

During the quarter, Nordic also launched a Software
Development Kit compatible with the Apple Find My
network. Apple earlier this year established a network
accessory program opening the Find My network to
third-party device manufacturers, with several Nordic
customers among the earliest device manufacturers to
join the program.
                                                             The company also continues to actively take part in the
Continued fast pick-up of next generation nRF53              standardization of technologies and solutions, and in
Nordic's first product in the nRF53 generation -the dual-    June joined the Connectivity Standards Alliance China
processor nRF5340- went into volume production in Q4         to promote the unified and secure IP-based smart home
2020 and has seen fast pick-up through the first half        connectivity protocol ‘Matter’.
of 2021. The SoC is available on 22 different module
variants from seven different module partners, and           Previously known as Connected Home over IP (CHIP),
Nordic in the first quarter received the first nRF5340       Matter is backed by more than 180 companies worldwide,
order exceeding USD 1 million, within the advanced           and is working to secure seamless connectivity and
wearables market.                                            interoperability of devices, hubs, apps and services.
                                                             Matter provides a standard application layer that is
                                                             used with a set of wireless technologies. The current
                                                             focus is on Bluetooth low energy, Thread and Wi-Fi,
                                                             which will be followed by other IP-supporting protocols
                                                             such as Ethernet and cellular.

                                                             During the quarter, the company also joined the Precise
                                                             Locationing Alliance’s Indoor Locationing Working
During the second quarter, the company was notified          Group in Asia. Indoor navigation remains the largest
that the nRF5340 has been shortlisted as a finalist in the   application area within Bluetooth location services, with
‘RF/Wireless IC’ product category of the 2021 EE Awards      retail & services continuing to drive the growth.
Asia in August, which is organized by the Aspencore
electronics industry media group.

                                                                                                                         6
NORDIC SEMICONDUCTOR | Q2 & FIRST HALF REPORT 2021 (UNAUDITED)

Entering the Power Management market                          Several projects are now beginning to gain
Nordic in May launched the nPM100 PMIC, the                   commercial traction. This is in turn beginning to
company’s first catalog power management product.             generate meaningful revenue for Nordic, with USD 4.6
The nPM100 combines a USB compatible battery                  million reported for Cellular IoT in Q2 2021. A vehicle
charger with a highly efficient DC/DC converter in an         tracking customer is progressing with a particularly
ultra-compact wafer level chip scale package (WLCSP)          promising project, indicating potential to become a
for space constrained applications.                           top-10 customer for Nordic.

                                                              As previously described, Nordic has established a broad
                                                              carrier certification program for its nRF9160 cellular IoT
                                                              System-in-Package (SiP), covering global operators as
                                                              well as leading national and regional operators in the
                                                              US, China, Japan, South Korea, and Canada.

                                                              In May, Nordic launched a modem firmware upgrade
                                                              for the nRF9160, improving the GPS functionality and
                                                              location APIs for multi-cell location services, adding new
                                                              functionality, and further reducing power consumption.
The power management integrated circuit (PMIC)
ensures reliable power supply and stable operation for        Joining the Responsible Business Alliance to
Nordic’s nRF52 and nRF53 Series SoCs, and maximizes           further firm up our sustainability commitment
battery life with ultra-low power consumption in ‘sleep       On the corporate level, Nordic in June announced
mode’ and disabling of power in ‘ship mode’. The              that the company has joined the Responsible Business
nPM100 can also be used as a generic PMIC for other           Alliance (RBA), which is the world’s largest industry
applications using rechargeable Lithium Ion or Lithium        coalition dedicated to corporate social responsibility in
polymer batteries.                                            global supply chains.

Nordic believes the PMIC is a very competitive product        Nordic has since 2007 been using RBA’s common Code
on its technical merits alone, as well as offering a          of Conduct as a compass towards its sustainability
particularly clear value-add for existing customers           goals and has aligned its policies with RBA’s principles
through the tight integration with Nordic’s product           when engaging with suppliers for improved CSR
portfolio. The extremely compact form factor making it        performance. As Nordic grows and develops, the
ideal for i.e. advanced wearables, connected medical          company recognizes a continuous need to consider its
devices, smart home sensors and remote controls.              impact on the environment and on the communities in
Nordic has also launched a nPM1100 Evaluation kit.            which it works, and the decision to join the RBA reaffirms
                                                              and emphasizes this commitment.
The launch of the nPM1100 marks a commitment to
establish a line of PMIC products going forward, led by
the company’s R&D unit in Swindon, UK.

Cellular IoT moving forward
Nordic's end-user customers are working on more
than 200 different cellular IoT projects across a wide
variety of verticals, including smart cities, logistics and
asset tracking, industrial and agricultural monitoring
systems, metering, parking and payment systems, etc.
During the second quarter, the company saw several
customers launching new asset trackers based on the
nRF9160, such as a new indoor/outdoor tracker from
Digital Matter.

                                                                                                                           7
NORDIC SEMICONDUCTOR | Q2 & FIRST HALF REPORT 2021 (UNAUDITED)
INCOME STATEMENT
Revenue
Amounts in USD thousand Q2 2021 Q2 2020 Change H1 2021 H1 2020 Change
Bluetooth 122 992 70 124 75.4% 242 809 121 313 100.2%
Proprietary wireless 17 674 16 391 7.8% 38 561 31 786 21.3%
Short range wireless components 140 666 86 515 62.6% 281 370 153 099 83.8%
Cellular IoT 4 586 1 178 289.3% 5 805 2 282 154.4%
ASIC components 2 189 816 168.3% 3 247 3 291 -1.3%
Consulting services 150 20 NA 400 20 NA
Total revenue 147 591 88 529 66.7% 290 822 158 692 83.3%
Nordic reported total revenue of USD 147.6 million in Proprietary revenue was USD 17.7 million in Q2 2021,
Q2 2021, which was an increase of 67% from USD 88.5 which was an increase of 8% year-on-year and a
million in Q2 2020. decline of 15% from the previous quarter. The figures
reflect sound demand for home office equipment and
Growth is currently capped by limited availability of PC accessories. Proprietary revenue accounted for 12%
wafers, and the revenue hence does not reflect the of total revenue in the quarter.
full underlying demand across all end-user markets.
The order backlog increased more than sixfold from Cellular IoT reported revenue of USD 4.6 million in Q2
USD 202 million at the end of June 2020 to USD 1,253 2021, an increase of 289% from Q2 2020 and 276% above
million at the end of June 2021. The increase was 56% the previous quarter when revenues were affected
during the second quarter and 155% from the end of by delivery issues. While the technology still is in the
2020. The continued strong increase reflects both early stages of commercialization the segment is now
significantly higher orders from larger tier-1 customers as beginning to show meaningful revenue, reflecting that
well as accelerating technology adoption and continued more projects are gaining commercial traction. Revenue
strength in the broad market. The order inflow may also development will still be lumpy depending on the timing
be affected by customers placing early orders to secure of deliveries.
delivery.
ASIC component revenues amounted to USD 2.2 million
Nordic classifies revenues into the following technologies: in Q2 2021, which compares with USD 0.8 million in Q2
Short-range wireless components, long range (cellular 2020 and USD 1. 1 million in Q1 2021.
IoT) wireless components, ASIC components, and
Consulting services. Short-range wireless components For the first half year 2021, revenue amounted to USD
are in turn split between Bluetooth and multiprotocol 290.8 million, an increase of 83% from USD 158.7 million
solutions and Proprietary solutions. in the first half 2020. Bluetooth revenue doubled to USD
242.8 million, whereas proprietary revenue increased by
Bluetooth revenue amounted to USD 123.0 million in Q2 21% to USD 38.6 million. Cellular IoT revenues increased
2021, an increase of 75% from USD 70.1 million in Q2 by 154% in the first half year, to USD 5.8 million.
2020, with the modest 3% increase from the previous
quarter explained by limited wafer availability. Bluetooth
share of total revenue was 83% in Q2 2021.
Revenues by end-product markets
Amounts in USD thousand Q2 2021 Q2 2020 Change H1 2021 H1 2020 Change
Consumer Electronics 51 148 29 500 73.4% 102 390 54 007 89.6%
Wearables 16 023 14 136 13.3% 35 938 25 486 41.0%
Building/Retail 41 491 18 842 120.2% 76 889 32 005 140.2%
Healthcare 15 548 13 975 11.3% 31 811 19 445 63.6%
Others 16 456 10 062 63.6% 34 342 22 156 55.0%
Short range wireless components 140 666 86 515 62.6% 281 370 153 099 83.8%
8NORDIC SEMICONDUCTOR | Q2 & FIRST HALF REPORT 2021 (UNAUDITED)
USD million X
Nordic reports its short-range wireless component 45.0 41.5
revenues based on the following end-product markets: 40.0
Consumer electronics, Wearables, Healthcare, Building 35.4
35.0
and retail, and Others.
30.0 27.0
Consumer Electronics generated 73% revenue growth 25.0 22.9
to USD 51.1 million in Q2 2021, which was on par 18.8
20.0
with the previous quarter. The year-on-year revenue 15.0
growth reflects both increased Bluetooth sales and
10.0
continued high deliveries of proprietary products for PC
accessories for the home office market. Although PC 5.0
accessories remain the largest sub-segment, gaming 0.0
Q2 2020 Q3 2020 Q4 2020 Q1 2021 Q2 2021
accessories and home entertainment have become
increasingly important revenue drivers. For the first half Revenue - Building/Retail
2021, Consumer Electronics revenue increased by 90% to
USD 102.4 million. Healthcare revenue increased by 11% year over year
USD million X to USD 15.5 million in Q2 2021 and by 64% to USD 31.8
million for the first half year. While deliveries continue
60.0 55.4 53.7 to reflect several Covid-19 related applications, the
51.2 51.1
50.0
pandemic has accelerated the adoption of connected
healthcare devices in general. The company continues
40.0 to see the Healthcare segment as a market with
29.5
potentially disruptive growth possibilities, and as one
30.0 of the key growth drivers for combined short-range
and long-range products and solutions.
20.0
USD million X
10.0 18.0
16.3
15.5
16.0
0.0 14.0
Q2 2020 Q3 2020 Q4 2020 Q1 2021 Q2 2021 14.0
12.0 10.6
Revenue - Consumer Electronics 10.0
7.8
8.0
Wearable revenues increased by 13% to USD 16.0 million
6.0
in Q1 2021, and by 41% to USD 35.9 million for the first
half year 2021. The segment continues to benefit from 4.0
a particularly strong position in the premium domestic 2.0
market in China. 0.0
USD million X Q2 2020 Q3 2020 Q4 2020 Q1 2021 Q2 2021
Revenue - Healthcare
25.0
19.4 19.9 Revenues in the ‘Others’ category increased 64% year-
20.0 18.1 over-year to USD 16.5 million in Q2 2021, and by 55%
16.0 to USD 34.3 million for the first half 2021. This mainly
14.1
15.0 reflects sales to module manufacturers servicing a wide
variety of end products in all markets and regions.
10.0 USD million X
20.0
5.0 17.9
18.0 16.5
16.0
0.0 13.5
14.0
Q2 2020 Q3 2020 Q4 2020 Q1 2021 Q2 2021
Revenue - Wearables 12.0 10.7
10.1
10.0
Building & Retail revenues increased by 120% year over 8.0
year to USD 41.5 million in Q2 2021, and by 140% to 6.0
USD 76.9 million for the first half 2021. The increase 4.0
reflects continued growth for both industrial and home 2.0
automation applications, with lighting systems, different 0.0
types of sensors and control, and share-bikes among Q2 2020 Q3 2020 Q4 2020 Q1 2021 Q2 2021
the main drivers. Revenue - Others
9NORDIC SEMICONDUCTOR | Q2 & FIRST HALF REPORT 2021 (UNAUDITED)
Financial results
Amounts in USD thousand Q2 2021 Q2 2020 Change H1 2021 H1 2020 Change
Gross profit 75 109 45 905 63.6% 147 002 82 299 78.6%
Gross margin 50.9% 51.9% -1.0 p.p. 50.5% 51.9% -1.3 p.p.
Operating expenses excl. depreciation
45 945 29 886 53.7% 92 940 61 031 52.3%
and amortization
EBITDA 29 164 16 019 82.1% 54 061 21 268 154.2%
EBITDA % 19.8% 18.1% 1.7 p.p. 18.6% 13.4% 5.2 p.p.
Depreciation and amortization 9 038 7 575 19.3% 18 270 14 955 22.2%
EBIT 20 126 8 444 138.3% 35 792 6 313 467.0%
Gross profit Operating expenses for cellular IoT isolated were USD
Gross profit increased by 64% to USD 75.1 million in Q2 9.8 million in Q2 2021, compared to USD 7.0 million in Q2
2021, up from USD 45.9 million in Q2 2020. Gross margin 2020. Total operating expenses for the Wi-Fi business
of 50.9%, compared to 51.9% in the same quarter last was USD 3.0 million in the quarter.
year, reflecting, as previously guided, a higher share of
deliveries to larger customers for high volume products. Nordic capitalized a total of USD 2.4 million in
development expenses in Q2 2021, compared to USD
For the first half year 2021, gross profit increased by 79% 2.0 million in Q2 2020. USD 1.1 million of this related
to USD 147.0 million, with the gross margin declining to to cellular IoT investments and USD 1.3 million to the
50.5% from 51.9% in the same period last year. short-range business. Expenses related to equity
compensation was USD 1.7 million in Q2 2021.
Operating expenses
Operating expenses amounted to USD 45.9 million in Total cash operating expenses amounted to USD
Q2 2021, excluding depreciation and amortization, 46.7 million in Q2 2021, when adding back capitalized
compared to USD 29.9 million in Q2 2021. The increase development expenses and deducting depreciation
primarily reflects higher activity level and a significantly and equity-based compensation from total operating
larger workforce, which has grown by 32% to 1 087 expenses. This compares to USD 30.1 million in Q2 2020.
employees over the past year. The increase includes 81
employees acquired from Imagination Technologies on
December 31, 2020.
10NORDIC SEMICONDUCTOR | Q2 & FIRST HALF REPORT 2021 (UNAUDITED)
USD 32.6 million of cash operating expenses related to Depreciation and amortization increased to USD 9.0
payroll expenses (21.8). The company continues to invest million in Q2 2021, compared to USD 7.6 million in the
and add new employees to support a higher activity same quarter last year. The increase mainly reflects
level, strengthen customer relations, and continue its higher amortization of cellular IoT and Wi-Fi intangibles.
technology innovation. The number of employees in Amortization of internally developed R&D overall
R&D increased 35% to 821, including the Wi-Fi business amounted to USD 2.0 million and amortizing of leased
that was consolidated at the beginning of the year. The assets to USD 1.4 million.
Sales & Marketing staff increased 13% to 132, whereas
the supply chain organization increased 31% to 67 Operating profit (EBIT) was hence USD 20.1 million in Q2
employees to support the higher volumes. 2021, compared to an operating profit of USD 8.4 million
in Q2 2020. For the first half year 2021, EBIT increased
Other cash operating expenses were USD 14.1 million to USD 35.8 million from USD 6.3 million in the same
(8.3), with the increase reflecting the higher product period last year.
introductions and a generally higher activity level.
Net financial costs amounted to USD 0.4 million in Q2
For the first half 2021, operating expenses amounted 2021, comprising net interest cost of USD 0.2 million and
to USD 92.9 million, excluding depreciation and net foreign exchange losses of USD 0.2 million. In Q2
amortization, up from USD 61.0 million in the first half 2020, the company reported net financial cost of USD
2020. Cash operating expenses increased to USD 94.4 2.5 million, with net interest cost of USD 0.4 million and
million from USD 63.5 million in the first half last year. net foreign exchange loss of USD 2.1 million.
Profits Profit before tax was USD 19.7 million in Q2 2021,
EBITDA was USD 29.2 million in Q2 2021, compared compared to a profit before tax of USD 6.0 million in
to USD 16.0 million in Q2 2020. The reported EBITDA Q2 2020. Income tax expense was USD 2.4 million,
margin hence increased to 19.8% from 18.1% in the same compared to USD 0.3 million in Q2 2020. The company’s
quarter last year. statutory tax rate is 22%. Net profit was hence USD 17.3
million in Q2 2021, compared to a net profit of USD 5.7
Short-Range EBITDA was USD 40.7 million in Q2 2021, million in Q2 2020.
and the EBITDA-margin for the short-range business
28.4%. This compares to USD 22.7 million and 26.0% in For the first half 2021, profit before tax was USD 35.2
Q2 2020. These figures exclude the Cellular IoT business million and net profit USD 30.7 million. This compares to
and the recently acquired Wi-Fi business. USD 7.9 million and USD 4.4 million, respectively, in the
first half 2020.
For the first half 2021, EBITDA was USD 54.1 million,
compared to USD 21.3 million in the same period last
year. The reported EBITDA margin improved to 18.6%
from 13.4% in the first half 2021.
11NORDIC SEMICONDUCTOR | Q2 & FIRST HALF REPORT 2021 (UNAUDITED)
Financial Position
Amounts USD thousand 30.6.2021 31.12.2020 30.6.2020
Capitalized development expenses 34 473 34 563 34 909
Total non-current assets 115 428 113 906 99 824
Inventory 45 471 61 955 62 718
Cash and cash equivalents 227 434 242 547 124 354
Total current assets 412 922 401 909 259 253
Total assets 528 350 515 814 359 076
Total equity 414 945 402 492 241 961
Equity percentage 78.5% 78.0% 67.4%
Total liabilities 113 405 113 323 117 115
Total equity and liability 528 350 515 814 359 076
Total shareholders’ equity amounted to USD 414.9 The changes mainly reflect an increase in accounts
million at the end of Q2 2021, up from USD 242.0 million receivable to USD 126.2 million from USD 62.6 million at
a year ago and USD 402.5 million at the end of 2020. the end of Q2 2020 and USD 88.0 million at the end of
The Group equity ratio was 78.5% of a total asset base 2020. Inventory declined to USD 45.5 million, compared
of USD 528.4 million, compared to 67.4% of a total asset to USD 62.7 million a year ago and USD 62.0 million at
base of USD 359.1 million at the end of Q2 2020. At the the end of 2020. The reduction in inventory comes as a
end of 2020 total assets was USD 515.8 million with an result of the supply constraints.
equity ratio 78.0%.
Non-current assets amounted to USD 115.4 million at the
The strengthened equity position over the past year end of Q2 2021, compared to USD 99.8 million a year
reflects both positive earnings and a private placement ago and USD 113.9 million at the end of 2020. The year-
generating gross proceeds of approximately USD 125 on-year increase mainly reflects Wi-Fi assets acquired
million in September last year. Nordic has 190,958,613 from Imagination Technologies Group in Q4 2020.
shares outstanding.
Total current assets amounted to USD 412.9 million at the
Cash and cash equivalents amounted to USD 227.4 end of Q2 2021, up from USD 259.3 million at the end of
million, compared to USD 124.4 million at the end of Q2 2020 and USD 401.9 million at the end of 2020.
Q2 2020 and USD 242.5 million at the end of 2020. The
decline from year-end 2020 mainly reflects an increase Non-current liabilities amounted to USD 19.0 million,
in net working capital. compared to USD 18.9 million at the end of Q2 2020
and USD 21.5 million at the end of 2020. This mainly
Net working capital increased to USD 103.9 million at the reflects lease liabilities.
end of Q2 2021, up from USD 84.4 million at the end of
Q2 2020 and USD 79.0 million at the end of 2020. This Current liabilities amounted to USD 94.4 million,
was, however, a decline from USD 128.6 million at the compared to USD 98.2 million at the end of Q2 2020
end of Q1 2021. Measured as a percentage of last 12 and USD 91.9 million at the end of 2020. Nordic had no
months revenue, net working capital declined to 19.3% interest-bearing debt per the end of Q2 2021.
from 26.0% at the end of Q2 2020 and 19.4% at the end
of 2020.
12NORDIC SEMICONDUCTOR | Q2 & FIRST HALF REPORT 2021 (UNAUDITED)
Cash Flow
Amounts in USD thousand Q2 2021 Q2 2020 H1 2021 H1 2020
Cash flows from operations 54 566 5 279 27 858 6 775
Cash flows from investing activities -12 027 -6 985 -19 070 -13 481
Cash flows from financing activities -12 159 297 -23 944 42 414
Change in cash and cash equivalents 30 638 63 -15 114 33 710
Cash and cash equivalents at end of the period 227 434 124 354 227 434 124 354
Cash flow from operating activities was USD 54.6 million Funding
in Q2 2021, compared to USD 5.3 million in Q2 2020. The The Group’s cash position was USD 227.4 million at the
increase reflects higher profits and improvements in net end of Q2 2021, compared to USD 124.4 million at the
working capital end of Q2 2020 and USD 242.5 million at the end of 2020.
The cash is mainly kept in the Group’s functional currency
Cash flow from investing activities was an outflow of USD to minimize the impact of currency fluctuations.
USD 12.0 million in Q2 2021, compared to an outflow
of USD 7.0 million in Q2 2020. Capital expenditures Available cash including credit and overdraft facilities
-including software- amounted to USD 9.6 million, up amounted to USD 304 million, including Nordic’s right
from USD 5.0 million last year, whereas capitalized to borrow USD 65 million at any time under a Revolving
development expenses increased to USD 2.4 million Credit Facility (RCF), and EUR 10 million overdraft facility
from USD 2.0 million in the same period last year. The with the company’s main bank.
high capital expenditures are a result of early purchase
of test equipment in order to have high capacity when
we receive additional wafers. The current additions of
testers cover the requirement for 2021.
Cash flow from financing activities was an outflow of
USD 12.2 million, compared to an inflow of USD 0.3
million in Q2 2020. This reflected cash settlements of
options contracts of USD 10.6 million, and repayment of
lease liabilities of USD 1.5 million.
For the first half year 2021, cash flow from operating
activities amounted to USD 27.9 million (6.8), whereas
cash outflow for investing activities was USD 19.1 million
(-13.5). Net cash flow from financing activities was an
outflow of USD 23.9, compared to an inflow of USD 42.4
million in the first half last year.
13NORDIC SEMICONDUCTOR | Q2 & FIRST HALF REPORT 2021 (UNAUDITED)
Risk and uncertainity Nordic is in continuous dialog with its suppliers,
As described in the Annual Report for 2020, the company distributors, and customers about the effects of the
has identified four major groups of risk: Strategic, capacity constraints, and is doing its utmost both to
Operational, Financial and Legal & Compliance. Some secure additional wafers and help its customers manage
of these risks are outside of Nordic’s control, including the challenges brought about by the supply chain
industry and specific cyclical risks. The supply of and constraints. While risk remains, the company expects its
demand for semiconductors and electronic products is suppliers to maintain wafer deliveries at minimum the
sensitive to global economic conditions and international same level also through the fourth quarter of the year.
trade flows. While the underlying long-term market
trends point towards increasing demand for Nordic’s The tight supply situation across the semiconductor
products, the operations are exposed to a variety of industry also affects Nordic’s cellular IoT business, where
factors with real or perceived impact on the economy. the company module-based product is dependent on a
large number of third-party components and assembly
Please refer to the Annual Report for 2020 for a thorough capacity. This may affect delivery capabilities in the
review of the company’s main strategic risks and external second half of the year.
factors, including geopolitical risk and trade tensions,
the coronavirus, climate change and natural disasters, The company has seen no major changes to the
changes in the competitive landscape, risks related to financial risk compared to the statements given in the
the Bluetooth and Cellular IoT technologies, and risks Annual Report 2020. Nordic maintains a sharp focus
related to the dependency on key personnel. on cost and cash flows and navigates from a strong
position. Nordic’s strategy and growth ambitions require
The Annual Report also provides a review of operational an adequate cash position to fund the R&D activities
risks related to product availability, quality, safety, and needed to drive the technology and product roadmaps
integrity, risks related to product ramp, and IT and forward. The Group’s cash position was USD 227.4 million
cyber risk. at the end of Q2 2021, with available cash including
credit and overdraft facilities amounted to USD 304
As a fabless semiconductor company, Nordic is exposed million. The Board of Directors continue to assess the
to third-party suppliers’ ability to deliver the wafer volumes liquidity risk as low.
required to facilitate the company’s sales volumes. Due
to increasing imbalances in demand/supply through the Nordic holds minimal interest-bearing debt, and the
value chain, the company was early in the year informed direct risk associated with interest rate fluctuations is
by its main wafer supplier that wafer allocations would considered low. As described in the Annual Report 2020
be capped for 2021. The indicated wafer deliveries for the company also assesses the credit risk as low.
2021 would allow the company to increase its production
by a minimum 25% from 2020 to 2021, which is insufficient Nordic is exposed to foreign exchange risk, as sales
to meet the current strong demand. revenue and direct production costs almost in entirety
are nominated in USD, whereas operating expenses
The company has managed to maintain a higher primarily are in NOK and EUR. A 1% increase in USD/
growth level through the first and second quarters of NOK is – all other things equal – estimated to translate
the year, by ‘pulling-in’ wafers from subsequent quarters into USD 0.8 million in added profit before tax on
and hence advancing the wafer delivery schedule, and an annual basis. In the first half 2021 the USD/NOK
through a more favorable product mix. This also allows depreciated by 2%. Nordic does not use any financial
the company to guide for a revenue level of USD 130-150 instruments to hedge the currency risk. The company
million for Q3 2021, with the wider range reflecting the presents its accounts in USD, with profits translated into
continued uncertainty regarding wafer availability. NOK for taxation purposes.
14NORDIC SEMICONDUCTOR | Q2 & FIRST HALF REPORT 2021 (UNAUDITED)
Outlook
Revenue increased by more than 80% in the first half is that capacity may remain tight for at least another
2021, despite that limited availability of wafers has year. As earlier described, the strained semiconductor
capped production and prevented Nordic from taking value chain has prompted global chip manufacturers to
full advantage of strong demand from several global increase their planned capital expenditure significantly
platform companies, other tier-1 customers, and the to boost capacity. The company’s foundry partners
broad market. have further concretized these plans, and the physical
expansion of key process nodes for Nordic are on track.
The strong demand reflects fast technology adoption Nordic also sees signs of key wafer consumers moving
across all the company’s end-user markets as well as to denser nodes, which may untie capacity and allow
continuing technology migration from Bluetooth classic for increased wafer deliveries to Nordic.
to Bluetooth low energy and multiprotocol solutions. As
a result of the constrained capacity, the order backlog Nordic’s gross margin was 50.9% in Q2 2021 and 50.5%
increased more than six-fold from the end of June last for the first half year 2021, with the margin uplift from
year and by more than 150% from the end of 2020. the previous quarter reflecting a shift towards more
complex, higher margin SoCs. For the third quarter 2021
As previously reported, Nordic was early in the year the company forecasts a gross margin level of 50%-51%
allocated wafers allowing the company to increase its and reiterates its expectation that a higher share of
production by a minimum 25% from 2020 to 2021. The sales to tier-1 customers will move the gross margins for
significantly higher revenue growth in the first half of the the short-range business into the 48%-50% range in the
year reflects continuous efforts to advance the wafer medium term.
delivery schedule, in combination with a more favorable
product mix. This also allows the company to guide for a In 2019, Nordic presented the aspiration to build a USD
revenue level of USD 130-150 million for Q3 2021. 1 billion company within five years, and the positive
demand trends and continual strengthening of the
Nordic continues working to advance wafer delivery customer base lends increasing confidence to this
schedules to support customers experiencing strong target. Nordic believes its long-term growth prospects
end-product demand, and the company expects its are stronger than ever and intends to address its long-
suppliers to maintain wafer deliveries at minimum the term growth strategy on a Capital Markets Day in
same level also through the fourth quarter of the year. connection with the announcement of the results for Q3
on 21 October 2021.
Although Nordic expects higher wafer deliveries through
2022, forecasts are subject to uncertainty with regards to
the timeline. Visibility is limited and the current assessment
15Oslo, July 12, 2021
Jan Frykhammar Birger Steen Anita Huun
Board member Chair Board member
Inger Berg Ørstavik Svenn-Tore Larsen Endre Holen
Board member Chief Executive Officer Board member
Øyvind Birkenes Jon Helge Nistad Annastiina Hintsa
Board member Board member, employee Board member
Joel Stapelton Susheel Raj Nuguru Morten Dammen
Board member, employee Board member, employee Board member, employee
16NORDIC SEMICONDUCTOR | Q2 & FIRST HALF REPORT 2021 (UNAUDITED)
Condensed
financial information
Income statement
Full year
Amount in USD thousand Note Q2 2021 Q2 2020 H1 2021 H1 2020 2020
Total Revenue 147 591 88 529 290 823 158 692 405 217
Cost of materials -72 020 -42 624 -143 358 -76 317 -190 690
Direct project costs -462 - -462 -76 -584
Gross profit 75 109 45 905 147 002 82 299 213 943
Payroll expenses -32 479 -22 056 -68 429 -44 837 -101 211
Other operating expenses -13 467 -7 830 -24 511 -16 194 -35 954
EBITDA 29 164 16 019 54 061 21 268 76 778
Depreciation and amortization 6 -9 038 -7 575 -18 270 -14 955 -31 063
Operating profit 20 126 8 444 35 792 6 313 45 714
Net interest income -215 -390 -470 -536 -774
Net foreign exchange gains (losses) -228 -2 086 -91 2 103 -2 016
Profit before tax 19 683 5 968 35 231 7 880 42 925
Income tax expense -2 422 -263 -4 470 -3 525 -4 534
Net profit after tax 17 261 5 705 30 761 4 355 38 391
Earnings per share
Ordinary earnings per share (USD) 0.090 0.032 0.161 0.025 0.212
Fully diluted earnings per share (USD) 0.089 0.032 0.159 0.025 0.197
Weighted average number of shares
Basic 190 959 176 508 190 959 176 268 181 021
Fully Diluted 192 878 177 529 193 301 177 487 194 704
Net profit after tax 17 261 5 705 30 761 4 355 38 391
Other comprehensive income not to be
reclassified to profit or loss in subsequent
periods:
Actuarial gains (losses) on defined benefit
-84
plans (before tax)
Income tax effect 19
Other comprehensive income that may be
reclassified to profit or loss in subsequent
periods:
Currency translation differences 150 175 -389 -81 688
Total Comprehensive Income 17 411 5 880 30 372 4 274 39 014
17NORDIC SEMICONDUCTOR | Q2 & FIRST HALF REPORT 2021 (UNAUDITED)
Consolidated statement of financial position
Amount in USD thousand Note 30.6.21 31.12.20 30.6.20
ASSETS
Non-current assets
Goodwill 2 406 2 393 -
Capitalized development expenses 5/6 34 473 34 563 34 909
Software and other intangible assets 5/6 17 115 19 905 9 493
Deferred tax assets 3 681 3 668 2 571
Fixed assets 6 34 744 28 284 28 404
Right-of-use assets 6 23 009 25 092 24 446
Total non-current assets 115 428 113 906 99 824
Current assets
Inventory 45 471 61 955 62 718
Accounts receivable 126 202 88 034 62 646
Current financial assets - - -
Other current receivables 13 816 9 372 9 535
Cash and cash equivalents 227 434 242 547 124 354
Total current assets 412 922 401 909 259 253
TOTAL ASSETS 528 350 515 814 359 076
EQUITY
Share capital 317 317 303
Treasury shares -2 -2 -4
Share Premium 235 448 235 448 113 355
Other equity 179 180 166 727 128 307
TOTAL EQUITY 414 945 402 492 241 961
LIABILITIES
Non-current liabilities
Pension liability 468 448 262
Non-current lease liabilities 18 581 21 004 18 623
Total non-current liabilities 19 049 21 452 18 884
Current liabilities
Accounts payable 24 052 22 812 15 009
Income taxes payable 6 108 4 976 3 539
Public duties 9 358 8 789 4 073
Current lease liabilities 5 849 5 520 4 157
Current loan facility 7 - - 40 000
Current financial liabilities 857 302 -
Other current liabilities 48 132 49 472 31 453
Total current liabilities 94 356 91 871 98 231
Total liabilities 113 405 113 323 117 115
TOTAL EQUITY AND LIABILITY 528 350 515 814 359 076
18NORDIC SEMICONDUCTOR | Q2 & FIRST HALF REPORT 2021 (UNAUDITED)
Consolidated statement of changes in equity
Currency
Share Treasury Share Other translation Retained Total
Amount in USD thousand capital shares premium reserves reserve earnings equity
Equity as of 01.01.21 317 -2 235 448 15 980 379 150 368 402 492
Net profit for the period - - - - - 30 761 30 761
Other comprehensive income - - - - -389 - -389
Share based compensation - 0 - 2 902 - - 2 902
Option exercise - - - -20 821 - - -20 821
Equity as of 30.6.21 317 -2 235 448 -1 939 -9 181 129 414 945
Equity as of 01.01.20 303 -5 113 355 6 819 -309 112 042 232 205
Net profit for the period - - - - - 4 355 4 355
Other comprehensive income - - - - -81 - -81
Share based compensation - - - 1 205 - - 1 205
Sale of treasury shares
1 - 4 275 - - 4 276
(option exercise)
Equity as of 30.6.20 303 -4 113 355 12 299 -390 116 397 241 961
19NORDIC SEMICONDUCTOR | Q2 & FIRST HALF REPORT 2021 (UNAUDITED)
Statement of cash flows
Full year
Amount in USD thousand Note Q2 2021 Q2 2020 H1 2021 H1 2020 2020
Cash flows from operating activities
Profit before tax 19 683 5 980 35 231 7 892 42 925
Taxes paid for the period -240 -1 730 -1 988 -3 089 -2 955
Depreciation and amortization 9 401 7 575 18 633 14 955 31 063
Change in inventories, trade receivables
21 927 -8 569 -20 482 -12 475 -29 561
and payables
Share-based compensation 1 805 535 2 690 1 090 3 151
Movement in pensions - - - - 138
Other operations related adjustments 1 990 1 489 -6 225 -1 596 20 530
Net cash flows from operating activities 54 566 5 279 27 858 6 775 65 292
Cash flows used in investing activities
Capital expenditures (including software) 6 -9 585 -5 013 -15 018 -8 802 -16 480
Capitalized development expenses 6 -2 442 -1 972 -4 053 -4 679 -8 398
Business Combination, net of cash acquired - - - - -13 158
Net cash flows used in investing activities -12 027 -6 985 -19 070 -13 481 -38 035
Cash flows from financing activities
Changes in treasury shares - 1 253 - 4 353 10 455
Cash settlement of options contract -10 617 - -20 758 - -4 557
Capital increase - - - - 121 277
Repayment of lease liabilities -1 542 -956 -3 187 -1 939 -3 552
RCF drawdown - - - 40 000 40 000
RCF repayment - - - - -40 000
Net cash flows from financing activities -12 159 297 -23 944 42 414 123 622
Effects of exchange rate changes
258 1 472 43 -1 999 1 024
on cash and cash equivalents
Net change in cash and cash equivalents 30 638 63 -15 114 33 710 151 902
Cash and cash equivalents
196 795 124 291 242 547 90 645 90 645
beginning of period
Cash and cash equivalents at end of period 227 434 124 354 227 434 124 354 242 547
20NORDIC SEMICONDUCTOR | Q2 & FIRST HALF REPORT 2021 (UNAUDITED)
Notes
Note 1: General Note 3: Significant accounting principles
The Board of Directors approved the condensed Significant accounting principles are described in the
second quarter interim financial statements for the Group Financial Statement for 2020. The group accounts
three months ended 30 June 2021 and six first months for 2020 were prepared in accordance with International
of 2021 for publication on July 12, 2021. Financial Reporting Standards (IFRS), relevant
interpretations of this, as well as additional Norwegian
Nordic Semiconductor is a Norwegian fabless disclosure requirements described in the Norwegian
semiconductor company specializing in wireless GAAP and the Norwegian Securities Trading Act.
communication technology that powers the Internet
of Things (IoT). Nordic was established in 1983 and New standards, amendments to standards, and
has more than 1000 employees across the globe. interpretations have been published, but are not effective
The company’s award-winning Bluetooth Low Energy at December 31, 2021 and have not been applied in
solutions pioneered ultra-low power wireless, making it preparing these condensed financial statements. The
the global market leader. Nordic’s technology range was Group intends to adopt these standards, if applicable,
later supplemented by ANT+, Thread and Zigbee, and when they become effective.
in 2018 Nordic launched its low power, compact LTE-M/
NB-IoT cellular IoT solutions to extend the penetration of
the IoT. The Nordic portfolio was further complemented Note 4: Segment information
by Wi-Fi technology in 2021. In accordance with IFRS 8, the Group has only one
business segment, which is the design and sale of
Nordic Semiconductor ASA is listed on the Oslo Stock integrated circuits and related solutions.
Exchange under the ticker NOD, and is a public limited
liability company registered in Norway. The parent The Group classifies its revenues into the following
company’s head office is located at Otto Nielsens vei 12, technologies: Short range wireless components, long
7052 Trondheim. range (cellular IoT), ASIC components and consulting
services. Within Wireless components, the Group
reports its revenues based on the markets to which its
Note 2: Confirmation of the financial framework components communicate. These include: Consumer
The Group financial statements for Nordic Electronics, Wearables, Healthcare, Building and Retail,
Semiconductor ASA and its wholly owned subsidiaries, and Others.
together called “The Group” have been prepared in
accordance with IAS 34 Interim Financial Statements. The Group also reports its short range Wireless
The interim financial statements for Q2 2021 do not component revenue by proprietary wireless and
include all the information required for the full year Bluetooth protocols.
financial statements and shall be read in conjunction
with the Group Annual Accounts for 2020.
The financial statements are presented in thousand
USD, unless otherwise stated. As a result of rounding
adjustments, the figures in one or more rows or columns
included in the financial statements may not add up to
the total of that row or column.
In the interim financial statements for 2021, judgments,
estimates and assumptions have been applied that may
affect the use of accounting principles, book values of
assets and liabilities, revenues and expenses. Actual
values may differ from these estimates. The major
assumptions applied in the interim financial statements
for 2021 and the major sources of uncertainty in the
statements are similar to those found in the Financial
Statements for 2020.
21NORDIC SEMICONDUCTOR | Q2 & FIRST HALF REPORT 2021 (UNAUDITED)
Note 5: Intangible assets
The Group recognizes intangible assets in the balance The asset will generate future financial benefits.
sheet if it is likely that the expected future economic
benefits attributable to the asset will accrue to the Group
Sufficient technical, financial and other resources
for project completion are in place.
and the assets acquisition cost can be measured reliably.
Intangible assets with finite lives are amortized over
Costs associated with development are capital- the useful economic life and assessed for impairment
ized if the following criteria are met in full: whenever there is an indication that the intangible
asset may be impaired. The amortization period and
The product or the process is clearly defined
and the cost elements can be identified and
the amortization method for an intangible asset with a
finite useful life are reviewed at least at the end of each
measured reliably; reporting period. Changes in the expected useful life or
The technical feasibility is demonstrated; the expected pattern of consumption of future economic
benefits embodied in the asset are considered to modify
The product or the process will be sold or used in
the business;
the amortization period or method, as appropriate, and
are treated as changes in accounting estimates.
Note 6: Capitalization, depreciation and amortization
Specification of capital expenditures, Full year
balance sheet Q2 2021 Q2 2020 H1 2021 H1 2020 2020
Capitalized development expenses (payroll expen-
1 774 1 503 2 724 3 178 5 747
ses)
Capitalized acquired development expenses 668 469 1 329 1 502 2 651
Capital expenditures (including software) 9 585 5 013 15 018 8 802 16 480
Right-of-use assets (non-cash) 634 2 335 856 2 820 6 068
Acquisition (net) - - - - 13 966
Currency adjustments 198 81 -147 -31 362
Total 12 858 9 400 19 779 16 269 45 273
Depreciation and amortization
Capitalized development expenses 1 962 1 946 4 142 3 760 7 825
Software and other intangible assets 1 683 1 511 3 686 3 028 6 070
Fixed assets 3 987 2 940 7 563 5 878 12 188
Right-of-use assets 1 405 1 177 2 878 2 288 4 980
Total 9 038 7 575 18 270 14 955 31 063
22NORDIC SEMICONDUCTOR | Q2 & FIRST HALF REPORT 2021 (UNAUDITED)
Note 7: Net interest-bearing debt
The Group has long-term revolving credit facilities, which enables it to borrow up to USD 40 million and USD 25 million
at any time with an interest rate equal to LIBOR + margin. Both lines of credit expire end of November 2022. As of
June 30, 2021, the Group had not drawn on any credit facilities. The security for the credit lines are provided by
inventory, receivables and operating equipment.
The following financial covenants are included:
Equity ratio shall not be lower than 40 %.
In addition to the two RCFs, the Group has a MEUR 10 bank overdraft facility with its main bank. This overdraft was
not utilized at the end of June 2021. The overdraft facility expires end of November 2021.
Note 8: Stock options
Nordic has a stock option program for employees and management. Please see the annual report for 2020 for
information about the program.
H1 2021 H1 2020 Full year 2020
Outstanding options beginning of period 2 548 589 5 470 374 5 470 374
Granted - - -
Forfeited 19 001 33 303 53 976
Exercised (treasury shares used in settlement) - 880 615 2 850 587
Exercised (cash settlement due to cap being reached) 1 974 394 -
Expired - - 17 222
Outstanding end of period 555 194 4 556 456 2 548 589
Of which exercisable - 2 937 237 954 923
23NORDIC SEMICONDUCTOR | Q2 & FIRST HALF REPORT 2021 (UNAUDITED)
Note 9: RSU and performance shares
With reference to the Annual general meeting held on April 21, 2021, Nordic Semiconductor, on April 28, 2021,
granted 452 353 RSUs and performance shares to employees, including management. The shares vest over two
and three years. The Annual General Meeting of Nordic Semiconductor ASA approved the issue of up to 600
000 Restricted Stock Units (RSUs) and Performance Shares, equivalent to approximately 0.3% of the company’s
outstanding share capital.
H1 2021 H1 2020 Full year 2020
Outstanding RSUs beginning of period 690 617 - -
Granted 423 383 696 017 696 017
Forfeited 4 874 - 5 400
Exercised - - -
Outstanding end of period 1 109 126 696 017 690 617
H1 2021 H1 2020 Full year 2020
Outstanding performance shares beginning of period 114 020 55 813 55 813
Granted 28 970 58 207 58 207
Forfeited - - -
Exercised - - -
Outstanding end of period 142 990 114 020 114 020
Note 10: Financial risk
Nordic is exposed to several risks, including currency risk, interest rate risk, liquidity risk and credit risk. For a detailed
description of these risks and how the Group manages these risks, please see the annual report for 2020.
Note 11: Events after the balance sheet date
No events have occurred since June 30, 2021 with any significant effect that will impact the evaluation of the
submitted accounts.
Financial Calendar 2021: For further information, please contact:
October 21, 2021 - 3rd Quarter 2021 Ståle Ytterdal, IR, +47 930 37 430
February 3, 2022 - 4th Quarter 2021 Pål Elstad, CFO, +47 991 66 293
24NORDIC SEMICONDUCTOR | Q2 & FIRST HALF REPORT 2021 (UNAUDITED)
Board and Management
confirmation
We confirm that, to the best of our knowledge, the enclosed condensed set of financial statements for the first half
year of 2021, which has been prepared in accordance with IAS 34 Interim Financial Statements, gives a true and fair
view of the Company’s consolidated assets, liabilities, financial position and results of operations, and that the interim
management report includes a fair review of the information required under the Norwegian Securities Trading Act
section 5-6 fourth paragraph.
The Board of Directors and Chief Executive Officer of Nordic Semiconductor ASA
Oslo, July 12, 2021
Jan Frykhammar Birger Steen Anita Huun
Board member Chair Board member
\
Inger Berg Ørstavik Svenn-Tore Larsen Endre Holen
Board member Chief Executive Officer Board member
Øyvind Birkenes Jon Helge Nistad Annastiina Hintsa
Board member Board member, employee Board member
Joel Stapleton Susheel Raj Nuguru Morten Dammen
Board member, employee Board member, employee Board member, employee
25NORDIC SEMICONDUCTOR | Q2 & FIRST HALF REPORT 2021 (UNAUDITED)
Alternative
Performance Measures
The financial information is prepared in accordance with International
Financial Reporting Standards (IFRS) as adopted by EU. Additionally, it is
management’s intent to provide alternative performance measures (APM) that
are regularly reviewed by management to enhance the understanding of the
Group’s performance.
The Group has identified the following APMs used in reporting (amount in USD million):
Gross margin. Gross profit divided by Total revenue. Gross margin is presented as it is the main financial KPI to
measure the Group’s operational performance.
Full year
Q2 2021 Q2 2020 H1 2021 H1 2020 2020
Gross profit 75.1 45.9 147.0 82.3 213.9
Total revenue 147.6 88.5 290.8 158.7 405.2
Gross margin 50.9% 51.9% 50.5% 51.9% 52.8%
EBITDA terms are presented as they are commonly used by investors and financial analysts.
EBITDA. Earnings before interest, taxes, depreciation and amortization.
Full year
Q2 2021 Q2 2020 H1 2021 H1 2020 2020
Operating profit 20.1 8.4 35.8 6.3 45.7
Depreciation and amortization 9.0 7.6 18.3 15.0 31.1
EBITDA 29.2 16.0 54.1 21.3 76.8
EBITDA margin. EBITDA divided by Total Revenue.
Full year
Q2 2021 Q2 2020 H1 2021 H1 2020 2020
EBITDA 29.2 16.0 54.1 21.3 76.8
Total revenue 147.6 88.5 290.8 158.7 405.2
EBITDA margin 19.8% 18.1% 18.6% 13.4% 18.9%
26NORDIC SEMICONDUCTOR | Q2 & FIRST HALF REPORT 2021 (UNAUDITED)
Total Operating Expenses. Sum of payroll expenses, other operating expenses, depreciation and amortization.
Full year
Q2 2021 Q2 2020 H1 2021 H1 2020 2020
Payroll expenses 32.5 22.1 68.4 44.8 101.2
Other operating expenses 13.5 7.8 24.5 16.2 35.9
Depreciation and amortization 9.0 7.6 18.3 15.0 31.1
Total operating expenses 55.0 37.5 111.2 76.0 168.2
Cash operating Expenses. Total payroll and other operating expenses adjusted for non-cash related
items including option expenses, receivable write-off and capitalization of development expenses. Nordic
management believes that this measurement best captures the expenses impacting the cash flow of the Group.
Full year
Q2 2021 Q2 2020 H1 2021 H1 2020 2020
Total operating expenses 55.0 37.5 111.2 76.0 168.2
Depreciation and amortization -9.0 -7.6 -18.3 -15.0 -31.1
Option expense -1.7 -1.8 -2.6 -2.2 -4.3
Capitalized expenses 2.4 2.0 4.1 4.7 8.4
Cash operating expenses 46.7 30.1 94.4 63.5 141.2
Order backlog. Customer orders placed by the end of the reporting period for delivery in next and following
quarters. This APM can be used as support for guidance for next quarter.
Adjusted EBITDA margin. EBITDA excluding cellular IoT, divided by Total revenue excluding cellular IoT revenue.
This APM shows Nordic's profitability excluding products in an investment phase with limited revenue.
Full year
Q2 2021 Q2 2020 H1 2021 H1 2020 2020
Reported EBITDA 29.2 16.0 54.1 21.3 76.8
Long range (cellular IoT) EBITDA loss 8.5 6.7 17.9 13.1 30.2
WiFi expenses 3.0 - 5.2 - -
Adjusted EBITDA 40.7 22.7 77.2 34.4 106.9
Total revenue (excluding cellular IoT revenue) 143.0 87.4 285.0 156.4 398.7
Adjusted EBITDA margin 28.4% 26.0% 27.1% 22.0% 26.8%
27You can also read