Industry projections 2020 - Australian cattle - MLA
←
→
Page content transcription
If your browser does not render page correctly, please read the page content below
Industry projections 2020
Australian cattle MLA’s Market Intelligence – globalindustryinsights@mla.com.au
KEY POINTS KEY 2020 NUMBERS
National herd expected to fall to lowest level since 1992 Slaughter:
Adult cattle slaughter to see sharp contraction on the 7.2 million head
back of sustained drought
Carcase weights:
China the centre for global protein trade in 2020
292 kg/head
Production:
2.1 million tonnes cwt
Beef exports:
1.0 million tonnes swt
* Graphic illustrates year-on-year change
Summary
The national cattle herd is set to drop to its lowest level in more than two decades in 2020, following one of the most
challenging years on record. In 2019 Australian producers experienced the warmest and driest year ever which was
compounded by floods and bushfires at either end of the year. However, despite all these pressures, global and domestic
demand for beef has remained robust and helped support cattle prices during these extreme conditions. From a cattle supply
perspective, numbers over the next two years are expected to tighten considerably; to what extent will be determined by
domestic and global influences, with rainfall and demand from China the stand-out variables.
Adult cattle slaughter in 2020 is currently forecast to drop 15% to 7.2 million head. Rainfall throughout January has provided an
element of renewed confidence for producers. However, the impact of the extreme conditions last year is expected to maintain
elevated slaughter in the first quarter, with an expected tightening of supply as the year progresses. Female slaughter reached
new highs in 2019, but is expected to drop off in 2020 as the herd shifts from contraction to rebuild phase – assuming a return
to average seasonal conditions. However, with feed and water availability tight in many regions, any persistence of dry
conditions beyond the start of year may see 2020 follow the trends seen in 2019.
The lot feeding sector has been growing in recent years in response to strong demand for high quality grainfed beef and its key
role in finishing cattle in drought conditions. Over one million head of cattle on feed has been maintained over the last seven
quarters and this is set to continue in 2020, despite the potential for higher feed and feeder costs. In the past year lot feeders
have been a key buyer, paying a premium for cattle and helping maintain prices at historically strong levels. The expected
increased grainfed portion of turn-off combined with the lower percentage of female slaughter means carcase weights are
expected to increase 3% in 2020. Higher weights should offset some of the decline in slaughter, with production forecast to
be down 13% to 2.1 million tonnes carcase weight (cwt).
The global protein market experienced an exceptional year in 2019, with the impact of African Swine Fever in China creating a
massive protein deficit and a reshaping of the global meat trade as more product was directed to the China market. Australian
beef exports were very much part of this shift, with exports to China growing 85% and the market emerging as Australia’s
largest market by volume. The protein deficit in China is set to be just as apparent in 2020, but many shifts in the global
landscape will impact how this unfolds, including the US-China trade relationship, production and policies from South American
suppliers and policy shifts within China itself. Demand for beef from many other key markets around the world remains robust,
but buyers must now compete more fiercely for that product.
Australian cattle prices are expected to find support in 2020 in the event of a major improvement in seasonal conditions as
restockers, feeders and processors compete over a reduced pool of livestock. Young cattle and breeding stock prices will be
influenced significantly by the extent of the improvement in pasture availability. With cattle supplies anticipated to tighten over
the next few years, continued support for finished cattle prices is expected. Even without rain, finished cattle prices should
remain at historically high levels as a result of the aforementioned strong demand fundamentals.
Industry projections 2020 – Australian cattle – February 1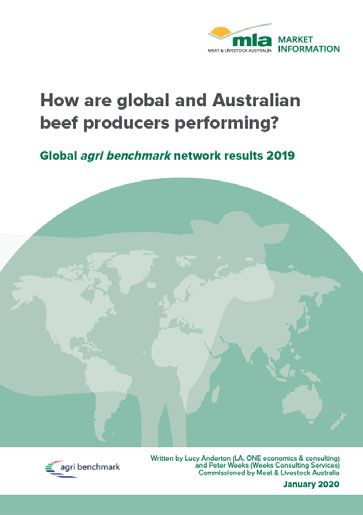
Assumptions
Close to average seasonal conditions have been assumed for the majority of Australia's cattle producing regions until
April 2020, with the assumption of a return to average seasonal conditions for the remainder of the projections period.
The latest three-month outlook from the Bureau of Meteorology (Figure 1) forecasts that February through April will see
close-to-average rainfall and a slight easing in the higher-than-average temperatures. Parts of northern WA, the Cape
York Peninsula of Queensland and the far north of the NT are expected to see above average rainfall throughout this
time.
Critically, the improved outlook does not promise the
above-average rainfall needed to fully and quickly reverse Figure 1: Australian rainfall outlook – February to April 2020
the impact of the extreme conditions last year. 2019 was Chance of exceeding the median rainfall
officially the warmest and driest year on record. The
Legend
annual national mean temperature was 1.5°C above
Above 65% chance
average and national rainfall was 40% below average. Soil 60%-65% chance
moisture deficiencies in the root zone (from 0 to 100 cm 55-60% chance
deep) have depleted to a point where sustained rainfall is 45-55% chance
40-45% chance
required to return to adequate levels. Large parts of NSW 35-40% chance
and Queensland have received some useful rainfall Below 35% chance
throughout January, however further widespread rain will
be required to sustain pasture growth.
The Australian dollar depreciated to its lowest level in 15
years, averaging 69US¢ in 2019. This provided great
Source: Bureau of Meteorology
support to Australian red meat exports and the major
banks anticipate much of the same in 2020, with forecasts
ranging from 67US¢ to 71US¢. Figure 2: Australia’s annual mean temperature is increasing
Degrees centigrade
2
At this stage, the full impact on livestock from the
1.5
devastating national bushfire crisis is unknown as fires are
1.0
still underway in some regions and access to some areas
0.5
restricted. There have been some reported significant
0
losses in specific regions including Kangaroo Island and
-0.5
in north-east Victoria and southern NSW with a mix of
dairy and beef farms affected. The current reported losses -1.0
represent under 0.1% of the national herd, but this may -1.5
10
15
20
25
30
35
40
45
50
55
60
65
70
75
80
85
90
95
00
05
10
15
20
19
20
19
20
19
19
19
19
19
19
19
19
19
19
19
19
19
19
20
19
19
20
20
climb in coming weeks.
Source: Bureau of Meteorology – Average 1961-90 (20.5)
Cattle herd and slaughter
Australian cattle producers enter 2020 on the back of one of the most challenging years on record. Conditions in 2019
deteriorated to critical levels as the longevity, severity and widespread nature of the current drought exhausted feed and
water availability in most production regions, in particular, south-east Queensland and northern NSW. On top of the drought
conditions, north Queensland experienced severe flooding in early 2019, resulting in the loss of hundreds of thousands of
cattle. More recently, many parts of Australia have been affected by devastating bushfires. For some, the financial pressures
associated with keeping livestock on-farm reached a tipping point.
The extent of widespread destocking is reflected in the high percentage of female slaughter. Last year, on a 12-month rolling
average basis, the female portion of total slaughter reached 55% and in three consecutive months (June, July and August) hit
an unprecedented 58%. The scale of destocking within the national breeding herd in the second half of 2019, combined with
a mostly neutral outlook in the first quarter of 2020, is likely to
result in cattle turn-off remaining elevated. Subsequently, the Figure 3: National cattle herd
million head
national herd is forecast to decline 5.8% year-on-year by the 30
end of June 2020. At 24.7 million head, this would represent a 29
cumulative fall of 12.4% since June 2018. 28
27
When forecasting national cattle slaughter in 2020, both 26
25
domestic and international influences offer a range of
24
potential scenarios. However, the impact of the unrelenting
23
drought has seen the pool of available slaughter cattle 22
3f
20 -19e
contract. Adult cattle slaughter is expected to fall 15% year-
20 -01
20 -02
20 -03
20 -04
20 -05
20 -06
20 -07
20 -08
20 -09
20 -10
20 -11
2 0 12
20 -13
20 -14
20 -15
20 -16
20 -17
20 f
21 f
22 f
20 -18
20 -20
20 -21
20 -22
-2
11-
10
12
13
16
14
15
00
09
06
02
03
07
01
04
05
08
17
18
19
20
on-year to 7.2 million head in 2020 and to 7.1 million head Source: ABS, MLA forecasts
in 2021.
Industry projections 2020 – Australian cattle – February 2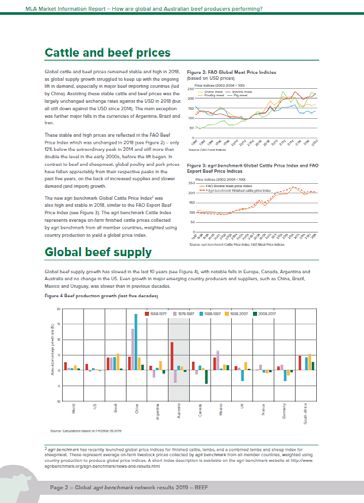
Almost all key production regions, except for north-east Queensland and southern Victoria, have seen consecutive years of
substantially lower branding rates. The male component of national slaughter in 2019 highlighted the challenges producers
have faced over the past two years in regards to productivity. For 2019 (year-to-November) male slaughter eased 7% year-on-
year, underlining the limited availability of steers for finishing.
The trajectory of global meat prices will also have a bearing on processor numbers over the next 12 months. Any further rises,
which could eventuate given the anticipated global protein deficit, would likely see livestock grids increase as well.
Producers, particularly in the worst affected regions, could be incentivised to sell during this window as opposed to
prioritising a herd rebuild.
It will require a period of sustained average or above average seasonal conditions to reinvigorate market confidence. In the
event of additional widespread rainfall, before the end of the northern wet season and solid autumn break in the south, adult
cattle slaughter could fall below 7 million head in 2020. Conversely a continuation of drought conditions would continue to
force many producers to offload stock and, despite the depleted herd numbers, slaughter could rise to 8 million head.
Current forecasts have 2021 as the likely low point for supply should Australia see a return to average seasonal conditions,
with a herd rebuild commencing in the second half of this year and continuing over the remainder of the projection period
(2020 to 2023).
Figure 4: Female slaughter Figure 5: National adult cattle slaughter
% million head
60 10
Female % of slaughter Rolling 12-month average Average
9
55 8
7
50 6
5
45
4
3
40
2
1
35
0
01 02 03 04 05 06 07 08 09 10 11 12 13 14 15 16 17 18 19 f f f
16 017 018 19e 20 021 22 23
f
20 20 20 20 20 20 20 20 20 20 20 20 20 20 20 20 20 20 20
00
01
02
03
04
05
06
07
08
09
10
11
12
13
14
15
20
20
2 2 20 20 2 20 20
20
20
20
20
20
20
20
20
20
20
20
20
20
20
20
Source: MLA, ABS Source: ABS, MLA forecasts
Cattle on feed
Cattle on feed hit record levels in 2019, as the lot feeding sector utilised increased capacity to respond to strong
demand from high quality grainfed markets and provide a key role in drought mitigation for producers. Feedlot
inventories have now been sustained above one million head for seven consecutive quarters. For the year ahead, the
number of cattle on feed is expected to remain at a historically high level, albeit likely easing from the record numbers in
2019.
Australia's feedlot capacity has been steadily increasing in recent years, accounting for a greater portion of Australian
beef production, particularly during times of constrained grassfed availability. With the expectation of a sharp decline in
slaughter in 2020, driven by a reduction in the number of cows and heifers being processed, grainfed cattle as a
percentage of national slaughter will likely reach record levels.
Supporting the sustained high number of cattle on feed will be critical in limiting the impact of a fall in cattle slaughter
and beef production on processor throughput and profitability, given robust global demand and meat prices.
Elevated feed prices and concerns over water availability Figure 6: Grainfed cattle turn-off
continue to provide challenges for the lot feeding sector. ‘000 head Cattle on feed % of adult cattle slaughter (RHS) %
1,400 50
However, the biggest challenge for many feedlots will be
45
the potential price of feeder cattle. Any improvement in 1,200
40
pasture conditions will revive restocker interest and see a 1,000 35
quick response in prices. In the absence of strong 30
800
competition for store cattle heading back to the paddock 25
in 2019, restocker buyers traded at a consistent discount 600 20
to feeder buyers. A reverse of fortunes would pressure 400 15
feedlot inputs, with store prices overtaking finished 10
200
5
livestock prices. Compared to young cattle, finished cattle
0 0
traded at an average premium of 10% in 2019, however 17 18 19
04
05
06
07
08
09
10
11
12
13
14
15
16
20 20 20
20
20
20
20
20
20
20
20
20
20
20
20
20
the 10-year average favours a 5% premium in favour of Source: ALFA, MLA, MLA Calculations
store cattle.
Industry projections 2020 – Australian cattle – February 3Carcase weights and production
National adult carcase weights are estimated to have fallen 7.3kg to 283kg in 2019, driven by poor pasture conditions
and the high percentage (55%) of female slaughter. Since the record highs in 2017, average carcase weights have
followed a downward trend, declining across both males
and females by 5kg/head and 8kg/head respectively. Figure 7: Adult carcase weights
kg/head Male Female
340
Average adult carcase weights are forecast at 292kg in 320
2020, a 3% increase from 2019. Heavier carcase weights 300
are forecast as the result of a decline in the percentage of 280
female slaughter, lower stocking rates, a higher ratio of 260
cattle on feed and the prospect of better pasture 240
conditions. Male and female average carcase weights are 220
forecast to increase to 326kg and 256kg respectively in 200
2020. 16
19
18
04
05
06
07
08
09
10
11
12
13
14
15
1 7
20
20
20
20
20
20
20
20
20
20
20
20
20
20
20
20
Source: ABS
In 2019, a number of processors offered grid price
premiums for HGP (hormone growth promotants) free beef,
largely driven by the growing influence of China – a HGP Figure 8: National beef and veal production
million tonnes cwt
free destination for Australian beef – and consumer demand 2.6
for more natural ('free-from') beef. If HGP premiums remain
2.4
or grow, more producers may consider sacrificing weight
gain for market access, potentially curbing the upside for 2.2
average carcase weights. 2.0
Total beef and veal production is forecast to drop 13% in 1.8
2020 to 2.1 million tonnes cwt as a result of the sharp
1.6 1 1
decline in adult cattle slaughter. As mentioned, the impact 00 00 02 03 04 05 06 07 08 09 010 201 012 013 014 015
16
17
18
19
20 f
20 f
20 f
f
20
21
22
23
20 2 20 20 20 20 20 20 20 20 2
20
20
20
20
2 2 2 2
20
of widespread rainfall in the first half of 2020 could see Source: ABS, MLA forecasts
beef production fall further as cattle supplies tighten.
However, with available feed (low stocking rates) and the prospect of high (possibly record) finished prices, producers
would have a strong incentive to add weight, helping to offset some of the expected decline in production.
Domestic demand
Australia remains one of the largest per capita consumers of beef in the world and is still the largest market for
Australian beef. However, total consumption of beef dropped slightly in 2019 as the backdrop of a soft Australian
economy and rising retail prices impacted affordability and consumer demand. Australians have experienced stagnant
wage growth in recent years and, coupled with rising living costs, this has placed increased pressure on food spend, the
second largest household cost after housing.
Figure 9: Australian retail prices
A¢/kg Beef Lamb Pork Chicken
All of the major proteins experienced a rise in retail prices 2,500
in the last 12 months as the drought impacted feed costs 222% 287% 360%
index to index to index to chicken
for all suppliers. The average retail price of beef climbed to 2,000 chicken chicken
$20.24/kg, up 5% on last year, with lamb up 14%, pork up 1,500
1% and poultry up 4% to its highest price on record. Beef
remains 3.6 times the price of chicken and, with the 1,000
growing price differential of beef to other major proteins, 500
justifying and delivering value to the consumer has
become critical. 0
16 17 18 19
05
15
09
00
02
04
06
08
10
12
14
03
13
07
01
11
20 20 20 20
20
20
20
20
20
20
20
20
20
20
20
20
20
20
20
20
Source: ABS, ABARES
Despite the price pressure, beef dollar sales increased in
the retail channel last year, with growth across the major
retailers as well as in butcher shops. Demand has been Figure 10: Retail fresh meat value share in Australia – 2019
particularly strong in premium areas such as prime steak,
pre-prepared beef and premium mince, highlighting the Beef – 34%
value consumers place on beef despite the price gap. In
Chicken – 31%
2019, beef maintained its market leading position on
Australian retail shelves, with 34% market share of fresh Lamb – 12%
meat retail sales – more than three times the size of fresh Pork – 10%
pork (AC Nielsen Homescan).
Seafood – 10%
Other – 3%
Source: AC Nielsen Homescan, MAT to 03/11/2019
Industry projections 2020 – Australian cattle – February 4Australian retail shelves are becoming increasingly competitive each year as our population demographics shift with
growing migration (30% of Australians are born overseas) and exposure to new cuisines expands. Maintaining per capita
beef consumption will be a challenge as forecast supply constraints in coming years place further pressure on beef
prices and lead to a growing price spread against chicken and pork. However, there are still plenty of opportunity areas,
particularly when focusing on growing consumer demand for better quality, more nutritious, versatile and convenient
food offerings.
International markets
Global beef demand lifted in 2019, as China further entrenched its position as the world's largest imported beef market.
Fuelled by the spread of African Swine Fever and a swelling affluent consumer class, the conditions in China that have
underpinned demand growth look set to continue in 2020. More broadly, despite trade wars and key countries
experiencing a slowdown in manufacturing output, the global economy resisted recession last year and consumer
markets, particularly in the US and China, proved surprisingly resilient.
Australian beef exports expanded 9% year-on-year in 2019 to 1.23 million tonnes shipped weight (swt), with all the
additional volume being captured by China. Frozen beef exports surged, up 11% year-on-year, while chilled beef exports
crept up 4%. Export unit prices lifted to new highs, averaging A$8.17/kg FOB over the 12 months to November 2019, up
from A$7.31/kg FOB a year prior, reflecting a softer Australian dollar and strong global demand.
The Australian dollar remained soft for the entirety of 2019,
lessening the impact of rising cattle prices on international Figure 11: Global cattle prices compared
A$/kg lwt US Australia Brazil Argentina
consumers. However, South American currencies such as 500
the Brazilian real and Argentine peso remained even
weaker, reinforcing their export position and making them
400
highly price-competitive in global markets.
Australian finished cattle prices crept closer to their US 300
counterparts throughout 2019 but diverged towards the end
of the year. Prior to 2015, Australian cattle prices closely
200
tracked those in South America on a currency adjusted
basis, but the separation in markets following the 2014–15
drought has not reversed, partly due to relatively tight 100
2012 2013 2014 2015 2016 2017 2018 2019
supplies of finished cattle in Australia and South American Source: IPCVA (Argentina); MLA’s NLRS (Australia); Esalq/Cepea (Brazil);
currencies coming under significant downward pressure in USDA/Steiner Consulting Group (US). Finished cattle (steer) specifications vary between indicators
recent years. While elevated prices are positive for
Australian producers, when compounded by high slaughter and supply chain costs, it makes Australian beef relatively
expensive and defending share, especially in price-sensitive markets, particularly challenging.
Looking ahead, the International Monetary Fund have the global economy forecast to expand 3.3% in 2020, up
marginally from the 2.9% estimated in 2019, with six of Australia's top ten export markets expected to grow in excess of
2%. However, the global economy remains sensitive to US-China trade relations and a further slowdown in some sectors
could spill over to hurt consumer confidence and beef demand.
In 2020 Australian beef exports are forecast to decline 16% to 1.03 million tonnes swt, one of the lowest levels in recent
years, but still higher than any year before 2013. At 3–4% of global beef production, Australia alone cannot keep pace
with global demand growth, but rather needs to continue identifying and developing markets which are able to pay a
premium for its high quality beef. While China has rapidly become the largest market in the world, Australia has access
to many of the most valuable markets in the world, including Japan, Korea and the US. Australia's access to this broad
and diverse global market is critical in contributing to the industry’s growth and ability to mitigate risks.
Global beef GLOBAL SNAPSHOT l BEEF
This report offers a comprehensive overview of the global beef industry
and Australia’s trade relationship with the world.
Market MARKET SNAPSHOT l BEEF & SHEEPMEAT
Japan
Meat consumption 55.6kg per capita*
total meat protein**
snapshot snapshots
3.07
The outlook for global beef consumption is positive, largely underpinned by growth in population and household wealth in 2.90
developing markets, particularly Asia. Australia produces only 4% of global beef production, but accounts for around 16% of world
trade and has consistently been one of the top three largest exporters for several decades. While Australian beef faces a number of Globally, Japan has the second highest number of households 10.6kg per capita*
2019
headwinds, particularly regarding an expected downturn in production, there are many opportunities for targeted growth. earning disposable income over US$35,000/year after the US, 1.28 1.29 1.34 1.41 2023
with a highly sophisticated supply chain infrastructure. While the 0.1kg per capita*
country’s population and economic growth are subdued 0.02 0.02
Key points compared with many neighbouring markets in Asia, its affluent Pork Poultry Beef Sheepmeat
and urbanised consumers will continue to demand high volumes
• Australian beef exports are expected to decline in 2020 due • In developed markets, consumers are seeking differentiated in million tonnes cwt * 2019e per person per year in cwt ** Excluding fish/seafood
of quality imported proteins, such as Australian red meat. Source: Fitch Solutions (2019 estimate and 2023 forecast), OECD Agriculture Statistics: OECD-FAO
to a diminished herd, following elevated drought-induced segments within the beef category, such as grassfed and Agricultural Outlook (Edition 2018), GIRA
turnoff through 2018 and 2019. grainfed product, certified breeds or raising claims.
• African Swine Fever has had a dynamic and rapid influence Australia’s diverse production system allows the industry to
Population Households earning* Households earning* Households earning*
upon the global meat market, with Chinese import demand target a broad range of differentiated opportunities across
>US$35k/year >US$50k/year >US$75k/year
driving price inflation across all major proteins in 2019. Chinese markets.
demand has led to a huge trade shift, with many major beef • In many mature markets, growing consumer interest and
126.9 28.7 14.7 5.2
MLA’s market snapshots
exporting nations pivoting towards the market. This has left awareness of provenance, sustainability, animal welfare,
This report offers a various traditional markets with a meat supply deficit.
• Growing production and exports from key competitors,
particularly the US and Brazil, will intensify competition in
coming years, especially in Asian markets. For now, strong
global demand, led by the pork shortage in China, has
food safety and traceability provide messaging
opportunities for Australian beef brands and underpin
ambitious industry-wide programs for Australia to
differentiate itself.
• The high price of beef in comparison to competitor proteins
in 2019
125.3
in 2023
in 2019
39.0
in 2023
in 2019
24.1
in 2023
in 2019
9.8
in 2023
soaked up additional beef on the global market and such as chicken and pork, will continue to test growth and in million in million households in million households in million households
aim to give a better
Source: Fitch Solutions, 2019 estimate and Source: Fitch Solutions, 2019 estimate and Source: Fitch Solutions, 2019 estimate and Source: Fitch Solutions, 2019 estimate and
supported prices. keep the category sensitive to economic conditions and 2023 forecast 2023 forecast 2023 forecast 2023 forecast
comprehensive overview • Growing household incomes in developing markets are
providing many consumers the ability to increase protein
consumption, with those shifting into the middle-upper
income brackets often seeking to improve the quality of
meat they consume.
consumer purchasing power.
• There is growing consumer interest in alternative proteins
with a number of meat substitutes becoming more
embedded in the mainstream marketplace, directly
competing for market share with beef and other proteins.
*Disposable income: earnings after taxes and social security charges.
Japan is the largest export destination for Australian beef for more than two decades, in both volume and
value. It is also the largest market for grainfed beef, taking half of total grainfed exports.
understanding of
Australian beef Australian beef Proportion of key cuts Australia’s share
exports – volume exports – value (beef) of beef imports
of the global beef industry Global population
7.709 8.027
Households earning* >US$35k/year
304.8 378.4
Australia’s share of exports
Brazil – 20%
Australia – 16%
India – 15%
US – 13%
17% 11%
31%
Chilled grass
Chilled grain
Frozen grass
43%
57%
Chilled
Frozen
30%
6%
39%
Manufacturing
Brisket
Silverside
/outside
Blade 49%
Australia
Other
countries
Australia’s main red meat
41% Frozen grain Topside
million million NZ – 6% 6%
7% 12% /inside
in 2019 in 2023 Argentina – 6% Other
in 2023
and Australia’s trade
in 2019 Canada – 5%
Rest of world – 18% Total 302,756 tonnes swt Total A$ 2.31 billion
Source: DAWR, 2018–19 Source: ABS/IHS Markit, MAT (12 months Source: DAWR, 2018–19 Source: IHS Markit, FYTD (July 2018 – May
in billion in nominal USD/person ending May 2019) 2019)
Source: BMI Research, 2019 estimate & 2023 forecast Source: BMI Research, 2019 estimate & 2023 forecast Source: IHS 2018–19
relationship with the world.
Australian beef exports – volume
Chilled grain – 14%
Frozen grain – 13%
Chilled grass – 13%
Australian beef exports – value
Frozen – 62%
Chilled – 38%
Australian beef exports – cuts
Manufacturing – 35%
Brisket – 10%
Blade – 7%
Chuck roll – 6%
Silverside/outside – 6%
markets along with Australian sheepmeat
exports – volume
Japan is a consistent buyer of Australian sheepmeat and is the largest chilled lamb customer within Asia.
2018-19 exports fell 4% on year ago levels – due to a decrease in supply.
Australian sheepmeat
exports – value
Proportion of key cuts
(lamb)
Australia’s share of
sheepmeat imports
3%
Frozen grass – 60% Topside/inside – 5% 4%
insights into what’s driving
Shoulder
Shin/shank – 4% 7%
Others – 28% 34% 42% Chilled lamb 30% Manufacturing
7% Australia
Lamb Rack
64%
Frozen lamb
Total 1,125,657 tonnes swt Total A$9.48 billion FOB Other
Chilled mutton Mutton 14% Leg
70% 65% countries
Frozen mutton Carcase
1% 23% Other
Total 14,210 tonnes swt Total A$143.4 million
MLA GLOBAL SNAPSHOT Beef January 2020 1
consumer demand. Source: DAWR, 2018–19
MLA MARKET SNAPSHOT
Source: ABS/IHS Markit, MAT (12 months
ending May 2019)
BEEF AND SHEEPMEAT JAPAN
Source: DAWR, 2018–19 Source: IHS Markit, FYTD (July 2018 – May
2019)
August 2019 1
To view the Global Beef snapshot click here To view market specific snapshots click here
Industry projections 2020 – Australian cattle – February 5China
The spread of African Swine Fever in China – and the Figure 12: Exports to China from major beef suppliers
sizable protein gap left in its wake – has had a dynamic ‘000 tonnes swt 2017 2018 2019*
450
and swift influence on global meat markets, intensifying 29%
400 75%
demand for imported beef and stimulating meat price 350
23%
inflation in the second half of 2019. Chinese pork 25%
300
production in 2020 is forecast to be down 40% on 2017
250
(pre-ASF) levels, estimated to equate to a pork shortfall of 55%
17% 67% 47%
200 55%
22 million carcase weight (cwt) metric tonnes. 51% 14%
150
11% 25%
The pork vacuum in China has drawn unprecedented 100 46% 20%
amounts of meat into the market but volumes still pale in 50
significance compared to the losses in domestic pork 0
Argentina Brazil Uruguay Australia NZ
production. China beef imports exceeded 1.5 million tonnes Source: Global Trade Atlas - % indicates suppliers share of total beef exports to China, DAWR
*2019 export volumes are for the year-ending-November
shipped weight (swt) in 2019, an increase of about 60% on
top of the already elevated levels recorded in 2018.
Underpinned by African Swine Fever and a swelling affluent consumer class, China emerged as the top destination for
Australian beef exports in 2019, with shipments surpassing 300,000 tonnes swt, up 84% year-on-year. Strong growth
was recorded in premium and lower-value exports alike. Albeit off a smaller base, chilled exports to China more than
doubled to 30,000 tonnes swt, while frozen exports increased by 81% to 270,000 tonnes swt.
China represented 24% of total Australian beef exports in 2019, up from 14% in 2018 and just 11% in 2017. In October,
November and December, monthly beef export volumes to China exceeded 30,000 tonnes swt, drawing product away
from other markets that struggled to compete on price.
In the last two years China has emerged as the principal beef export destination for most of the other major producing
nations, with the US a notable exception. Argentina, Brazil and New Zealand also experienced year-on-year export
growth to China in excess of 50% in 2019 as rising prices pulled supply from their domestic and alternative export
markets. While Chinese demand appears insatiable, the imported beef market has become increasingly crowded as
more countries are granted access and additional plants in South America, particularly Brazil and Argentina, are
approved.
While there has never been so much beef traded on the global market, it is increasingly geared to one buyer and
remains sensitive to demand and policy shifts in China. This was evident late last year when, after the market
overheated, importers sought to renegotiate contracts with product on the water. A broader slowdown in demand from
China – either from an eventual recovery in its pig herd or an economic contraction – would directly hurt Australian
exports and indirectly increase competition elsewhere as major exporters redirect beef to other markets.
Japan
Japan remains an important export market for Australian beef but it relinquished its number one spot in 2019, falling
short of shipments to China by 13,000 tonnes swt. Australian beef exports to Japan decreased by 9% to 287,000 tonnes
swt, and were predominantly made up of chilled grainfed (92,000 tonnes swt) and frozen grassfed (117,000 tonnes swt)
product. Relative to 2018, the 13% decline in frozen beef
exports accounted for the majority of the drop in total Figure 13: Japan beef imports
shipments to Japan, while chilled exports were less 350
‘000 tonnes swt 2017 2018 2019*
affected, back just 3%. Lower frozen shipments from
300
Australia were offset by greater volumes from Canada, New -5%
Zealand and Mexico. 250
-5%
200
Broadly, beef demand in Japan remains strong with per 150
capita beef consumption growing since 2015 and forecast to
100
continue, with imports to play an increasing role due to flat
95%
50
domestic beef production. Additionally, the Olympics in 32% 19%
Japan this year will bring in significant numbers of tourists 0
Australia US Canada NZ Mexico
and provide a boost to beef demand through foodservice Source: IHS - % reflects 2019 year-on-year growth
*2019 import volumes are for the year-ending-November
channels.
Australia is the top imported beef supplier to Japan, but is set to face stronger competition from the US in 2020 due to
improved access. The recently negotiated mini trade deal with Japan will bring tariff rates on US beef in line with the
Comprehensive and Progressive Agreement for Trans-Pacific Partnership and create a US-specific safeguard starting at
242,000 metric tonnes (increasing by 4,860 metric tonnes a year from years 3 through 9).
Industry projections 2020 – Australian cattle – February 6United States
Australian beef exports to the US reached 252,000 tonnes swt in 2019, up 9% year-on-year and representing 20% of
total shipments. Overall US consumer demand and foodservice traffic remained robust, with the economy humming
along and unemployment low.
Frozen manufacturing beef exports (152,000 tonnes swt) made up the lion's share of shipments to the US. Lean
Australian trim remains an integral component of the US burger complex but many grinders in the market had to match
higher bids from China to secure product. In contrast to Australia, US imports of frozen New Zealand beef, which enters
similar channels, declined 31% year-on-year from January to November of 2019 as product shifted to China. Despite
elevated cow slaughter in Australia in 2019, the US imported 90CL price indicator nudged past the 2014 record, briefly
peaking at 300US¢/lb in November due to strong competition from China.
Premium branded grassfed beef remains a key growth category in US retail and foodservice. Chilled Australian grassfed
beef primal shipments to the US grew 5% to 63,200 tonnes swt in 2019, accounting for a quarter of beef exports to the
market.
Consumer confidence in the US, which remains sensitive to the broader health of the economy, will drive overall
consumption levels in 2020. As seen following the Global Financial Crisis, a slowdown in beef demand could be
problematic given the record amount of production anticipated this year. However, imported Australian beef will remain
a critical feature of the market, given the US's ongoing requirement to blend frozen lean trim with local fattier product
and its limited ability to produce grassfed beef.
South Korea
Australian beef exports to Korea decreased 5% in 2020 to 162,000 tonnes swt. This was due to the increased
competition from US beef, the hitting of the tariff safeguard and product being drawn away into the Chinese market. The
US captured a further 2% of Korean imported beef market share in 2019, at 52%, while Australia's market share dipped
2% to 41%.
While the US will likely increase competitive pressure in the market, Koreans' preference for Australian beef is expected to
remain unchanged. Country of origin remains extremely important for Korean customers, with Australian beef the most
favoured among all imported beef and regarded as the most superior, among the safest to eat and a family favourite.
South-East Asia
Australian beef exports to South-East Asia eased 6% in 2019 to 122,000 tonnes swt, however, trends varied at a country
level. Indonesia was the top market and accounted for 47% of shipments to the region, followed by the Philippines at
21% and Vietnam at 11%.
Frozen grassfed beef remains the largest category shipped to South-East Asia (97,000 tonnes swt). However, sensitive
to price movements, frozen manufacturing shipments to Indonesia and the Philippines declined 14% and 33%
respectively, as China increased bids. Subsequently, cheaper Brazilian beef filled the gap in the Philippines while
increased Indian buffalo meat covered the shortfall in Indonesia. Vietnam remained the standout growth market in the
region in 2019, with exports increasing 29% year-on-year to 14,000 tonnes swt of predominantly frozen product.
The chilled beef trade into South-East Asia expanded 7% year-on-year in 2019, to 16,000 tonnes swt. This growth is
driven by demand from higher value channels such as modern retail, foodservice and hotels – segments that are more
sheltered from China buying power and geared to affluent consumers and tourist and business travel.
Competitors
Australia is facing greater competition in key exports Figure 14: Exports expanding in 2020
markets, the flow-on effect of major beef producing million tonnes swt 2019 2020
nations expanding production but also diverting more beef 2.0
16%
1.8
onto the global market. In particular, much of the
1.6
additional competition has been generated by the growing 1.4
presence of South American beef in Asian markets. Brazil, 1.2 6%
-16% 6%
Argentina and Uruguay have all dramatically grown their 1.0
market share in Asia, with a distinct focus upon China. 0.8
11%
0.6
0% 4%
Brazilian beef production is expected to continue growing 0.4 0%
9%
in coming years, underpinned by a slowly expanding herd, 0.2
the opening up of new land, greater availability of 0
Brazil Australia India US Argentina NZ Canada Uruguay Paraguay
slaughter cattle and strong international demand. Source: Markit, USDA, MLA (Australia)
% reflects 2019 year-on-year growth
Industry projections 2020 – Australian cattle – February 7Brazil exported 494,000 tonnes swt of beef to China in 2019, a 53% increase year-on-year, underpinned by a significant
increase in the number of plants approved to service the market. While Brazilian beef still lacks access to Japan, Korea
and the US, it is very price competitive in China and South East Asia and poses a significant competitive threat given its
large production capability to draw from and heavily depressed currency.
Argentina has become heavily geared towards China, doubling beef exports to the market last year. This staggering
volume (372,000 tonnes swt shipped over the year-to-November) equates to 75% of Argentina's total beef exports.
Argentina experienced elevated slaughter through 2019 in response to booming demand, However, with an undervalued
peso and economy in turmoil, much of the export growth was stripped from the domestic market. Beef production is
expected to expand 3% in 2020, incentivised by demand from China, however the Argentine beef industry remains
vulnerable to export controls being implemented by the recently elected Peronist government.
The US, with a substantial domestic feed grain supply, large herd and consolidated feedlot industry, is the world leader
in beef production and a major competitor to Australia in key export markets such as Japan, Korea and its own domestic
market. However, thanks to a strong dollar, US exports were back in 2019, down 5% year-on-year from January to
November, despite swelling domestic supplies.
The US cattle herd is currently near its cyclical peak and will likely contract over the coming years. However, driven by
higher levels of fed cattle and cow slaughter, US beef production is expected to expand further in 2020, leading to
increased volume available for export and greater competition in Japan and Korea. The notable gap in the US's export
portfolio is China, however the signing of US-China Phase-One trade agreement has left the US beef industry in a far
stronger position than where it was prior.
The US-China Phase-One deal removes many of the technical restrictions that were limiting trade from the US to China,
including loosening of the strict HGP-free requirements, recognition of US industry traceability systems and the removal
of the 30-month age limit on cattle supplying the trade. However, the trade deal has not wound back the existing 47%
tariff on US beef and restrictions on ractopamine remain in place. While there is potential for the US to establish a
significant trade within China over the coming years, it will likely be redirected from its other major markets (domestic,
Japan, Korea) where Australia is a major supplier and well-positioned to take advantage of any subsequent supply gaps.
Live exports
Australia shipped 1.3 million head of cattle in 2019, up 19% year-on-year. Feeder exports to Indonesia remained the
bedrock of the trade, increasing 15% to 676,000 head, but feeder and slaughter cattle to Vietnam recorded strong
growth, expanding 32% to 267,000 head.
Cattle exports are expected to contract in 2020 to 900,000 Figure 15: Live cattle exports
head due to a severely depleted northern herd. While million head Indonesia Vietnam China Other
1.4
dependent on seasonal conditions and speed of herd
1.2
recovery, cattle exports are anticipated to remain below one
1.0
million head over the next four years. As such, supply 0.8
conditions in 2020 should more reflect 2017, when Australia 0.6
exported 867,000 head, of which 513,000 head were 0.4
destined for Indonesia. 0.2
0
Demand for Australian cattle in South East Asia is expected f f f f
05 06 07 08 09 10 11 12 13 14 15 16 17 18 19 20 21 22 23
f
20 20 20 20 20 20 20 20 20 20 20 20 20 20 20 20 20 20 20
to remain robust despite increased competition from Indian
Source: ABS (pre-2015), DAWR, MLA forecasts
buffalo meat and Brazilian beef in Indonesia. In the first 11
months of 2019, Indonesia imported 81,000 tonnes swt of Indian buffalo meat, double the volume recorded over the
same period in 2017. Brazil was permitted 50,000 tonnes swt of frozen beef access to Indonesia in August and in
November sent its first shipment of 3,500 tonnes swt to the market (but then nothing in December).
However, this additional product entering Indonesia is yet to have a marked impact on Australian cattle exports and
prices, reflecting the current low volume of beef consumption and ability of the market to readily absorb any increase in
supply. While there is a more diverse array of suppliers servicing the Indonesian market, the pie is growing and an
expanding pool of affluent consumers are demanding better quality meat, facilitating a shift to greater tiering within the
beef offering.
Regional prices of cattle across Myanmar, Thailand, Laos, Cambodia and Vietnam continue to be driven by demand from
China. For Australian cattle, Vietnam remains the principle market in the region. After it expanded rapidly between
2013–2015, exports to Vietnam cooled from 2016–2018 but recovered in 2019. After the volatility of recent years, the
market has matured to more sustainable levels. While still dominated by slaughter cattle (85% of shipments in 2019)
feeder exports doubled last year, as importers looked to weight gain to boost margins.
The demand fundamentals supporting beef consumption in Australia's cattle markets remain strong. However, many
markets across South East Asia remain price-sensitive, which will continue to challenge the trade in light of the current
supply outlook and elevate the threat of increased competition from low-cost competitors.
Industry projections 2020 – Australian cattle – February 8Prices
In periods of prolonged dry, cattle prices have historically fallen away as conditions deteriorate. However, the store
market displayed an element of resilience in 2019 and robust global demand pushed finished prices higher.
The Eastern Young Cattle Indicator (EYCI) saw a minor decline of 5% on year-ago levels to average 487¢/kg cwt in 2019,
with small periods of volatility in the indicator largely influenced by weather events. Feeder buyers provided the main
support to the EYCI during the year, operating at an average premium of 55¢ to restockers and 45¢/kg cwt to
processors. With high finished prices relative to feeder cattle, lot feeders were competitive to ensure consistent feedlot
turn-off.
Heightened global protein demand saw finished cattle Figure 16: EYCI vs heavy steer
operate above all other categories and was a key factor in A¢/kg cwt EYCI Heavy steer
stabilising the store market. 800
700
Heavy steers averaged 534¢/kg cwt in 2019, trading at a
600
10% premium to EYCI cattle. However, over the past
decade, the inverse of that premium has been more 500
evident. The pressure of sustained drought on the store
400
market was more than offset by significant upside at the
finished end of the market. There is an expectation for 300
finished cattle to remain elevated in 2020, given the 200
2010 2011 2012 2013 2014 2015 2016 2017 2018 2019 2020
tightening pool of cattle available for slaughter and upside Source: MLA’s NLRS
in global meat prices, driven by China demand. However,
under the assumption of a return to average seasonal
conditions, store cattle will likely surpass their finished Figure 17: Medium cow vs US 90CL
counterparts, as producers look to restock paddocks, A¢/kg National medium cow US import price 90CL
1,000
suggesting the potential for significant price increases. 900
800
The national medium cow indicator improved 3% year-on-
700
year to 413¢/kg cwt, as demand for manufacturing beef saw 600
the US imported 90CL price surge to record levels on the 500
back of aggressive buying from China. Considering the 400
extent of breeder destocking, cow prices held up extremely 300
well. A significant improvement in conditions will see 200
producers look to commence rebuilding herds and demand 100
0
for productive cattle will increase, providing further price 2010 2011 2012 2013 2014 2015 2016 2017 2018 2019
support. Source: MLA’s NLRS, Steiner Consulting Group
Looking ahead, seasonal conditions will continue to have the largest influence on domestic cattle prices, however
international factors, including exchange rates, overseas production and demand from key export markets, will also
impact price. In recent weeks the impact of widespread rainfall has been reflected in sharp lifts across all livestock
categories. More will be required, however it appears that restocker optimism has started to turn.
Given the aforementioned influences, especially the assumed improved seasonal conditions, historically high (if not
record) cattle prices will likely be reached and maintained in the next few years.
Industry projections 2020 – Australian cattle – February 9Situation and outlook for the Australian cattle industry
% change % change
2015 2016 2017 2018 2019e 2020f 2020 f on 2019 2021 f 2022 f 2023 f 2023 f on 2020
Cattle numbers ('000 head)*
cattle 27,413 26,845 27,965 28,052 26,200 24,700 25,050 25,600 26,250 6%
percentage change -5.8% -2.1% 4.2% 0.3% -6.6% -5.8% 1.6% 2.2% 2.4%
Slaughterings ('000 head)
cattle 9,007 7,288 7,158 7,873 8,500 7,200 -15% 7,100 7,500 7,900 10%
calves 667 542 413 468 565 430 -24% 435 460 460 7%
total 9,675 7,830 7,571 8,341 9,065 7,630 -16% 7,535 7,960 8,360 10%
Average carcase weight (kg)
cattle 279.1 288.2 297.6 290.8 283.4 291.7 3% 299.4 300.4 300.7 3%
calves 55.6 53.9 45.7 41.3 43.0 45.0 5% 45.0 45.0 45.0
Production ('000 tonnes carcase weight)
beef 2,514 2,101 2,130 2,289 2,408 2,100 -13% 2,126 2,253 2,376 13%
veal 32.9 24.2 18.9 19.3 24.3 19.4 -20% 19.6 20.7 20.7 7%
total beef and veal 2,547 2,125 2,149 2,309 2,432 2,120 -13% 2,145 2,274 2,396 13%
Cattle exports ('000 head)
cattle 1,332 1,126 855 1,089 1,299 900 -31% 900 950 1,000 11%
Beef exports** ('000 tonnes)
total, carcase weight 1,888 1,497 1,493 1,655 1,801 1,511 -16% 1,533 1,653 1,769 17%
total, shipped weight 1,285 1,018 1,015 1,126 1,229 1,028 -16% 1,043 1,124 1,203 17%
Domestic utilisation ('000 tonnes carcase weight)***
total, carcase weight 646 614 643 639 619 592 -4% 596 605 611 3%
kg/head*** 27.1 25.2 26.0 25.6 24.4 23.0 -6% 22.8 22.8 22.7 -1%
Source: ABS, DAWR, MLA forecasts f = forecast
* From 2016 is an MLA estimate based on ABS Data - Figures as of 30th June e = estimate
** excl. canned/misc, shipped weight
*** Domestic meat consumption is measured by removing the portion of exports (DAWR data) from total production (ABS data) and assuming
the difference is consumed (or at least disappears) domestically. Imports are also added to domestic consumption when present. Per capita
consumption is calculated by dividing domestic consumption by ABS population data. Please note that domestic per capita consumption is
entirely a supply statistic and does not take account of waste or non-food uses of livestock meat products.
Australian beef producers were globally efficient and competitive
prior to latest severe drought: agri benchmark
Globally, the vast majority of beef cattle enterprises in most countries are achieving
profitability in both the cow-calf and finishing enterprises. This is the assessment of agri
benchmark, a productivity-focused global network, in its 2019 report.
Agri benchmark highlights the impact of China in lifting global demand and of the various
resource and environmental constraints constraining global beef supply. However, it also
notes the threat being posed by droughts in many countries (most notably
Australia) and by the recent growth in plant-based protein substitutes at retail
and foodservice.
The agri benchmark farm performance results indicate that Australian cattle
producers remain internationally competitive and efficient, with most achieving
medium-term profits in 2018, in the early stages of the latest severe drought.
However, on some efficiency parameters, such as weaning rates, there would
appear to be room for further improvement relative to key competitors.
The full 2019 agri benchmark report entitled How are global and Australian
beef producers performing ? can be found on the MLA website at:
www.mla.com.au/prices-markets/Trends-analysis/agribenchmark/
© Meat & Livestock Australia, 2020. ABN 39 081 678 364. MLA makes no representations as to the accuracy of any
information or advice contained in MLA’s Australian cattle industry projections 2020 and excludes all liability, whether in Click here for
contract, tort (including negligence or breach of statutory duty) or otherwise as a result of reliance by any person on such MLA’s Terms
information or advice. All use of MLA publications, reports and information is subject to MLA’s Market Report and of Use
Information Terms of Use. Please read our terms of use carefully and ensure you are familiar with its content.
Industry projections 2020 – Australian cattle – February 10You can also read