POPULATION SIZE AND REPRODUCTIVE PERFORMANCE OF PINNIPEDS ON THE SOUTH FARALLON ISLANDS, 2018-19 - REPORT TO THE U.S. FISH AND WILDLIFE SERVICE ...
←
→
Page content transcription
If your browser does not render page correctly, please read the page content below
POPULATION SIZE AND REPRODUCTIVE PERFORMANCE OF
 PINNIPEDS ON THE SOUTH FARALLON ISLANDS, 2018-19

    REPORT TO THE U.S. FISH AND WILDLIFE SERVICE
       FARALLON NATIONAL WILDLIFE REFUGE

                          August 2020
                     Garrett P. Duncan
                  California Current Group

              Point Blue Conservation Science
                  3820 Cypress Drive #11
                    Petaluma, CA, 94954

              © 2020 Point Blue Conservation Science
2019 Farallon Island Pinniped Report Duncan, G.P. 1
Population Size and Reproductive Performance of Pinnipeds
on the South Farallon Islands, 2018-2019
August 2020
Point Blue Conservation Science
Garrett P. Duncan
Acknowledgements
Data were collected by Farallon research winter assistants Leah Kerschner, Sophia Prisco, Marine
Quintin, Sarayu Ramnath, Jon Schneiderman, and assistants from the spring, summer and fall
seasons under the supervision of Point Blue Conservation Science staff biologists, Garrett Duncan,
Mike Johns, Jim Tietz, and Pete Warzybok. We are also very grateful for support provided by the
skippers of the Farallon Patrol, our colleagues at the mainland office, and personnel from the San
Francisco Bay National Wildlife Refuge. We are grateful for the continued financial and logistical
support provided by the U.S. Fish and Wildlife Service, our donors, and Point Blue colleagues on the
mainland. This is Point Blue contribution number 2329.
Suggested Citation
Duncan, G.P. 2019. Population size and reproductive performance of pinnipeds on the South
Farallon Islands, 2018-2019. Unpublished report to the US Fish and Wildlife Service. Point Blue
Conservation Science, Petaluma, California. Point Blue Contribution Number 2329.
Point Blue Conservation Science – Point Blue’s 140 staff and seasonal scientists conserve birds,
other wildlife and their ecosystems through scientific research and outreach. At the core of our
work is ecosystem science, studying birds and other indicators of nature’s health. Visit Point
Blue on the web www.pointblue.org.
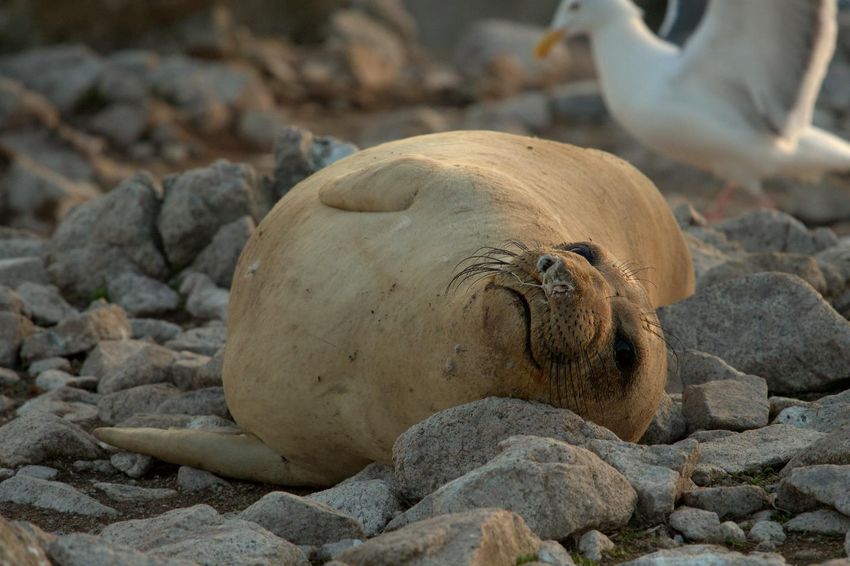
Cover photo credit/caption: “Yearling lounging in rocks” – 2018 Garrett Duncan.
TABLE OF CONTENTS
Population Size and Reproductive Performance of Pinnipeds on the South Farallon Islands,
2018-2019 ....................................................................................................................................... 1
Acknowledgements .................................................................................................................. 1
Suggested Citation ................................................................................................................... 1
TABLE OF CONTENTS ................................................................................................................... 1
LIMITED RIGHTS DISCLOSURE...................................................................................................... 3
EXECUTIVE SUMMARY ................................................................................................................. 4
INTRODUCTION ........................................................................................................................... 52019 Farallon Island Pinniped Report Duncan, G.P. 2
METHODS .................................................................................................................................... 5
Northern elephant seals........................................................................................................... 5
Northern fur seals .................................................................................................................... 5
Other pinnipeds........................................................................................................................ 6
RESULTS ....................................................................................................................................... 6
Northern elephant seals........................................................................................................... 6
Northern fur seals .................................................................................................................... 7
Harbor seals.............................................................................................................................. 8
California sea lions ................................................................................................................... 8
Steller sea lions......................................................................................................................... 8
DISCUSSION ................................................................................................................................. 8
Northern elephant seals........................................................................................................... 8
Northern fur seals .................................................................................................................. 10
Harbor seals............................................................................................................................ 11
California sea lions ................................................................................................................. 12
Steller sea lions....................................................................................................................... 12
RESEARCH AND MANAGEMENT RECOMMENDATIONS ............................................................ 13
LITERATURE CITED ..................................................................................................................... 15
TABLES ....................................................................................................................................... 20
FIGURES ..................................................................................................................................... 242019 Farallon Island Pinniped Report Duncan, G.P. 3 LIMITED RIGHTS DISCLOSURE All data contained in this 2018-19 Farallon Island Pinniped Report (“report”) is the copyright of Point Blue Conservation Science (formerly PRBO) and collected in coordination with the USFWS, Farallon National Wildlife Refuge under the terms of Cooperative Agreement #F19AC00242. The Government's rights to use, modify, reproduce, release, perform, display, or disclose the data set forth in this report are restricted by section 36(a) of OMB Circular A-110 “Uniform Administrative Requirements for Grants and Agreements With Institutions of Higher Education, Hospitals, and Other Non-Profit Organizations” as incorporated in the above identified contract. Any reproduction of data or portions thereof, in this report must also reproduce this Limited Rights Disclosure and all copyright markings. Requests to distribute, use, modify, reproduce, release, perform, display, or disclose data, or portions thereof, in this report beyond the scope of the government’s license, must be submitted to Point Blue Conservation Science at the referenced address. Any reference to or use of this report, or any portion thereof, within the scope of the government’s license, shall include the following citation: Duncan, G.P. 2019. Population size and reproductive performance of pinnipeds on the South Farallon Islands, 2018-2019. Unpublished report to the US Fish and Wildlife Service. Point Blue Conservation Science, Petaluma, California. Point Blue Contribution Number 2329. Outside the scope of the government’s license, this report shall not be used without written permission from the director of the California Current Group at marinedirector@pointblue.org or Point Blue Conservation Science, 3820 Cypress Drive #11, Petaluma, CA, 94954.
2019 Farallon Island Pinniped Report                                          Duncan, G.P.      4

EXECUTIVE SUMMARY
(1) Under cooperative agreement with USFWS/Farallon Islands NWR, Point Blue (formerly
    PRBO) monitors the population size and reproductive success of pinnipeds on Southeast
    Farallon Island and West End Island, California and has done so since 1970.

(2) During the December 2018 – March 2019 winter season the Northern elephant seal
    breeding population decreased by 36 adult females compared to the previous season (126
    in 2018; 107 in 2017) and was on the low end of the range for the past decade (range: 84-
    126). Pup production significantly decreased this year compared to last season (71 in 2018;
    104 in 2016) and is the lowest since 2014 (67).

(3) While overall production declined, pup survival (weaned pups/pups) increased this year
    (75%) compared to last season (55%) and is the highest record since 2014 (85%). This is also
    slightly higher than the long-term mean value of 74% ± 10 SD. Reproductive success
    (weaned pups/cows) also increased this season (59%) compared to last year (45%) but is
    still below the long-term mean value of 67% ± 11 SD.

(4) Overall attendance to the colony this year was lower, consistent with the trends over the
    last 25 years. The breeding success was the highest value it has been in 5 years but is still
    below the long term average. Pup survival on the other hand was higher than the long term
    average. The data shows that there are more cows coming onto the island that are not
    producing pups, which reduces the overall reproductive success.

(5) The 2018 pinniped breeding populations for the other 4 species decreased slightly, with
    maximum pup counts of 579 for Northern fur seals, 4 for Harbor seals, 505 for California sea
    lions and 44 for Steller sea lions. This year’s breeding period resulted in the highest max pup
    counts for fur seals for the entire time series, nearly the highest count for Steller sea lions
    since 1997, and slightly below last year’s record breaking count of California sea lions.

(6) The health of marine mammals reflects the health of the ecosystems upon which they
    depend. Changes in reproductive success, individual survival, and breeding propensity may
    demonstrate shifts in prey abundance and food web structure among other marine related
    alterations. As such, pinnipeds of the Farallon Islands provide insight into environmental
    health and may act as sentinel species. We recommend continued efforts in monitoring the
    island’s pinniped populations with suggestions on avenues of new research and analyses.
2019 Farallon Island Pinniped Report Duncan, G.P. 5 INTRODUCTION This report contains information on the reproductive performance and population size of pinnipeds (seals and sea lions) on the South Farallon Islands (SFI) which is comprised of Southeast Farallon Island (SEFI) and West End Island (WEI), California. Data presented here is for 2018 for all pinnipeds except Northern elephant seals which includes the winter season of 2018-2019 (Dec 2018 – Mar 2019). We monitored five species: Northern elephant seals (Mirounga angustirostris; NES), Northern fur seals (Callorhinus ursinus; NFS), Harbor seals (Phoca vitulina; HS), California sea lions (Zalophus californianus; CSL) and Steller sea lions (Eumetopias jubatus; SSL). METHODS Research was conducted on the 120 acre SFI which resides 30 miles west of San Francisco, CA. The islands are managed by the U.S. Fish and Wildlife Service (FWS) as the Farallon Islands National Wildlife Refuge (FINWR). The waters surrounding the FINWR lie within the Gulf of the Farallones which is a National Marine Sanctuary managed by the National Oceanic and Atmospheric Administration (NOAA). Since 1968 biologists from Point Blue Conservation Science have been collecting data on the wildlife that inhabit the islands. Research on the breeding NES population began in 1972 and weekly pinniped census from the lighthouse have been conducted since 1970. Northern elephant seals Our studies focus on three breeding areas on SEFI, Sand Flat (SF), Marine Terrace Sand Flat (MTSF) and Mirounga Beach (MB) (Figure 1). We spent at least 4 hours each day resighting tagged seals, assessing reproductive status, and surveying cows and live, dead, and weaned pups on SEFI from 8 December 2016 to 18 March 2018. Seals were also monitored on WEI at Indian Head Beach (IHB)/Pastel Cave Highlands (PCH) and Shell Beach (SB) (Figure 1). WEI was visited once a month during the elephant seal breeding season on 22 December, 26 January, 19 February and 11 March. We also conducted NES population surveys from the lighthouse and other accessible vantage points on Thursday and Sunday of each week throughout the season. Individual animals observed during these surveys were classified by age (cow, pup, weaner, immature, subadult [sa1, sa2, sa3, sa4] or bull) and sex class (male, female or unknown). As part of the cooperative agreement with USFWS, data presented on NES will include the following information on the breeding population: numbers of breeding males (Sub-adults - Bull), cows, pups, weaned pups, pup production (#pups/#cows), reproductive success (#weaned pups/#cows), pup survival (#weaned pups/#pups) and how this season’s results relate to last season and the long term data. Northern fur seals Land-based Surveys – We conducted a weekly pinniped census from Lighthouse Hill on SEFI throughout the peak fur seal pupping season (June through September). Because of the long viewing distance, it is too difficult to age and sex most of the NFSs. Typically, only AM and pups can be aged and sexed confidently. Most other animals were categorized simply as Non-ID. It is also important to note that counts conducted from the lighthouse do not allow for full view of the main NFS breeding colony located at IHB on WEI. To further compare counts, Point Blue
2019 Farallon Island Pinniped Report                                         Duncan, G.P.     6

biologists made one trip on September 14 to WEI (Figure 1) to count pinnipeds and improve our
understanding of their demographics. Because of the closer viewing distance, a higher
proportion of NFSs can be identified to age/sex class than from surveys conducted from the
lighthouse.

Other pinnipeds
Land-based Surveys – In addition to regular surveys for NES and NFS, HS, CSL and SSL were
counted at haul out and breeding sites from vantage points located at Lighthouse Hill and Corm
Blind Hill during the weekly pinniped census. This survey is conducted every Thursday excluding
the month of April, generally between 1000 and 1400. If fog precluded Lighthouse surveys on
Thursdays, they were attempted on Friday or Saturday. During census the species, age (if
distinguishable), sex (if distinguishable), location of haul out area and number of individuals
were noted. This report summarizes the weekly lighthouse census data of each species from
2009 to 2018 including total numbers and those of adult males (AM), sub-adult males (SAM),
adult females (AF), immatures (Imm), Non-ID (NI) and pups during the breeding season (June-
July) on SFI. Average numbers (±SD) along with maximum counts are included in the results
from 1970-2018. Some results may be coarse for this section and may not provide the detail of
max numbers by age/sex class. However, in most cases total max numbers presented during
the breeding season should only include those of AM, SAM, AF, Imm and pups.

RESULTS

Northern elephant seals
During the 2019 breeding season (December 2018 to March 2019) there were 90 cows on SEFI
and WEI; 36 less than the 126 seen in 2018. This number was well below the 45 year average of
188 ± 96 (average ± SD for all averages). Of those 90 cows, 78% of them produced pups. Of the
71 pups born, 54 of those were born on SEFI and 17 on WEI. Overall pup production was down
significantly this year compared to the last few years (104 in 2018 and 99 in 2017; Figure 2) due
largely to the reduction in the number of pregnant cows arriving at the SFI.

Pup survival (PS) for all of the SFI was 75% compared to last year’s 55% and the long term
average of 74% ± 10. On SEFI, PS this year was 70% compared to 58% in 2018 and the average
of 71% ±10. This year’s PS on WEI was 88% which was 44% greater than during 2018 and also
well above the long term mean of 76% ± 20 average. Pup survival has fluctuated significantly
over the past decade (Figure 4), with 5 years of +75% pup survival followed by 4 years of less
than 65%. This year was closest to the long term average (74%) since 2009. Similarly,
reproductive success (RS: defined as the ratio of weaned pups per cow) increased slightly on SFI
with 59% compared to last year’s 45% and the long term average of 67% (± 10%). On SEFI RS
was 61%, up 10% from last year (51%) but below the average of 65% (± 10%). This year’s RS
(54%) on WEI increased compared to 2018 (32%) but again was below the long-term average of
65% (± 24%).

Due to low data precision (intermittent trips to WEI) and difficulty observing the WEI colony
remotely, we only present the standardized PS collected on SEFI. Standardizing PS [annual PS -
2019 Farallon Island Pinniped Report                                           Duncan, G.P.      7

44yr average PS] for more accurate comparisons across the years indicates that survival has
fluctuated greatly over the last decade. The survival values from 2009-2014 are well above
average, whereas the values from 2015-2018 are well below average, and this year’s value is
just below the long term average. (Figure 4) This year’s RS value was below the long term
average but well above the values of the previous 4 years. (Figure 5)

The first cow arrived at SEFI on 15 Dec 2018, which is 10 days earlier than last season, but still
slightly later than the long term average first arrival date of 12 Dec (SD = 8 days). Median arrival
date this season was 18 Jan (SD = 12 days) (Figure 6). The first pup was born on 22 Dec 2018
while the last to pup was born on 18 Feb 2019, a 58 day difference. Last season the first pup
arrived on 29 Dec 2017 while the last pup arrived on 12 Feb 2018, a 44 day difference. Median
pupping date in 2019 on SEFI was 22 Jan (SD = 12 days) compared to the long term median
pupping date of 19 Jan (SD = 2 days) (Figure 7). Mean nursing duration of weaned pups this
year was 29 days (SD = 2 days) with a range of 25-35 days. The long term average for nursing
duration is 28 days (SD = 1 day). The sex ratio of the 53 pups born on SEFI was 22 males, 16
females and 15 of unknown sex (all of these unsexed either died in the middle of the colony or
were washed out to sea). The last cow departed on 21 Mar 2019. Median cow departure date
was 19 Feb 2019 (SD = 12 days) compared to the long term median departure date of 15 Feb
(SD = 21 days). A summary of the total number of animals by age and sex class per census
throughout the 2018-2019 breeding season is presented in Figure 8.

Northern fur seals
The first pup detection in 2018 was in mid-June. Peak pup numbers occurred between late-July
and mid-August in all years and declined sharply thereafter until nearly no pups were detected
in late October. The average number of NFS in 2018 was 428 (± 347) compared to the 10 year
average of 145 (± 208). Table 2 provides the details of the age/sex class distribution for NFS
counted from the lighthouse surveys conducted during the peak pup numbers in July and
August of 2015-2018. A single WEI gound-based census was performed in the fall of 2018 on
September 14th. On this trip, 611 pups and a total count of 1753 individuals was recorded. NFS
counts from WEI ground-based surveys 2016-2018 are presented in Table 3.

Fur seal breeding phenology appears to have differed this year in comparison to previous years.
The number of adult males peaked very early this year, in mid-June versus mid-July last year.
The numbers then settled to around 50 individuals until beginning to decline in late July and
early August. In contrast, the maximum total animal count (all age classes) from the lighthouse
of 1092 individuals occurred after the breeding season, on September 27th.

Over the last five years we have consistently documented max pup counts occurring during the
month of August except for in 2015 (Table 6). This year the highest average counts were
recorded in September (Figure 9). From a historical perspective, the max counts of NFS on SFI
has shown an exponential increase since the first pup was born in 1996. This is the first year
since 2008 that the max count was lower than the prior year, 1,092 versus 1,185 in 2017.
Regardless, our current numbers far exceed the 120 (± 257) long term mean of maximum
counts per year (Figure 10).
2019 Farallon Island Pinniped Report                                        Duncan, G.P.     8

Harbor seals
The HS population on SEFI peaked in January of 2018 with a maximum count of 125 adults.
However there was a high count of only 87 adults documented during the peak breeding period
in June. The max count of 125 is the lowest number of animals counted since 2008. The average
number of HS observed during surveys in 2018 was 40 (± 34) compared to the 10 year average
of 60 (± 41). As shown in Figure 10, the max count of 125 individuals this season is lower than
the previous 9 years. There were a maximum of 4 pups observed during June and 2-4 pups
were consistently counted in the months of May - August (Table 6). This compares to a
maximum pup count of 3 in 2017and is consistent, although on the lower end, with the
variability (range 3-12 pups) of detection over the past decade (Table 4).

California sea lions
The CSL population on SEFI peaked early September 2018 with a maximum count of 133 AMs,
5,808 Non-IDs and 370 pups. The maximum pup count was 505 in mid-September (Table 5)
which was 4 less than the max seen in October of last year. The max total count of 6,311 ranks
seventh highest in the last 10 years, and the maximum count of pups of 505 fell just short of
last year’s high count over the last decade (Table 4). Prior to this and last year we have
consistently documented max pup counts occurring during the month of June and July, but
there appears to be a new trend where high pup counts persist into September and October
(Table 7). The average number of CSL in 2016 was 2,765 (± 1,155) compared to the 10 year
average of 3,082 (± 1,542). According to Figure 10 this year’s max count of CSL is ~500
individuals lower than the trend of our time series.

Steller sea lions
The SSL population on SEFI peaked in late June of 2018 with a maximum count of 233 animals.
The peak numbers of each age/sex class during the July breeding counts were 13 AMs, 6 SAMs,
86 AFs, 0 Imms, 44 pups and 106 Non-IDs. The maximum pup count during the breeding season
was 44 at the end of July (Table 5). The max total count of 233 rank as the 6th highest count
(Figure 10) and max pup count of 44 rank as the second highest count in the last decade (Figure
11). For the last five years we have consistently documented max pup counts occurring during
the months of June and July (Table 6) which coincides with the peak number of AFs present on
the island. The average number of SSL in 2018 was 92 (± 55) compared to the 10 year average
of 68 (± 37). According to Figure 10 this year’s max count of 233 SSLs is well below the highest
records in our time series but is the second highest since 2003.

DISCUSSION

Northern elephant seals
Northern elephant seals recolonized the SFI in 1972 (LeBoeuf et al. 1974). From 1973-1983 the
number of pups born increased at an average rate of 56% per annum (Sydeman and Allen
1999). The Farallon pup population declined from 1984 to 2018 at an overall rate of 2.0% per
annum. Over the last decade (2010-2019) the rate has seen a 4.5% decline per annum. The
2019 Farallon Island Pinniped Report                                          Duncan, G.P.      9

decrease has been mostly attributed to the reduction in pup production on SEFI (5.1% drop
over the last decade) while production on WEI has dropped less severely at 1.7%.

In 2019 on SEFI, there was a 29.9% decrease in pup production compared to the 2018 season
(54 pups from 62 cows in 2019 and 77 pups from 88 cows in 2017). There continues to be
variation in median cow arrival and pupping dates. The last decade has seen one of the earliest
cow median arrival dates but this year is the second season in a row being late when compared
to the long term average. Similarly, the last decade has had some of the earliest median
pupping dates but this is the fourth season being later than the long-term average on SEFI.

The 2019 elephant seal breeding season could be characterized as negative in terms of
population size, pup survival and reproductive success when comparing to the past decade. For
example, the pup survival rate (70%) during the 2019 season is the highest in the last 5 years,
but still remains below the long term average. The NES breeding population on SFI decreased
by 36 cows this season compared to last year and is well below the average over the past
decade. It is likely that the fewer pups being born on the islands over the past decade is a result
of continued emigration by cows to other colonies.

The number of cows utilizing WEI this season was similar when compared to recent past
seasons but long-term data indicates continued decrease from peak counts in the 1980s and
90s. WEI comprises two areas where elephant seals breed, Shell Beach (SB) and Indian Head
Beach (IHB). In the 1980s, Shell Beach was the major breeding area on both islands, being a
large, relatively flat area, accommodating as many as 250 breeding cows. In one year, from the
strong 1997-1998 El Niño to the 1999 breeding season, the SB colony declined 64% from 188 to
67 cows. Elevated mortality due to the El Niño, and the disappearance of the small beach which
was the main access route are likely responsible for the dramatic decline in the WEI numbers
over the years. Cows first started breeding at SB in 1975, peaked at 270 cows in 1995 and only a
single cow bred there this season. Sandy haul out sites and beach access routes in other areas
of both SEFI and WEI have seen similar erosion effects and combined with the proximity of the
expanding Point Reyes elephant seal colony could help explain why there is a decreasing
number of cows breeding at the Farallones.

For the second season in a row pup production was once again lower when compared to the
previous year. In fact, pup production on SEFI this year was the lowest recorded since 1975.
This was largely driven by the lowest attendance observed at the Mirounga Beach colony since
1997. However, despite lower breeding numbers, there was relatively high pup survival and
reproductive success when comparing the past few seasons. SEFI survival rate this year was
70% compared to 2018’s 58%, 2017’s 60% and 2015’s 63% (long-term average: 71% ± 10).

The causes for pup mortality this breeding season include 2 pups washed out to sea, 5 pups
crushed to death, 1 pup stillborn and 1 pup died as a weaner.
2019 Farallon Island Pinniped Report                                          Duncan, G.P.      10

Northern fur seals
The NFS is a pelagic-feeding, polygynous otariid that currently ranges across the North Pacific
Ocean and Bering Sea (Kajimura 1984; Ream et al. 2005) as far south as 34°N latitude (Kenyon
and Wilke 1953). Approximately 70% of the current world population breeds on the Pribilof
Islands (~750,000 animals; Testa 2007), but recent declines at the Pribilofs, where pup
production has fallen by ~50% over the past 3 decades, have elevated concern for this species
(Towell et al. 2006). Fur seals likely numbered at least in the tens of thousands at the SFI before
being locally extirpated by American, British, and Russian sealers during the early 19 th century
(Starks 1922; Townsend 1931; Scheffer and Kraus 1964). Since the 1960s, other rookeries have
been re-colonized at San Miguel Island, California, and colonized at Bogoslof Island in the
eastern Aleutians, Alaska (York et al. 2005). The first confirmed pup born on SFI since
extirpation was in 1996 (Pyle et al. 2001), and the colony has grown rapidly over the last 20
years (Lee et al. 2018).

Ground based survey efforts and standardized weekly pinniped censuses from the top of
Lighthouse Hill at SFI over the past 15 years have revealed an exponentially increasing
population fueled largely by immigration from San Miguel Island (Lee et al. 2018). Prior to 2013,
the recent peak count numbered 521 individuals in 2012 (Tietz 2013). However, while these
surveys have been effective in assessing overall population growth and resighting tags of
immigrant animals, they have limitations. Location of the current fur seal colony on WEI
precludes extensive ground-based examination of the colony at peak breeding, due to
disturbance concerns with breeding seabirds. Lighthouse based censuses cannot see a large
portion of the fur seal colony area. Therefore, between 2013 and 2016 we conducted annual
aerial assessments of the fur seal colony at SFI to produce more accurate estimates of peak
adult abundance and pup production – metrics of great interest to managers at National
Marine Fisheries Service (NMFS) and the FINWR.

Comparisons of counts obtained from aerial and land-based techniques in 2013 - 2016 indicate
that aerial photographs provided a more complete survey of the Farallon NFS colony. For four
seasons in a row aerial photographic surveys resulted in the highest number of pups (401 in
2013, 656 in 2014, 665 in 2015, and 1,126 in 2016) recorded on SFI since the islands were
recolonized in 1996 and was considerably greater than the peak pup counts obtained from
Lighthouse and WEI ground surveys. The total aerial count was also substantially greater than
the peak total counts from the lighthouse but was similar to the peak counts obtained from WEI
ground counts. Lighthouse surveys was the primary count method performed this year, with
exception of one trip to WEI in September to try to capture near-peak numbers. For the first
time since 2007, the maximum number of NFS counted from the lighthouse was lower than the
previous year (1092 individuals versus 1185 last year). The number of pups during lighthouse
counts continued to increase and was the highest since recolonization (579 pups). During the
trip to WEI on September 14th, 1753 individuals were counted including 22 adult males, 109
sub-adult males, 310 adult females, 45 immatures, 611 pups, and 656 non-ID fur seals. It should
be noted that on most visits to WEI for ground counts (as well as LH census) there were many
NFS swimming in the waters between Sewer Gulch and Indian Head Beach and these numbers
were estimated (400) and included in the non-ID category, and the totals.
2019 Farallon Island Pinniped Report                                           Duncan, G.P.       11

Further aerial surveys (preferably using drones) and documentation of the SFI NFS population
should be reinitiated in order to produce more accurate counts and provide recommendations
for managing this rapidly expanding, distinct sub-population.

Harbor seals
Harbor seals are a coastal species that hauls out regularly in modestly tight social groups along
coastlines throughout much of the north temperate region in both the Pacific and Atlantic
Oceans (Riedman 1990, Godsell 1988). General haul out patterns include seasonal, circadian
and tidal rhythms in the number of animals ashore as well as marked preferences being
displayed for warm, dry weather (Cronin et al. 2009, Thompson et al. 1989). Furthermore, HS
generally exhibit strong fidelity to haul-out locations (Bjorge et al. 1995, Sharples et al. 2012). A
complete count of all harbor seals in California is impossible because some are always away
from the haul out sites and a complete pup count is also not possible because of their precocial
nature. Population size is estimated by counting the number of seals ashore during the peak
haul-out period (May to July) and by multiplying this count by a correction factor equal to the
inverse of the estimated fraction of seals on land. Harvey and Goley (2011) calculated a
correction factor of 1.54 based on 180 seals radio-tagged in California. Based on the most
recent harbor seal counts (20,109 in May-July 2012; NMFS unpublished data) and the Harvey
and Goley (2011) correction factor, the harbor seal population in California is estimated to
number 30,968 seals. (NMFS California HS Stock Assessment 2014) The maximum statewide
count in the 1981-2009 time series occurred in 2004 and the population had been on a sharp
decline in 2009 and 2012 after surveys were conducted. Unfortunately, no report is available on
current data. The most recent report states that the population appears to be stabilizing at
what may be its carrying capacity and mortality due to fisheries is declining. There are no
known habitat issues that are of particular concern for this species.

The max counts of HS on SFI appears to have steadily increased until 1993 where it has since
leveled off and is now well above the 101 (± 57) long term mean of maximum counts per year.
Since pinniped surveys began on SFI in 1970, the first HS pup was not documented until 1991
and max pup numbers have shown a gradual increase to current numbers (Figure 11). The
island habitat on SFI is not thought to be ideal for pregnant females to pup during the breeding
season and there has been little documentation of pupping at the island. With that said HS
pups are highly precocial and enter in to the water shortly after being born which may
contribute to the low detection at the island. Also many of the haul-out sites on SFI (i.e. Mussel
Flat) are very tide dependent and survey counts vary considerably based on tide (lower
numbers if survey time coincides with high tide and higher numbers at low tide). Surveys are
conducted in the standardized time window, independent of tide height. It is thought that SFI
are an important haul out and resting site for the sub-species of HS in California and we plan to
continue monitoring these pinnipeds through our weekly census. The maximum count of 125
HS on SFI in 2018 represents a small portion of the overall population estimates for California.
However, no research has been conducted on the number of unique individuals that utilize the
islands throughout the year.
2019 Farallon Island Pinniped Report                                        Duncan, G.P.     12

California sea lions
According to the CSL stock assessment compiled by NMFS and updated in 2014, the estimated
total population size is 296,750 with a minimum U.S. stock at 153,337 (NMFS unpubl. data
2014). The 2014 assessment includes all CSL counted during the July 2011 census at the
Channel Islands in southern California and at haul out sites located between Point Conception
and Point Reyes, California. Trends in pup counts from 1975 through 2008 are from four
rookeries in southern California and for haul outs in central and northern California. Studies
indicate that some characteristics representative of El Niño years result in higher pup and
juvenile mortality rates (DeLong et al. 1991, NMFS unpublished data) which affect future
recruitment into the adult population for the affected cohorts.

Since 1970, the max counts of CSL on SFI appear to fluctuate from year to year but overall
steadily increase. This season’s max count of 6,311 individuals was significantly lower than
historic high counts (10,529 in 2006 and 11,336 in 2008) but still considerably greater than the
4,338 (± 2,705) long term mean of maximum counts per year. CSL pups were first documented
on SFI in 1983 and since then max pup numbers have shown low numbers until two small peaks
in 1998 and 2000 followed by a sharp increase in pup production from 2009 to 2017. This year
the pup production was 5 individuals fewer than last year. Regardless, it appears that the
islands are becoming more of a breeding ground perhaps as a result of an expanding
population. The maximum count of 6,311 CSL on SFI in 2018 represents a small portion of the
overall population estimates for California, however we will continue to document CSL
presence on the island through our weekly pinniped census.

Steller sea lions
Since the pinniped surveys began in 1970, the max count of SSLs on SFI appears to show much
variability among years with a peak in the late 1990’s and early 2000’s. This season’s max count
of 233 were notably higher than the 182 (± 58) long term mean of maximum counts per year.
Based on surveys since 1970, SSL pups were first documented in 1973 and since then max pup
numbers steadily increased through the late 1970’s, plateaued through the 1980’s and ‘90’s,
dipped through the early 2000’s and has generally been on the rise over the decade. However,
as mentioned earlier the total and max pup numbers are well below those seen prior to the
surveys conducted by Point Blue starting in 1970. The 44 pups documented at the height of the
breeding season is the second highest counts in the last 20 years (range 8-45 from 1998-2018).

Two of the most southerly haul out and breeding areas for SSL are located on Año Nuevo Island
(ANI) and the SFI, where SSL breed in small numbers and haul-out in slightly larger numbers
throughout the year. Historically, SFI contained a much larger SSL colony than today that was
considered one of the largest in California. Counts conducted between 1927 and 1947 averaged
between 600 and 790 animals (Bonnot et al. 1938, Bonnot and Ripley 1948). A previous
assessment of the Farallon colony showed declines from the mid-1970s to 1996 in total
numbers of animals (all seasons combined, -0.4%), numbers of adult females during the
breeding season (-5.9%), pup production, and adult female to adult male ratio (Hastings and
Sydeman 2002). Reproductive rates of adult females were extremely low during this period,
2019 Farallon Island Pinniped Report                                         Duncan, G.P.     13

averaging 10.7% (range 2.0 to 21.2%). Reproduction also suffered from a high incidence of
premature, stillborn births.

Exact causes of the decline of the Farallon colony are uncertain. Contaminant studies in the
early 1990s revealed elevated levels of organochlorines and trace metals such as mercury and
copper that may have impacted reproduction (Jarman et al. 1996, Sydeman and Jarman 1998).
Disease, declines in prey availability, and competition with increasing numbers of other
pinnipeds (e.g., Northern fur seals and California sea lions) also may have contributed to
declines and lack of recovery of this colony (Sydeman and Allen 1999, Hastings and Sydeman
2002). A similar scenario has occurred to the populations in southern California. Moreover,
Pitcher et al. (2007) has documented a northward shift in the overall breeding distribution, with
a contraction of the range in southern California and new rookeries established in southeastern
Alaska. As SEFI is one of two breeding colonies at the southern end of the SSL range we will
continue to monitor the population year round in order to document variation among years.

RESEARCH AND MANAGEMENT RECOMMENDATIONS

In a general sense, the health of marine mammals reflects the health of the ecosystems upon
which they depend. Changes in reproductive success, individual survival, and breeding
propensity may demonstrate shifts in prey abundance and food web structure among other
marine related alterations. As such, pinnipeds of SFI provide insight into environmental health
and may act as sentinel species. A declining population or a reduction in reproductive success
may indicate a threat to other wildlife or people. By examining our long term pinniped datasets
we hope to explore the variability of ecosystem productivity and health and how it relates to
changing climatic variables. To fully understand this it seems essential to incorporate the
biology and ecology of pinnipeds and other marine top predators in multidisciplinary programs
of research.

As the frequency of El Niño and other warm-water oceanographic events has increased in
recent times (Johnson 2014; Cai et al. 2013), population-level effects may be more pronounced
in the future. These broad-scale events may disrupt or prevent upwelling, which in turn effects
the development of the food web. As such, marine mammals generally demonstrate reductions
in population size, productivity, and/or survival during years of poor oceanic productivity. By
continuing to census the pinniped populations on SFI combined with other oceanic data that
Point Blue collects our efforts may be helpful in mitigating these threats and ultimately aid in
the sustainability of these species. In addition to the continuation of current research efforts,
we recommend the following actions for enhancing the protection, conservation and
management of pinnipeds on SEFI:

1. To examine the growth rate of the SFI NFS colony in comparison to other recolonization
sites (SMI and BI). Continued efforts should be made to conduct aerial surveys of the NFS
colony as results have shown that this method provides the most accurate counts of pup
production and overall breeding population. With the difficulty of flying aerial surveys because
2019 Farallon Island Pinniped Report                                         Duncan, G.P.      14

of weather and the associated cost we recommend the continued pursuit of using quad-copters
(unmanned aerial vehicles – UAV) with built in GPS and video/photo capabilities to fly aerial
surveys in a timely manner. Point Blue already has the equipment and trained pilots available to
conduct these surveys and has experience conducting surveys with UAVs over seabird and
pinniped colonies in Antarctica and California. It is recommended that these surveys are
implemented as soon as Federal regulations and the USFWS allow for the use of UAVs on the
National Wildlife Refuge.

2. Analysis of NES data in relation to population decline as a result of continued habitat
degradation due to increased frequency and intensity of storms. Analysis would yield
population demographic parameters including estimates of age specific survival, breeding
propensity, and reproductive success as well as temporal variation in these parameters due to
ocean climate fluctuations (e.g. El Niño and other climate indices), population density, and
predation pressure.

3. To further our understanding of the foraging ecology of SEFI pinnipeds (particularly CSL), we
recommend continuation of novel monitoring techniques in collaboration with other
researchers (Dan Crocker at SSU) including deployment of GPS tags (combined with analysis of
brand resight data) and measurements of physiological state (e.g. body condition scoring, fecal
analysis for diet composition). Novel monitoring tools will greatly enhance our ability to
understand Farallon population trends (e.g. how food availability is affecting CSLs) in support of
management decisions for FWS and NMFS. Novel technology will also allow us to examine
marine habitat use and foraging behavior, which is critical to the evaluation of current and
potential new marine protected areas around the Farallon NWR. Information on pinniped
foraging ecology would complement our on-going dataset on seabird foraging ecology and
would provide an area of comparison between species and other areas where this data is being
collected.

4. To understand the rate at which marine debris and in particular entanglement is impacting
wildlife on the FINWR we recommend examination of the islands historic entanglement data. It
has been over 10 years since this data has been analyzed and by updating and comparing the
data we may gain more insight into the rate of increase or decrease in detection at the islands.
In the winter of 2014 we created a more robust protocol for collecting entanglement data
which will aid in fine tuning our understanding of these events (see 2014 NES report).
2019 Farallon Island Pinniped Report                                           Duncan, G.P.        15

LITERATURE CITED
NORTHERN ELEPHANT SEALS
Carretta, J.V., E. Oleson, D.W. Weller, A.R. Lang, K.A. Forney, J. Baker, M.M. Muto, B. Hanson,
       A.J. Orr, H. Huber, M.S. Lowry, J. Barlow, J.E. Moore, D. Lynch, L. Carswell, R.L. Brownell,
       Jr. 2014. U.S. Pacific Marine Mammal Stock Assessments, 2014. U.S. Dep. Commerce,
       NOAA Technical Memorandum NMFS-SWFSC-549. 414 p. [doi:10.7289/V5/TM-SWFSC-
       549]

Clinton, W. L. and Le Boeuf, B. J. 1993. Sexual selection’s effects on male life history and the
       pattern of male mortality. Ecology, 74: 1884–1892.

Clutton-Brock, T.H. 1988. Reproductive Success : Studies of Individual Variation in Contrasting
       Breeding Systems. University Of Chicago Press.

Condit, R., B. J. Le Boeuf, P. A. Morris, and M. Sylvan. 2007. Estimating population size in
       asynchronous aggregations: a Bayesian approach and test with elephant seal censuses.
       Marine Mammal Science 23:834.

Condit, R., J. Reiter, A. Betcher, R.W. Berger, P.A. Morris and B.J. LeBoeuf. 2013. Lifetime
       survival rates and senescence in Northern Elephant Seals. Marine Mammal Science.

Condit, R., M.S. Lowry, A. Betcher, S.G. Allen, D. Adams, B. Hatfield, D.E. Lee, D.A. Aurioles, M.C.
       Garcia-Aguilar, P.A. Morris, and B.J. LeBoeuf. In preparation. Population status of the
       Northern Elephant Seal. Marine Mammal Science.

Hindell, M. A. and G. J. Little. 1988. Longevity, fertility and philopatry of two female southern
       elephant seals (Mirounga Leonina) at Macquarie Island. Marine Mammal Science 4: 168-
       171.
Huber, H. R. 1987. Natality and weaning success in realation to age of 1st reproduction in
       northern elephant seals. Canadian Journal of Zoology 65: 1311-1316.

LeBoeuf, B.J. 1974. Male-male competition and reproductive success in elephant seals.
      American Zoology 14:163-176.

LeBoeuf, B.J., D.G. Ainley, and T.J. Lewis. 1972. Perinatal behavior of northern elephant seal
      females and their young. Behaviour 34:121-156.

LeBoeuf, B.J., D.G. Ainley, and T.J. Lewis. 1974. Elephant seals at the Farallones: population
      structure of an incipient breeding colony. Journal of Mammalogy 55:370-385.

LeBoeuf, B.J. and D.E. Crocker. 2005. Ocean climate and seal condition. BMC Biology 3:9
      doi:10.1186/1741-7007-3-9
2019 Farallon Island Pinniped Report Duncan, G.P. 16
LeBoeuf, B.J. and Reiter. 1988. Lifetime Reproductive Success in Northern Elephant Seals.
P.344-362 in Reproductive Success: Studies of Individual Variation in Contrasting
Breeding Systems. University of Chicago Press.
Le Boeuf, B. J., Crocker, D. E., Costa, D. P., Blackwell, S. B., Webb, P. M. and Houser, D. S. 2000.
Foraging ecology of northern elephant seals. Ecological Monographs 70: 353-382.
Lee, D. E., Berger, R. W., Tietz, J. R., Warzybok, P., Bradley, R. W., Orr, A. J., Towell, R.G., and
Jahncke, J. 2018. Initial growth of northern fur seal (Callorhinus ursinus) colonies at the
South Farallon, San Miguel, and Bogoslof Islands. Journal of Mammalogy, 99(6), 1529-
1538.
Lowry, M. S., Condit, R., Hatfield, B., Allen, S. G., Berger, R. W., Morris, P.A., Le Boeuf, B. J. and
Reiter, J. 2014. Abundance, distribution and population growth of the Northern
elephant seal (Mirounga angustirostris) in the United States from 1991 to 2010. Aquatic
Mammals 40(1): 20-31.
Sydeman, W.J., & S.G. Allen. 1999. Pinniped population dynamics in central California:
correlations with sea surface temperature and upwelling indices. Marine Mammal
Science 15: 446-461.
Tivers, R.L. 1972. Parental inivestment and sexual selection. In: Sexual Selection and the Descent
of Man. 1871-1971 (Ed. By B. Campbell), pp. 136-179. Chicago: Aldine.
Zeno, R. L., R. Condit, D. P. Costa , D. E. Crocker, B. Hatfield, B. J. Le Boeuf , D. E. Lee, P. A.
Morris , J. Reiter , S. G. Allen. 2008. Population trends for the Point Reyes National
Seashore northern elephant seal colony and predictions for future growth. Natural
Resource Symposium poster presentation.
NORTHERN FUR SEALS
Baker, J. D., G. A. Antonelis, C. W. Fowler, and A. E.York. 1995. Natal site fidelity in northern fur
seals, Callorhinus ursinus. Animal Behaviour 50:237-247.
Kajimura, H. 1984. Opportunistic feeding of the northern fur seal, Callorhinus ursinus, in the
eastern North Pacific Ocean and eastern Bering Sea. NOAA Technical Report NMFS SSRF-
779. 49 pp.
Kenyon, K. W., and F. Wilke. 1953. Migration of the northern fur seal, Callorhinus ursinus.
Journal of Mammalogy 34:86–98.
Pyle, P., D. J. Jones, J. Schonewald, R. E. Jones, and J. Roletto. 2001. Historical and recent
colonization of the South Farallon Islands, California, by northern fur seals (Callorhinus
ursinus). Marine Mammal Science 17:397-402.2019 Farallon Island Pinniped Report Duncan, G.P. 17
Ream, R. R, J. Sterling, and T. R. Loughlin. 2005. Oceanographic features related to northern fur
seal migratory movement. Deep-Sea Research II 52:823 843.
Reeves, R.R., B. S. Stewart, P. J. Clapham, J.A. Powell and P.A. Folkens. 2002. Guide to Marine
Mammals of the World. Pg 88.
Scheffer, V. B., and B. S. Kraus. 1964. Dentition of the northern fur seal. Fishery Bulletin, U.S.
63:293-315.
Starks, E. C. 1922. Records of the capture of fur seals on land in California. California Fish and
Game 8:155-160.
Testa, J. W. (editor) 2007. Fur seal investigations 2004-2005. U.S. Department of Commerce,
NOAA Technical Memorandum NMFS-AFSC-174. 76 pp.
Tietz, J. R. 2013. Pinniped surveys on West End Island, Farallon National Wildlife Refuge 2011.
Unpublished report to the US Fish and Wildlife Service. PRBO Conservation Science,
Petaluma,California. PRBO Contribution Number 1923.
Towell, R. G., R. R. Ream, and A. E.York. 2006. Decline in northern fur seal (Callorhinus ursinus)
pup production on the Pribilof Islands. Marine Mammal Science 22:486-491.
Townsend, C. H. 1931. The fur seal of the California islands. New York Zoological Society 9:443-
457.
York, A. E., R. G.Towell, R. R.Ream, and C. W. Fowler. 2005. Population assessment of northern
fur seal on the Pribilof Islands, Alaska, 2002-2003. Pages 8-28 in J. W. Testa, ed. Fur seal
investigations, 2002-2003. U.S. Department of Commerce, NOAA Technical
Memorandum NMFS-AFSC-151. 72pp.
HARBOR SEALS
Bjorge A, Thompson D, Hammond P, Fedak M, Bryant E, et al. (1995) Habitat use and diving
behaviour of harbour seals in a coastal archipelago in Norway. In: Blix AS, Walloe L,
Ulltang O, editors. Whales, seals, fish and man: proceedings of the international
symposium on the biology of marine mammals in the North East Atlantic, Tromso,
Norway, 29 November-1 December 1994. Amsterdam: Elsevier. pp. 211–224.
Cronin MA, Zuur AF, Rogan E, McConnell BJ (2009) Using mobile phone telemetry to investigate
the haul-out behaviour of harbour seals Phoca vitulina vitulina. Endangered Species
Research 10: 255–267.
Godsell J (1988) Herd formation and haul-out behaviour in harbour seals (Phoca vitulina).
Journal of Zoology London 215: 83–98.2019 Farallon Island Pinniped Report Duncan, G.P. 18
Harvey, J.T. and D. Goley. 2011. Determining a correction factor for aerial surveys of harbor
seals in California. Marine Mammal Science 27(4):719-735.
Riedman M (1990) The pinnipeds. Seals, sea lions, and walruses. Berkeley/Los Angeles:
University of California Press. 439 p.
Sharples RJ, Moss SE, Patterson TA, Hammond PS (2012) Spatial variation in foraging behaviour
of a marine top predator (Phoca vitulina) determined by a large-scale satellite tagging
program. PLoS ONE 7: e37216. doi:37210.31371/ journal.pone.0037216.
Thompson PM, Fedak MA, McConnell BJ, Nicholas KS (1989) Seasonal and sex related variation
in the activity patterns of common seals (Phoca vitulina). Journal of Applied Ecology 26:
521–535.
CALIFORNIA SEA LIONS
DeLong, R. L., G. A. Antonelis, C. W. Oliver, B. S. Stewart, M. S. Lowry, and P. K. Yochem. 1991.
Effects of the 1982-1983 El Niño on several population parameters and diet of California
sea lions on the California Channel Islands. In F. Trillmich and K. A. Ono (editors),
Pinnipeds and El Niño: Responses to environmental stress. p. 166 -172. Springer-Verlag,
Berlin Heidelberg New York.
STELLER SEA LIONS
Allen, B. M. and R. P. Angliss. 2011. Alaska marine mammal stock assessments, 2010. NOAA
Technical Memorandum NMFS-AFSC-223, Alaska Fisheries Science Center, Seattle,
Washington.
Bonnot, P., G. H. Clark, and S.R. Hatton. 1938. California sea lion census for 1938. Calif. Fish
Game 24:415-419
Bonnot, P. and W.H. Ripley. 1948. The California sea lion census for 1947. Calif. Fish Game
34:89-92
Hastings, K.K. and W.J. Sydeman. 2002. Population status, seasonal variation in abundance, and
long-term population trends of Steller sea lions at the South Farallon Islands, California.
Fish. Bull. 100:51-62
Jarman, W.M., Bacon, C.E., Estes, J.A., Simon, M., Norstrom, R.J., 1996. Organochlorine
contaminants in sea otters: the sea otter as a bio-indicator. Endangered Species Update
13, 20±22.
LeBoeuf, B. J., K. Ono, and J. Reiter. 1991. History of the Steller sea lion population at Año
Nuevo Island, 1961-1991. Southwest Fish. Sci. Center Admin. Rep. LJ-91-45C. U.S. Dep.
Commer., La Jolla, CA, 9p2019 Farallon Island Pinniped Report Duncan, G.P. 19
NMFS (National Marine Fisheries Service). 2008. Recovery plan for the Steller sea lion
(Eumetopias jubatus). Revision. National Marine Fisheries Service, Silver Spring,
Maryland.
Pitcher, K. W., P. F. Olesiuk, R. F. Brown, M. S. Lowry, S. J. Jeffries, J. L. Sease, W. L. Perryman, C.
E. Stinchcomb, and L. F. Lowry. 2007. Status and trends in abundance and distribution of
the eastern Steller sea lion (Eumetopias jubatus) population. Fisheries Bulletin 107:102-
115.
Sydeman, W.J. and S.G. Allen. 1999. Pinniped population dynamics in central California:
Correlations with sea surface temperatures and upwelling indices. Marine Mammal
Science 15(2): 446-461
Sydeman, W.J., Jarman, W.M., 1998. Trace metals in seabirds, Steller sea lion, and forage fish
and zooplankton from central California. Mar. Pollut. Bull. 36, 828–832.
GENERAL
Johnson, N. C., 2014. Atmospheric Science: A boost in big El Niño Nature Climate Change 4, 90–
91. Published online 29 January 2014.
http://www.nature.com/nclimate/journal/v4/n2/full/nclimate2108.html
Wenju Cai, Simon Borlace, Matthieu Lengaigne, Peter van Rensch, Mat Collins, Gabriel Vecchi,
Axel Timmermann, Agus Santoso, Michael J. McPhaden, Lixin Wu, Matthew H. England,
Guojian Wang, Eric Guilyardi & Fei-Fei Jin, 2013. Increasing frequency of extreme El Niño
events due to greenhouse warming. Nature Climate Change 4, 111–116. Published
online 19 January 2014.
http://www.nature.com/nclimate/journal/v4/n2/full/nclimate2100.html2019 Farallon Island Pinniped Report Duncan, G.P. 20
TABLES
Table 1. 2019 Population dynamics of 3 Northern Elephant Seal harem locations on SEFI and 2 harem
locations on WEI. Total numbers reflect each island separately and combined together.
*Numbers presented for WEI may be influenced by the limited number of visits. SF=Sand Flat,
MTSF=Marine Terrace Sand Flat, MB=Mirounga Beach, IHB/PCH=Indian Head Beach/Pastel Cave
Highlands, SB=Shell Beach. C=cows, P=pups, W=weaners.
Harem Natality Pup Sur Pup Mor Rep Suc
Island Location α Male # Cows # Pups # Wean P/C W/P 1-W/P W/C
SEFI SF Becky 52 46 33 0.88 0.72 0.28 0.63
SEFI MB Lemmy 9 7 5 0.78 0.71 0.29 0.56
SEFI Gulches N/A 1 1 0 1.00 0.00 1.00 0.00
SEFI Total 62 54 38 0.87 0.70 0.30 0.61
WEI IHB/PCH No ID 27 16 14 0.59 0.88 0.12 0.52
WEI SB No ID 1 1 1 1.00 1.00 0.00 1.00
WEI Total 28 17 15 0.61 0.88 0.12 0.54
Winter
2019 Total 90 71 53 0.79 0.75 0.25 0.592019 Farallon Island Pinniped Report Duncan, G.P. 21
Table 2. 2015 - 2018 Pupping season counts of Northern Fur Seals on the South Farallon Islands from
weekly pinniped censuses conducted from the Lighthouse. Blue highlighted rows indicate the
peak number of pups detected from the lighthouse. AM, adult male; Non-ID, unidentified
age/sex.
DATE AM Pup Non-ID Total
7/16/2015 51 252 355 658
7/23/2015 51 309 340 700
7/30/2015 30 287 206 523
8/6/2015 39 285 358 682
8/13/2015 15 273 196 484
8/20/2015 3 231 348 582
8/27/2015 7 111 303 421
DATE AM Pup Non-ID Total
6/30/2016 48 142 297 487
7/16/2016 . . . .
7/21/2016 60 338 405 803
8/4/2016 36 447 493 976
8/18/2016 5 339 559 903
8/25/2016 7 199 378 584
Date AM Pup Non-ID Total
6/29/2017 42 240 377 659
7/6/2017 89 291 656 1036
7/13/2017 63 367 605 1035
7/20/2017 95 522 568 1185
7/28/2017 31 332 592 955
8/3/2017 35 530 226 791
8/10/2017 20 353 485 858
8/17/2017 23 335 343 701
8/24/2017 10 422 416 848
Date AM Pup Non-ID Total
6/29/2018 56 186 426 668
7/5/2018 43 350 461 854
7/15/2018 50 393 502 945
7/20/2018 29 295 464 788
8/2/2018 18 399 455 872
8/16/2018 24 579 248 851
8/25/2018 6 332 285 623
8/31/2018 11 176 279 4662019 Farallon Island Pinniped Report Duncan, G.P. 22
Table 3. Northern fur seal counts conducted during visits to the West End Island colony in Sep and Oct of
2016 (n=3), 2017 (n=3) and 2018 (n=1). AM, adult male; AF, adult female; SAM, subadult male; Imm,
immature; Non-ID, unidentified age/sex.
DATE AM AF Pup SAM Imm Non-ID Total
10/1/2016 5 1 212 9 96 1107 1430
10/20/2016 6 10 10 6 420 978 1430
11/22/2016 5 0 68 311 69 416 869
Average 5.3 3.7 96.7 108.7 195.0 833.7 1243.0
Std Dev 0.6 5.5 104.0 175.2 195.3 367.4 323.9
DATE AM AF Pup SAM Imm Non-ID Total
9/04/2017 12 336 898 22 10 355 1638
9/29/2017 30 205 691 45 17 546 1539
10/18/2017 42 208 902 62 30 428 1672
Average 28 250 830 43 19 443 1616
Std Dev 12 61 99 16 8 79 56
DATE AM AF Pup SAM Imm Non-ID Total
9/14/2018 22 310 611 109 45 656 1753
Table 4. Max counts of total population and pups from LH surveys for pinniped species by year from
2008-2018.
YEAR
2008-2017
2008 2009 2010 2011 2012 2013 2014 2015 2016 2017 2018 Average
NES Total 457 374 420 468 476 517 479 495 390 353 357 443 ±53
PINNIPED
NFS Total 115 132 248 251 375 492 637 700 976 1185 1092 511 ±343
SPECIES
HS Total 108 155 129 145 152 136 195 181 182 146 125 153 ±25
CSL Total 11326 7785 7451 9380 5386 4408 4917 9442 5555 7776 6311 7343 ±2153
SSL Total 169 94 124 121 167 196 181 163 152 255 233 162 ±43
NES Pups 81 86 74 61 42 53 42 50 40 50 60 58 ±16
PINNIPED
NFS Pups 66 80 127 180 213 254 361 309 447 530 579 257 ±147
SPECIES
HS Pups 7 5 5 11 4 12 8 4 7 3 4 7 ±3
CSL Pups 16 44 38 84 86 156 194 254 265 509 505 165 ±142
SSL Pups 11 13 28 25 34 26 45 37 29 44 44 29 ±11You can also read