31 DECEMBER 2020 FULL YEAR RESULTS - TUESDAY, 23 FEBRUARY 2021 - AFR
←
→
Page content transcription
If your browser does not render page correctly, please read the page content below
31 DECEMBER 2020
FULL YEAR RESULTS
TUESDAY, 23 FEBRUARY 2021
INFRASTRUCTURE FOR THE FUTURE

SPARK INFRASTRUCTURE – AT A GLANCE
ASX-listed owner of leading essential energy infrastructure

                                         MARKET                                          Distribution                                         Transmission                                         Renewables
   $3.6bn                                CAPITALISATION(1)
                                         S&P/ASX 100                                     Victoria Power Networks                              TransGrid                                            Bomen Solar Farm
                                                                                         and SA Power Networks                                (NSW)                                                (NSW)

   $6.7bn
                                     REGULATED AND
                                     CONTRACTED ASSET
                                     BASE (PROPORTIONAL)
                                                                         49%
                                                                          SPARK INFRASTRUCTURE
                                                                                                                               15%
                                                                                                                               SPARK INFRASTRUCTURE
                                                                                                                                                                                    100%
                                                                                                                                                                                    SPARK INFRASTRUCTURE
                                                                          OWNERSHIP                                            OWNERSHIP                                            OWNERSHIP

                    $18.7bn
                    TOTAL ELECTRICITY NETWORK
                                                                         $11.03bn                                              $7.52bn                                              $0.17bn
                    AND GENERATION ASSETS(2)                              REGULATED ASSET BASE                                 REGULATED AND                                        CONTRACTED ASSET BASE
                                                                                                                               CONTRACTED ASSET BASE

                     SUPPLYING
                     5.0m+                                                                                                                                                                                          WAGGA
                     HOMES AND BUSINESSES                                    80%                                                   17%                                                  3%                          WAGGA,
                                                                                                                                                                                                                    NSW

                    5,400                                                 SKI PROPORTIONAL                                     SKI PROPORTIONAL                                     SKI PROPORTIONAL
                    EMPLOYEES                                             ASSET BASE(3)                                        ASSET BASE(3)                                        ASSET BASE(3)

(1) As at 19 February 2021. Balance sheet and other information as at 31 December 2020 (2) Spark Infrastructure has proportional interests in $18.7bn of total electricity network and contracted generation assets (3) Pro forma

Spark Infrastructure I Investor Presentation I February 2021                                                                                                                                                                        2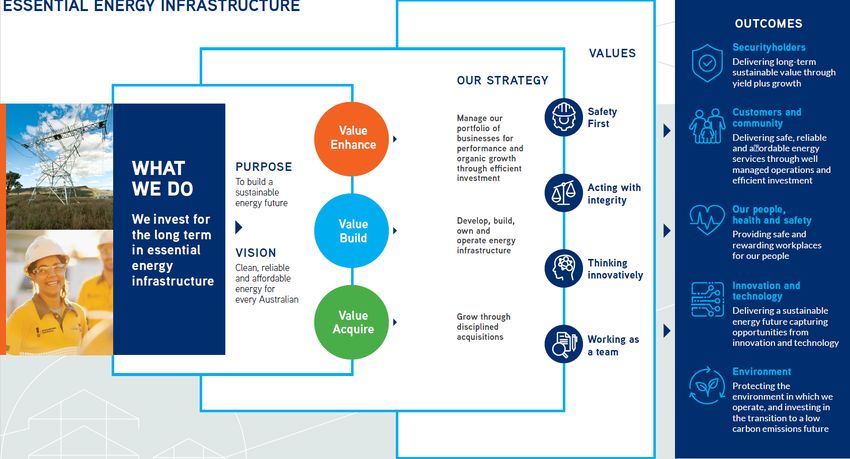
INFRASTRUCTURE FOR THE FUTURE

FINANCIAL HIGHLIGHTS
Solid earnings and growth delivered by high quality energy network businesses

                       Underlying Look-
                                                                                       FY2020                                               Regulated                                     Contracted
                       through EBITDA(1)
                                                                                       Distribution                                         asset base(1)                                 asset base(2)

      $862m                                                             13.5cps                                               $6.4bn
                                                                                                                              Up 3.3%
                                                                                                                                                                                   $294m
                                                                                                                                                                                    Up 13.4%
                                                                          +2.1cps franking
         Up 2.4%                                                                       FY2021                                               Growth                                        FFO/
                                                                                       Distribution                                         capital                                       Net debt(5)
                                                                                       guidance (3)                                         expenditure(4)

                                                                        12.5cps                                                $231m                                               12.4%
                                                                            + ~25% franking                                    Up 13.3%                                             Down -1.1%

(1)   On an aggregated proportional basis to Spark Infrastructure
(2)   Includes Bomen Solar Farm and TransGrid CAB on a proportional basis to Spark Infrastructure
(3)   Subject to business conditions
(4)   Represents increase in RCAB excluding Bomen Solar Farm acquisition and construction costs
(5)   Funds From Operations (FFO)/ Net debt on a look-through proportional basis including underlying Bomen Solar Farm cash flows and Spark Infrastructure corporate and interest costs

Spark Infrastructure I Investor Presentation I February 2021                                                                                                                                              3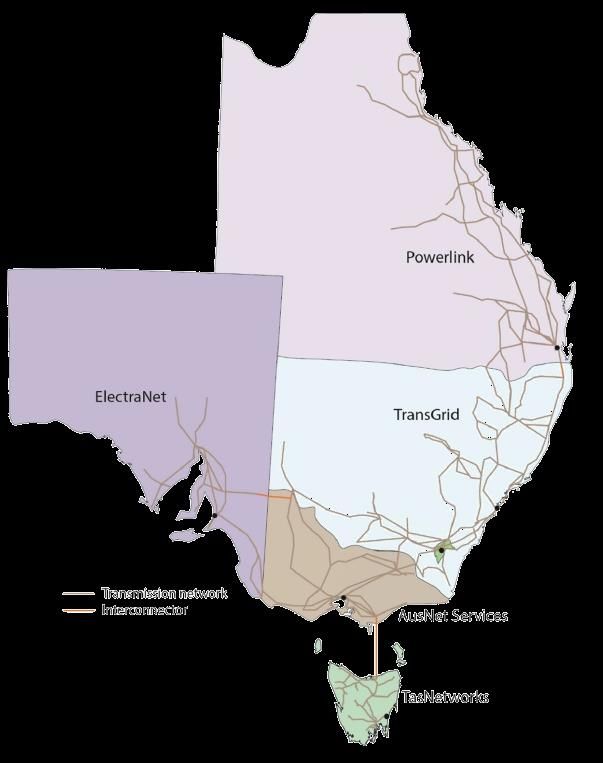
INFRASTRUCTURE FOR THE FUTURE

KEY ACHIEVEMENTS FOR FY2020
Highly defensive businesses investing in Australia’s energy transition

  •       COVID-19:
      -     Minimal impact on operations, continued safe operation and reliability
      -     No reliance on government support
      -     Continuing to support consumers through network tariff relief
  •       Distribution guidance for FY2020 maintained and delivered. Franking credits to be attached for the first time in 2020
  •       Regulatory determinations complete (SAPN) or close to completion (VPN) – lays foundation for next 5 years
  •       Regulatory forecast of inflation changed – to be applied in VPN final determination from 1 July 2021
  •       3.7% growth in regulated and contracted asset base
  •       First renewable energy project delivered on time and significantly under budget. Commenced commercial operations late June 2020
  •       Success in ATO appeal; ~$45m refund expected in 2021
  •       Pipeline (c.1.5GW) of renewable project options established
  •       Uplift in ESG recognition: B rating from CDP

  Delivering Yield and Growth in difficult conditions, and continuing to invest in the energy transition

Spark Infrastructure I Investor Presentation I February 2021                                                                                4
INFRASTRUCTURE FOR THE FUTURE
PERFORMANCE SUMMARY
Proportional Results - VPN, SAPN & TGD ($m)(1) 2020 2019 Change Proportional Results
2020 Change
($m)
Distribution and transmission revenue 1,022.8 998.1 2.5% EBITDA
Other revenue 155.0 168.2 -7.8%
VPN 442.5 6.4%
Total Revenue 1,177.8 1,166.3 1.0%
SAPN 327.4 -3.3%
Operating costs (330.6) (326.4) 1.3%
TransGrid 100.4 -1.7%
Beon margin (VPN) 9.8 5.5 78.2%
Proportional EBITDA 870.3 1.6%
Enerven margin (SAPN) 13.3 11.2 18.8%
EBITDA 870.3 856.6 1.6%
Bomen Solar Farm 5.3 n/m
Net external finance costs (181.4) (183.3) -1.0%
Corporate Costs (13.2) 10.8%
EBTDA 688.9 673.3 2.3%
Underlying look-through
862.4 2.4%
(2)
EBITDA
Growth Capex 230.7 203.6 13.3%
RCAB (Spark share)(2) 6,533.1 6,302.3 3.7%
Spark Infrastructure share of RCAB has increased by 3.7%
(1) On an aggregated proportional basis to Spark Infrastructure
(2) Excludes Bomen Solar Farm
Spark Infrastructure I Investor Presentation I February 2021 5INFRASTRUCTURE FOR THE FUTURE
WHY INVEST IN SPARK INFRASTRUCTURE
Listed essential energy infrastructure portfolio Reliable and attractive yield
• High quality Australian energy network businesses • Only company to be placed in the top 10 for distribution yield over each of the last 5
• Highly sought after regulated transmission and distribution assets years in ASX100
• Contracted unregulated businesses with strong reputations and long-dated contracts
• Increased certainty over 5-year distributions outlook
• Utility scale renewable generation; operating asset + development pipeline
• Franking now increases value of distribution
Low risk business model
• Essential infrastructure not impacted by pandemic, commodity or other economic Strong growth in asset base
shocks • Investing in Australia’s energy transition
• Sustained value through long-dated and growing asset base
• Investment grade credit ratings ensure continued access to low-cost capital Long-standing, experienced and industry-based management team
10.00 Spark Infrastructure proportional RCAB
CAGR 6.9%(2)
9.21
8.00 8.81
8.34
CAGR 7.1%(1) 7.70
7.09
6.00 6.46 6.70
6.08
$bn
5.73 5.88
4.00 4.42 4.64
3.96 4.22
3.61
2.00
-
FY11 FY12 FY13 FY14 FY15 FY16 FY17 FY18 FY19 FY20 FY21 FY22 FY23 FY24 FY25
(1) CAGR calculated over the 10-year period 2011-2020
(2) CAGR calculated over 15-year period 2011-2025
Spark Infrastructure I Investor Presentation I February 2021 6INFRASTRUCTURE FOR THE FUTURE
DISTRIBUTION OUTLOOK
Outlook rebased to reflect VPN and SAPN’ 5-year regulatory determinations and reflecting transition to tax payer
Reg. Distribution Profile Reg. Cash Distribution Outlook
Period Period
16.00
16.00 15.25 15.00
14.50 2.1 2020 Full-year distribution of 13.5 cps
~3.0
13.50 Franking Credits
12.50
12.00
12.00 2021 Full-year rebased distribution guidance of 12.5 cps
Trust Distribution
2022-25 Rebased distribution + CPI
CPS
8.00
Interest on Loan Notes Distribution Outlook
4.00
• Rebased 12.5cps for 2021
0.00 • Estimated Franking of ~3.0 cps in 2021
FY15 FY16 FY17 FY18 FY19 FY20 FY21
• Targeting growth in distribution ~CPI to 2025
Historic Distributions
• Estimated franking of 25% to 2025
• Fully covered by operating cash flow
• Retained cumulative Standalone Operating Cash Flow of 6.5cps (c.$110m) over last 5 years • Sustainability based on operating cash flow across the period
ISP Major Project growth and Value Build growth to be funded by DRP and debt, not at expense of distributions
Spark Infrastructure I Investor Presentation I February 2021 7INFRASTRUCTURE FOR THE FUTURE FINANCIAL RESULTS FULL YEAR 2020 Spark Infrastructure I Investor Presentation I February 2021 8
INFRASTRUCTURE FOR THE FUTURE

STANDALONE NET OPERATING CASH FLOW
Net Operating Cash Flow ($m)                                                                     2020                 2019              Change

Investment Portfolio Distributions and Interest
Victoria Power Networks - includes repayment of shareholder loans                               171.5                 159.5                 7.5%
SA Power Networks                                                                               106.6                 116.2                -8.3%
TransGrid                                                                                         22.9                 36.8               -37.8%
Total Investment Portfolio Distributions and Interest                                           301.0                 312.5                -3.7%
Net operating cashflows - Bomen Solar Farm                                                         4.7                     -                  n/m
Net interest (paid)/received                                                                      (1.8)                  1.2            -250.0%
Corporate expenses                                                                              (13.2)                (13.3)               -0.8%
Underlying Net Standalone OCF before tax                                                        290.7                 300.4                -3.2%
           (1)
Tax paid                                                                                        (37.9)                (16.9)             124.3%
Underlying Net Standalone OCF after tax                                                         252.8                 283.5              -10.8%
Underlying Standalone OCF per Security                                                       14.7 cps             16.8 cps                -11.8%
Project and transaction bid costs                                                                 (5.6)                (5.3)                5.7%
                        (3)
Other interest paid                                                                               (6.7)                    -                  n/m
                  (2)
Other tax paid                                                                                  (48.0)                (21.8)             120.2%
Standalone Net OCF - statutory                                                                  192.5                 256.4              -24.9%
Spark Infrastructure Distribution per Security                                               13.5 cps             15.0 cps                 -6.3%
Underlying Pay-out ratio                                                                          92%                  90%
Underlying Effective Tax Rate                                                                  13.0%                  5.7%

  Cumulative underlying payout ratio for the last 5 years (2016 – 2020) is 93% (after tax payments)
(1) Tax paid of $37.9m in 2020 represents the 2019 tax liability for the SIH1 and SIH2 tax groups. 2019 tax paid of $16.9m represents the 2019 tax liability for SIH2 tax group. (2) Other tax paid of $48.0m comprised of $34.4m tax
paid in relation to a number of historical years, and $13.6m relating to instalments for the 31 December 2020 income tax year. 2019 other tax paid represents $21.8m of tax paid in relation to a number of historical tax years (2015-
2018). Refer to slide 45 for additional tax information (3) Other interest paid includes an interest charge of $6.7m on historical tax payments made (related to the ATO litigation) of which $5.0m is expected to be refunded in 2021.

Spark Infrastructure I Investor Presentation I February 2021                                                                                                                                                                         9
INFRASTRUCTURE FOR THE FUTURE
UNDERLYING LOOK-THROUGH CASH FLOW SUMMARY
Victoria Power SA Power Spark
Spark Infrastructure share ($m) TransGrid 2020 2019 Change
Networks Networks Infrastructure
EBITDA from operations 442.5 327.4 100.4 5.3 875.6 856.6 2.2%
less corporate costs - - - (13.2) (13.2) (14.8) -10.8%
Look-through EBITDA 442.5 327.4 100.4 (7.9) 862.4 841.8 2.4%
less net finance charges (1) (79.6) (64.5) (32.2) (1.8) (178.1) (175.0) 1.8%
less net reg/unreg depreciation/maint. capex (2) (148.1) (135.1) (29.2) - (312.4) (276.3) 13.1%
Working capital/non cash movements (28.6) 17.1 (1.7) (0.6) (13.7) 6.9 n/m
Underlying net operating cash flows before tax 186.2 144.9 37.4 (10.3) 358.2 397.4 -9.9%
less tax paid(3)(4) - - - (37.9) (37.9) (18.1) n/m
Underlying net operating cash flows after tax 186.2 144.9 37.4 (48.2) 320.3 379.3 -15.6%
Underlying Standalone OCF per Security 18.6 cps 22.5 cps -17.3%
Distributions paid (5) 233.5 253.6
Growth capex(6) (145.1) (27.0) (58.6) - (230.7) (203.6) 13.3%
Bomen Solar Farm acquisition and construction costs - - - (9.8) (9.8) (164.2) -94.0%
Other 5.2 (12.9) (10.5) - (18.3) (34.4) -46.8%
Investing cash flows (139.9) (39.9) (69.1) (9.8) (258.8) (402.2) -35.7%
Look-through EBITDA for FY2020 increased by 2.4%; growth capex up 13.3% to $230.7m
(1) Corporate finance charges excludes interest paid of $6.7m on historical tax payments made (under review)
(2) Net reg/unreg depreciation is a proxy for maintenance capex. It is calculated as regulatory depreciation net of CPI uplift on RAB. Increase in net regulatory depreciation is primarily driven by decrease in CPI adjustment in
comparison to 2019.
(3) Spark Infrastructure corporate tax paid of $37.9m in 2020 represents the 2019 tax liability for the SIH1 and SIH2 tax groups. 2019 tax paid of $16.9m represents the 2018 tax liability for SIH2 tax group. Excludes other tax
paid of $48.0m. Refer to slide 45 for additional tax information.
(4) VPN and SAPN cash tax paid of $22.8m and $2.8m respectively has been excluded as a tax refund related to the ATO litigation is expected in 2021 and the benefit of franking credits will be distributed to Spark Infrastructure
in future years
(5) Total FY2020 and FY2019 distributions are based on weighted average number of Spark Infrastructure securities on issue throughout the year.
(6) Represents net increase in RCAB
Spark Infrastructure I Investor Presentation I February 2021 10INFRASTRUCTURE FOR THE FUTURE
STRONG BALANCE SHEET & LOW REFINANCING RISKS
All figures Rating Total Debt Facilities Next Maturity
Undrawn Drawn Average
100% at 31 (S&P / Avg.
Debt Debt Interest Rate Amount Amount Date
Dec 2020 Moody’s) Maturity
VPN A- / n/a $475m $4,928m 3.4%(4) $5,403m 4.6 years $425m August 2021
SAPN A- /n/a $275m $3,322m 4.1%(4) $3,597m 5.9 years $53m June 2022
TransGrid n/a / Baa2(1) $1,264m(2) $6,183m(2) 3.7%(4) $7,447m(2) 5.1 years $287m(3) June 2021
Corporate n/a / Baa1 $360m $40m 2.3% $400m 2.1 years $400m February 2023
• Substantial undrawn and committed facilities
• Investment grade credit ratings; SKI corporate rating currently negative outlook; expect to be Baa2 in 2021
in anticipation of lower regulatory returns over next 5 years
• Access to multiple sources of debt
• Long-weighted average maturities
• Minimal short-term refinancing requirements
(1) Relates to the TransGrid Obligor Group
(2) Relates to TransGrid Obligor Group and TransGrid Services
(3) This amount excludes $313m undrawn debt at 31 December 2020
(4) Average interest rate is calculated based on finance charges (less non-cash credit valuation hedge adjustments) divided by average gross debt in the period
Spark Infrastructure I Investor Presentation I February 2021 11INFRASTRUCTURE FOR THE FUTURE OUR INVESTMENTS’ FINANCIAL RESULTS FULL YEAR 2020 Spark Infrastructure I Investor Presentation I February 2021 12
INFRASTRUCTURE FOR THE FUTURE

VICTORIA POWER NETWORKS
Financial ($m)(1)                                                                          2020               2019           Change           CPI-X                     $37.1m
Regulated revenue - DUOS                                                                1,001.1               956.9               4.6%
Prescribed metering ("AMI")                                                                 81.4                85.7             -5.0%
                                                                                                                                              STPIS(2)                  $22.2m
Semi-regulated revenue                                                                      62.4                60.8              2.6%
Unregulated revenue                                                                         42.0                47.0           -10.6%
                                                                                                                                              Customer
                                                                                                                                              Growth(3)                 0.9%
Total Revenue                                                                           1,186.9            1,150.4                3.2%
Operating costs                                                                         (303.9)             (312.8)              -2.8%
                                                                                                                                              Consumption
                                                                                                                                              (3)                       -5.1%
Beon margin                                                                                 20.1                11.3            77.9%
EBITDA                                                                                    903.1               848.9               6.4%
                                                                                                                                              FTE
                                                                                                                                              Change(3)                 1.7%
Other
Net finance costs              (4)
                                                                                        (165.6)             (167.2)              -1.0%
                                                                                                                                              Net Debt /
                                                                                                                                              RAB                       72.3%
Net capital expenditure                                                                 (585.2)             (507.6)             15.3%
Distributions received by Spark Infrastructure                                            171.5               159.5               7.5%
                                                                                                                                              FFO /
                                                                                                                                              Net Debt                  13.8%
  Victoria Power Networks EBITDA for FY2020 increased by $54.2m or 6.4%
(1) 100% basis (2) 2017 STPIS recovered in FY2020 (3) Compared with FY2019 (4) FY2020 includes a $1.9m (loss) in non-cash credit valuation hedge adjustments (FY2019: $0.4m gain)

Spark Infrastructure I Investor Presentation I February 2021                                                                                                                        13
INFRASTRUCTURE FOR THE FUTURE
VICTORIA POWER NETWORKS
Key Financial Drivers
Regulated Revenue • CPI of 1.59% from 1 January 2020
Up by 4.6% • X-factors for Powercor: -2.40% and CitiPower: -1.88% representing a real increase in revenue before CPI
• $22.2m STPIS recovery
Regulated Asset Base • RAB increased to $6,635m
Up by 4.7%(2) • Increase driven by net capex of $606m, less regulatory depreciation of $402m, and CPI uplift of $100m
Other Revenue • Semi-regulated revenue: up 2.6% – increased new connections revenue driven by residential growth in the Powercor Network
(excl. Beon) • AMI revenue: down 5.0% – depreciating RAB
Down by 5.0%
• Unregulated revenue: down 10.6% – sale of properties in the previous year
Operating Costs • Revaluation of employee entitlement provisions and tight cost control in the business; partially offset by:
(excl. Beon)
Down by 2.8% • Higher lines maintenance, faults and insurance costs
Beon Margin • Continued growth in new solar projects such as Jemalong and Melbourne Airport Solar Projects
Up by 77.9%
Net Capital Expenditure • Growth capex of $387.2m up 13.0% (network connections and augmentation) – continuation of REFCL(1) program
Up by 15.3% • Maintenance capex of $198.0m up 20.0% – zone substation replacement projects
• Highest ever capex program
Victoria Power Networks RAB has increased 4.7% over the last 12 months
(1) Rapid Earth Fault Current Limiter (2) From 31 December 2019
Spark Infrastructure I Investor Presentation I February 2021 14INFRASTRUCTURE FOR THE FUTURE
SA POWER NETWORKS
Financial ($m)(1) 2020 2019 Change CPI-X $10.7m
Regulated revenue – DUOS 849.2 848.8 0.0%
STPIS(3) $34.0m
Semi-regulated revenue 81.4 97.3 -16.3%
Unregulated revenue 11.6 14.0 -17.1%
Total Revenue 942.2 960.1 -1.9%
Customer
Growth(4) 1.1%
Operating costs (301.2) (292.2) 3.1%
Enerven margin 27.1 22.8 18.9%
Consumption
(4) -3.6%
EBITDA
Other
668.1 690.7 -3.3% FTE
Change(4) 0.4%
Net finance costs (2) (137.2) (138.7) -1.1% Net Debt /
RAB 73.9%
Net capital expenditure (368.7) (405.6) -9.1%
Distributions received by Spark Infrastructure 106.6 116.2 -8.3%
FFO /
Net Debt 15.9%
SA Power Networks EBITDA for FY2020 decreased by $22.6m or 3.3%
(1) 100% basis (2) FY2020 includes a $2.1m (loss) credit valuation hedge adjustment (FY2019: includes a $1.4m loss) (3) 2017/18 STPIS result to be recovered from 1 July 2019 and 2018/19 STPIS result to be recovered from 1
July 2020 (4) Compared to FY 2019
Spark Infrastructure I Investor Presentation I February 2021 15INFRASTRUCTURE FOR THE FUTURE
SA POWER NETWORKS
Key Financial Drivers
Regulated Revenue • CPI of 1.78% from 1 July 2019 (1 July 2018: CPI 1.91%)
Up by $0.4m • X-factor applicable from 1 July 2019 was -0.85% representing a real increase in revenue before CPI. No X-factor was applied for
2020/21 because the AER set the 2020/21 expected revenue in the Final Determination
• $34.0m STPIS recovery
Regulated Asset Base • RAB increased to $4,395m
Up by 1.3%(2) • Increase driven by net capex of $347m(1), less regulatory depreciation of $328m, and includes CPI uplift of $52m
Underlying Other Revenue • Semi-regulated revenue: down 4.8%(3) - declining activity across all areas of asset relocation, embedded generation and council funded
Down by 6.5%(3) replacement of public lighting
• Unregulated revenue down $2.4m due to sale of assets in 2019
Underlying Operating • Revised corporate overhead capitalisation policy; partially offset by:
Costs (Excl. Enerven) • Reduced expenditure in connection with emergency response and lower labour costs
Up by 3.1% • 2019 bushfire provisions adjusted
Enerven Margin • Change in project mix, with projects for existing client base (including ElectraNet) complemented by new business activity including
Up by 18.9% commercial solar and battery solutions
• Enerven was engaged in deploying solar and battery capability to a significant number of SA Water sites under a framework contract of
up to $300 million, predominately over 2019 and 2020
Net Capital Expenditure • Growth capex of $138.2m, in line with 2019 - network connections and augmentation
Down by 9.1% • Maintenance capex of $230.5m, down 13.7%
SA Power Networks has seen RAB growth of 1.3% over the 12 months
(1) Excludes corporate overheads (2) Includes public lighting RAB (3) Excludes public lighting provision write back of $6.5m in 2019 and 2020 provision of $5.0m. In 2019 a long running public lighting dispute was resolved and
required amounts were settled with customers in January 2020. As a result of finalisation of the quantum of this matter, provisions of $6.5m were unwound in 2019.
Spark Infrastructure I Investor Presentation I February 2021 16INFRASTRUCTURE FOR THE FUTURE
TRANSGRID
Financial ($m) (1) 2020 2019 Change CPI-X(2) $18.2m
Regulated revenue - TUOS 773.6 754.5 2.5%
Unregulated revenue 124.2 120.1 3.4%
STPIS(3) $15.3m
Other Revenue (8) (1.4) 5.4 n/m
Total Revenue 896.4 880.0 1.9%
RAB(4)
Growth 3.2%
Regulated operating costs (165.1) (155.6) 6.1%
Unregulated operating and other costs (62.2) (43.4) 43.3%
CAB(4)(5)
Growth 28.8%
EBITDA 669.1 681.0 -1.7%
Other
FTE
Change(4) -6.2%
Net finance costs (2) (220.3) (222.2) -0.9%
Regulated capital expenditure (501.0) (254.7) 96.7%
Net Debt /
RCAB(5)(6) 80.7%
Contracted capital expenditure (207.2) (238.6) -13.2%
Distributions received by Spark Infrastructure 22.9 36.8 -37.8%
FFO /
Net Debt(7) 7.4%
TransGrid EBITDA for FY2020 decreased by $11.9m or 1.7%
(1) 100% basis (2) Relates to period 1 January 2020 to 31 December 2020 and includes an adjustment relating to the revocation and substitution of TransGrid's revenue determination for the 2014-2018 regulatory period (3) 2019
STPIS result recovered from 1 July 2020 and 2018 STPIS recovered from 1 July 2019 (4) Compared with December 2019 (5) CAB comprises of unregulated infrastructure and telecommunication assets and investment property
(6) Net Debt is calculated using gross debt less cash and adjusted for prescribed revenue over/(under) collection and includes TransGrid Services (TGS) (7) Relates to TransGrid Obligor Group (i.e. excludes TGS) (8) FY2020
amount includes ($1.7m) negative revaluation of investment property
Spark Infrastructure I Investor Presentation I February 2021 17INFRASTRUCTURE FOR THE FUTURE
TRANSGRID
Key Financial Drivers – Regulated Business
Regulated Revenue • CPI of 1.80% from 1 July 2020 (1 July 2019: CPI of 1.80%)
Up by 2.5% • X-factor from 1 July 2020 was -0.17% and from 1 July 2019 was -0.97% representing a real increase in revenues before CPI
• $15.3m STPIS payment
Regulated Asset Base • RAB increased to $6,697m
Up by 3.2% • Increase driven by capital expenditure of $433m, less regulatory depreciation of $282m, and includes CPI uplift of $62m
Operating Costs • Lower labour costs, consulting and other operational costs as a result of operating efficiencies gained
Down 2.1%(3)
Capital Expenditure • Growth/Augmentation capex(1) of $291.9m (up 399.8%)
Up by 96.7%
• Maintenance capex of $170.9m (up 6.4%)
• Non-network(2) capex of $38.2m (up 6.7%)
• Increase was mainly due to investment in augmentation projects including Powering Sydney's Future, Stockdill Switching Station and
ISP projects, and higher maintenance capex
TransGrid has seen RAB growth of 3.2% over the 12 months
(1) Includes Integrated System Plan (ISP) projects
(2) Includes Network Capability Incentive Project Action Plan (NCIPAP) capex
(3) Excluding $12.8m bushfire costs incurred during FY2020 for remediation of damage sustained during the bushfires in November and December 2019, expected to be recovered through cost pass-through provisions.
Spark Infrastructure I Investor Presentation I February 2021 18INFRASTRUCTURE FOR THE FUTURE
TRANSGRID
Key Financial Drivers – Unregulated Business
Contracted Capital • Infrastructure capex includes renewable connections projects delivered in FY2020 (Darlington Point, Kiamal and Bomen Solar Farm)
Expenditure
Down by $31.4m • Increase in telco capex primarily driven by NBN POI rollout
Unregulated Revenue • Infrastructure connection revenue continued to increase in 2020 to $80.9m (FY2019: $50.7m) as construction of a number of
Up by $4.1m connection assets was completed
• Decrease in line modification revenue to $12.8m (FY2019: $39.3m) as a result of the completion of a number of one-off projects in
2019
• Connections revenue is expected to continue to grow with a number of new connections projects currently under construction and in
the pipeline
• Increase in telecommunications revenue as a result of growth in data services and co-location facilities
Unregulated Operating • Increase in new infrastructure connections partially offset by a decrease to the number of line modification projects
Costs
Up by $18.8m • Additional project development costs supporting the acceleration of TransGrid’s rapidly expanding non prescribed connections pipeline,
which is delivering increased contracted revenue growth (i.e. pre-contract / proposal costs)
Contracted Asset Base • CAB increased to $820m
Up by $183.2m(1)
• Increase driven by capex of $208.7m less depreciation of $24m and revaluation decrement on investment property $1.7m
TransGrid has seen CAB growth of 28.8% over the 12 months
(1) From 31 December 2019
Spark Infrastructure I Investor Presentation I February 2021 19INFRASTRUCTURE FOR THE FUTURE
BOMEN SOLAR FARM
2020 Revenue • The revenues were underpinned by the fixed
Underlying Financial Results ($m) $7.0m for the first 6 months revenues associated with the PPA agreements
(6 months)
of operations with Westpac and Flow Power.
PPA fixed revenue 6.2
• Strong pricing in the Large-scale Generation
Merchant electricity revenue 0.1 Certificate’s (LGC) market delivered $0.7m of
revenue during the period through the sale of
Merchant LGC revenue 0.7
merchant LGC’s.
Total Revenue 7.0
Operating costs • Operating expenditure has been in line with
Operating costs (1.7) $1.7m expectations and has included additional
vegetation management to address the increased
EBITDA 5.3 growth in grass on site.
Working capital (0.6)
Generation • The site generated 105,110 MWh of renewable
Net operating cash flows 4.7 105,110 MWh energy during the period, experienced minimal
downtime and no material curtailment or outages
in the period. 3 week outage in January 2021 due
Other to substation fault under investigation.
Generation (MWh) 105,110 CO2-e displaced(1) • The renewable energy generated from Bomen
85,139 tonnes Solar Farm represented the displacement of
85,139 tonnes of CO2-e.
Bomen Solar Farm performed in line with expectations during the first 6 months of operations to 31 December 2020
(1) Australian Government, Department of Industry, Science, Energy and Resources – National Greenhouse Accounts Factors, October 2020.
Spark Infrastructure I Investor Presentation I February 2021 20INFRASTRUCTURE FOR THE FUTURE EFFICIENCY AND REGULATION I N D U S T R Y A N D B U S I N E S S C O N S I D E R AT I O N S Spark Infrastructure I Investor Presentation I February 2021 21
INFRASTRUCTURE FOR THE FUTURE

AER BENCHMARKING
AER Benchmarking Report 2020 – Multilateral Total Factor Productivity (MTFP)1 Rankings

  Distribution Network Service Providers                                                                                Transmission Network Service Providers

   DNSP                                                            2019               Δ             2018                  TNSP                                      2019               Δ              2018

   SA Power Networks                  South Australia                 1                -               1                  TasNetworks                                  1                -               1
   CitiPower                          Victoria                        2                -               2                  ElectraNet                                   2                -               2
   Powercor                           Victoria                        3                ↑               4                  TransGrid                                    3                ↑               4
   United Energy                      Victoria                        4                ↑               5                  Powerlink                                    4                ↑               5
   Ergon Energy                       Queensland                      5                ↓               3                  AusNet                                       5                ↓               3
   Energex                            Queensland                      6                ↑               7
   Endeavour Energy                   NSW                             7                ↑               8               • CitiPower, Powercor and SA Power
   Essential Energy                   NSW                             8                ↓               6                 Networks have remained in top 4
   TasNetworks                        Tasmania                        9                ↑              10                 DNSPs since reporting began in 2006
   Jemena                             Victoria                       10                ↓               9               • TransGrid achieved the highest
   AusNet                             Victoria                       11                -              11                 productivity gains across TNSPs in
   Evo Energy                         ACT                            12                -              12                 2018 and improved its rank from 4th
   Ausgrid                            NSW                            13                -              13
                                                                                                                         to 3rd in 2019

  Continuing to deliver high productivity performances to provide benefits to customers and improve returns
(1) The multilateral total factor productivity is a productivity index numbers (PIN) technique that measures the relationship between total output and total input. It allows both total productivity levels and growth rates to be compared between entities
(networks). In the 2020 annual benchmarking report, the AER also apply the method to time-series TFP analysis at the industry level and for individual TNSP to better capture large Energy Not Supplied (ENS) changes.

Spark Infrastructure I Investor Presentation I February 2021                                                                                                                                                                                                    22
INFRASTRUCTURE FOR THE FUTURE
SAPN 2020-25 FINAL REGULATORY DETERMINATION
The AER Final Determination establishes revenue certainty until 30 June 2025
Regulatory 2020-25
2015-20 2020-25 2020-25 The Final Determination is in line with expectations with
proposal Revised
Allowance(1) Draft Decision(2) Final Decision (2)
improved capex and inflation outcomes
metric Proposal(2)
Capex
($2019-20)
$2,011m $1,247m $1,693m $1,596m Standard Control Services Revenue ($m) and RAB ($bn)(1)(2)
$1,000
Opex
$1,375m $1,473m(3) $1,470m $1,470m
($2019-20)
$800
WACC 6.17% 4.95% 4.79% 4.75%
$600
4.77 4.85
Risk-free 4.59 4.68
2.96% 1.32% 0.96% 0.90% 4.36 4.48
Rate 4.23
$400 4.09
3.88 3.93
Inflation 2.50% 2.45% 2.36% 2.27%(4) $200
Gamma 0.4 0.585 0.585 0.585 $-
FY16 FY17 FY18 FY19 FY20 FY21 FY22 FY23 FY24 FY25
Revenue Allowance Draft Determination Revised Proposal Final Determination
Revenue
$3,769m $3,905m $3,933m $3,914m
(Nominal) Regulated Asset Base
The majority of SA Power Networks’ Revised Proposal was accepted by the AER in the Final Determination released on 5 June 2020
(1) AER Final Decision 2015-2020, October 2015 updated to $2020 (2) AER Final Decision Overview, June 2020.(3) AER Draft Decision Overview, October 2019. (4) The reduction in the inflation forecast was due to the using of
the trimmed mean CPI forecast as it was more appropriate in the COVID-19 circumstances.
Spark Infrastructure I Investor Presentation I October November 2020 23INFRASTRUCTURE FOR THE FUTURE
VPN 2021-26 REGULATORY PROPOSAL
Final Risk-free Rate and the estimate of inflation is to be updated for the final decision in April 2021
Regulatory
proposal
2016-20
CitiPower
2021-26
CP Draft
2021-26
CP Revised
2016-20
Powercor
2021-26
PC Draft
2021-26
PC Revised
VPN’s revenue profiles submitted in their Revised Proposals
metric Allowance(1) Decision(1) Proposal(1) Allowance(2) Decision(2) Proposal(2) closely align with the AER’s Draft Determination
Capex
($2021)
$854m $570m $635m $2,060m $1,586m $1,849m Standard Control Services Revenue ($m)(1)(2)(5) and RAB ($bn)(4)
Opex $800
$473m $463m $472m $1,317m $1,321m $1,388m
($2021)
$600
WACC 6.11% 4.59% 4.59% 6.11% 4.59% 4.59%
7.58 7.83 8.04
Risk-free $400 6.26 6.48 6.86 7.27
2.48% 0.93% 0.93% 2.48% 0.93% 0.93% 5.72 5.97
Rate 5.27 5.47
$200
Inflation 2.35% 2.37% 2.37% 2.35% 2.37% 2.37%
$-
Gamma 0.4 0.585 0.585 0.4 0.585 0.585 DEC DEC DEC DEC DEC JUN JUN JUN JUN JUN JUN
16 17 18 19 20 21 22 23 24 25 26
CitiPower Revenue Allowance CitiPower Draft Determination CitiPower Revised Proposal
Revenue(3) Powercor Revenue Allowance Powercor Draft Determination Powercor Revised Proposal
$1,484m $1,426m $1,441m $3,205m $3,242m $3,345m
(Nominal) VPN Regulated Asset Base
An expected inflation forecast of 2%(6) in the final decision will provide a positive uplift in revenue
(1) CitiPower, Revised Proposal 2021-2026, 3 Dec 2020 (2) Powercor, Revised Proposal 2021-2026, 3 Dec 2020 (3) Standard Control Services Revenue - ‘Smoothed’ (4) RAB values from RAB roll-forward model (RFM) and
post-tax revenue model (PTRM) submitted with CitiPower and Powercor revised proposals on 3 December 2020 (5) AER: CitiPower and Powercor – Final Decision 2016-2020 updated to $2021 (6) The forecast reflects the new
AER inflation forecast methodology and the short term inflation forecasts in the RBA February Statement on Monetary Policy.
Spark Infrastructure I Investor Presentation I February 2021 24INFRASTRUCTURE FOR THE FUTURE
REGULATORY TIMELINES
Determinations for SA Power Networks and Victoria Power Networks will incorporate lower returns from the AER’s 2018 decisions on the
Rate of Return Instrument (RORI) and tax, but revenue will be certain for the five-year regulatory periods
VNI CPA & HumeLink HumeLink CPA Draft Final Proposal Revised Final
Final Decision PACR Submission Decision Decision due Proposal Decision
Q1 Q3 Q1 Sept April 31 Jan Dec April
PEC CPA Proposal Revised Period Draft Period
Final Decision due proposal due commences Decision Commences
Q2 31 Jan Dec 1 July 30 Sep 1 July
2021 2022 2023 2024 2025
TRANSGRID 2018 to 2023 (MAJOR PROJECTS1,3)
6 month Period TRANSGRID 2023 to 2028 Draft
transition commences Decision
period 1 July 30 Sep
1 Jan2 VICTORIA POWER NETWORKS 2021 to 2026(2)
Proposal Revised
Final due Proposal
Decision
VICTORIA POWER NETWORKS 2026 to 2031 31 Jan Dec
April 30
SA POWER NETWORKS 2025 to 2030
Regulatory processes to support delivery of Major Projects will continue in to 2021
(1) The Regulatory Investment Test Transmission (RIT-T) and contingent project application (CPA) processes are expected to continue throughout 2021 (2) 6 month transition period will occur between 1 January 2021 and 30
June 2021 as a result of the Victorian Government decision to change the regulatory period cycle to a 1 July commencement date. A 5 year regulatory period will commence from 1 July 2021 (3) Revenue will be adjusted in the
current regulatory period to incorporate the AER’s decisions on CPA’s – Dates subject to change.
Spark Infrastructure I Investor Presentation I February 2021 25INFRASTRUCTURE FOR THE FUTURE
REGULATORY REVIEWS
Engage and advocate for outcomes that support returns required while delivering outcomes in the best long-term interests of consumers
Review Objective Implementation
AER Inflation Review Assess performance of inflation forecasting methodology and impact on returns 1 July 2021
Rules to improve financeability of
AEMC Better match the cash flow from regulated revenue with the financing costs of Actionable ISP projects Q2 2021
Actionable ISP projects
AEMC Rules to integrate DER Allow two-way energy flows and charging for export Mid 2021
AEMC Integration of storage in to the NEM Efficient integration of storage in to the National Electricity Market (NEM) Mid 2021
Improve the efficiency and effectiveness of ring fencing arrangements for distribution and transmission
AEMC Ring Fencing review Late 2021
network service providers
Regulatory Framework for stand alone
AEMC Allow customers to benefit from new technology that lowers costs of providing regulated services Late 2021
power systems
Renewable Energy Zones (REZ)
ESB Develop arrangements to support Renewable Energy Zones and interim implementation Late 2021
framework
AEMO Integrated System Plan (ISP) Efficient development of the National Electricity Market July 2022
Sets out approach to estimate rate of return: return on debt, return on equity and value of imputation
AER Rate of Return Instrument (RORI) Dec 2022
credits
AEMC Rules to facilitate system stability Create new markets for synchronous services, reserve markets and ahead markets Prior to 2025
Coordination of Generation and
Better co-ordinate generation and transmission investment to improve the efficiency of dispatch and
AEMC Transmission Investment (COGATI) 2025
location of generators; provide certainty to support new investment and improve planning information
Access and Charging(1)
Develop long-term, fit-for-purpose market framework to enable provision of full range of services to
ESB Post 2025 NEM Design 2025
customers necessary to deliver a secure, reliable and lower emissions electricity system at least-cost
(1) Now incorporated in to the ESB’s post 2025 NEM Design program as Grid Access
Spark Infrastructure I Investor Presentation I February 2021 26INFRASTRUCTURE FOR THE FUTURE STRATEGY AND GROWTH DELIVERING GROWTH FOR THE FUTURE Spark Infrastructure I Investor Presentation I February 2021 27
INFRASTRUCTURE FOR THE FUTURE

STRATEGIC VISION AND PRIORITIES

     OBJECTIVE                                                                                                   BUSINESS MODEL

     Delivering long-term sustainable value through                                                              Value Enhance
                                                                                                                 Managing our portfolio for performance
     yield plus growth from our portfolio of high-                                                               and organic growth through efficient
     quality, long-life essential energy infrastructure                                                          investment

     businesses
                                                                                                                 Value Build
     By building sustainable businesses and harnessing their evolving growth                                     Develop, build, own and operate
     potential we will continue to create long-term value for Securityholders                                    energy infrastructure

                                                                                                                 Value Acquire
                                                                                                                 Growing through disciplined
     ELECTRICITY                     RENEWABLE                 ELECTRICITY   GAS NETWORKS /   WATER NETWORKS /   acquisitions
     NETWORKS                        ENERGY                    STORAGE       GAS STORAGE      WATER STORAGE

Spark Infrastructure I Investor Presentation I February 2021                                                                                              28
INFRASTRUCTURE FOR THE FUTURE
TRANSGRID – GROWTH OPPORTUNITIES (I)
From mid-2020 under the National Electricity Rules there is a requirement to progress the regulatory process and preparatory work for
actionable ISP projects
AEMO ISP 2020 Delivery
TransGrid Network Opportunities
Modelled Cost Target(1)
2018-2023 capex allowance $1.2bn N/A
Committed
QNI Minor (2)$0.2bn 2021-22
Actionable
VNI Minor (3)$0.1bn 2022-23
Project EnergyConnect (PEC) (4)$2.0bn 2024-25
HumeLink (3)$2.1bn 2025-26
Central-West Orana REZ Transmission Link $0.7bn 2024-25
VNI West (Kerang Route)(4) (3)$2.4bn 2027-28
Total $7.3bn
Preparatory Activities Required
2032-33 to
QNI Medium & Large $3.3bn
2035-36
New England REZ Network Expansion (5)$1.3bn 2030s
North West NSW Network Expansion (6)$0.9bn 2030s
Total $5.4bn
Total ISP Modelled Projects $12.9bn NSW Map Source: TransGrid,
Transmission Annual Planning Report 2020
(1) AEMO 2020 ISP (2) Contingent Project Application (CPA) Approved 28 April 2020 (3) RIT-T process underway (4) CPA process commenced 9 October 2020. (5) Includes combined costs for Stage 1 & 2
(6) Includes combined costs for Stage 1,2 & 3
Spark Infrastructure I Investor Presentation I February 2021 29INFRASTRUCTURE FOR THE FUTURE
TRANSGRID – GROWTH OPPORTUNITIES (II)
TransGrid shareholders continue to seek solutions to financeability issues raised with regulators
TransGrid Indicative 5-Year Capex Profile (Proportionate) Project • EPC and other major commercial milestones complete
Subject to Regulatory approvals EnergyConnect
300 (PEC) • Final CPA determination from AER expected Q2 2021
282
• Disappointed in AEMC draft determination on financeability rule
change, final due in Q2 2021
250
VNI West
HumeLink • Ongoing landowner and community consultation
215
QNI Medium
200
• Route being refined with proposed route to be published mid-2021
187
CW REZ
• Regulatory process ongoing
Humelink Central West • Community and landowner consultation has commenced
$m
150
123 REZ
117 PEC • The project is receiving funding from the Australian Renewable
Energy Agency (ARENA) as part of ARENA's Advancing
100 Non-Prescribed Renewables Program
Prescribed • TransGrid is working closely with the NSW Government to plan
50
new transmission infrastructure for the REZ
Non- • Includes Snowy 2.0 connection
Prescribed
- connection • ~12GW potential = > $250m proportionate capex
2021 2022 2023 2024 2025
Equity
pipeline • Further upside from NSW Energy Roadmap
funding(1) $40m $100m $74m $40m $29m
1. Indicative Spark Infrastructure share of equity funding required for ISP projects (ISP funding assumed 40%
• Demonstrated access to excellent financing terms
equity/60% debt). Non-Prescribed and Prescribed growth capex to be funded at TGD level.
Significant growth capital expenditure over the next 5 years on ISP major projects and non-prescribed connection assets
Spark Infrastructure I Investor Presentation I February 2021 30INFRASTRUCTURE FOR THE FUTURE
RENEWABLES – HIGH QUALITY PIPELINE ESTABLISHED
Well positioned to continue disciplined investment
Core Investment Areas Development Pipeline (~1.5GW)
Solar Wind Storage Solar Wind Storage
• >15GW forecast installed • >16GW forecast installed • ~13GW installed capacity
capacity between 2022-2042 in capacity between 2022-2042 in forecast between 2022-2042 in
the NEM(1) the NEM(1) the NEM(1)
Indicative Renewables Investment ~580MW(1)(2)
500
382
400
300
300 262
$m
210
200 164
100
10 -
-
2019 2020 2021 2022 2023 2024 2025
Other Investment Areas under Consideration(3)
Renewable Energy Zones Green Hydrogen Virtual Power Plants
(1) AEMO’s 2020 ISP Central Scenario (DP1)
(2) Based on probability weighted and proportionate final ownership of 100% owned developments
(3) Opportunities either through Investment Businesses or Spark Infrastructure directly
Spark Infrastructure I Investor Presentation I February 2021 31INFRASTRUCTURE FOR THE FUTURE CAPITAL MANAGEMENT P R U D E N T C A P I TA L M A N A G E M E N T W I L L D E L I V E R G R O W T H I N A S S E T B A S E Spark Infrastructure I Investor Presentation I February 2021 32
INFRASTRUCTURE FOR THE FUTURE

CONSISTENTLY PAYING ATTRACTIVE DISTRIBUTIONS
                                                                     The only consistently Top 10 yield performer in ASX 100

                             2016                                         2017                                         2018                                         2019                                           2020
                                          Dividend                                     Dividend                                     Dividend                                        Dividend                                     Dividend
 #       Company                          Yield (%)   Company                          Yield (%)   Company                          Yield (%)   Company                             Yield (%)   Company                          Yield (%)
 1       Crown Resorts Ltd (ASX:CWN)          6.82    Fortescue Group Ltd (ASX:FMG)       10.20    Alumina Ltd (ASX:AWC)               11.00    Alumina Ltd (ASX:AWC)                  11.40    Fortescue Group Ltd (ASX:FMG)        8.54
 2       NAB Ltd (ASX:NAB)                    6.46    Telstra Ltd (ASX:TLS)                8.54    AMP Ltd (ASX:AMP)                   10.00    Yancoal Australia Ltd (ASX:YAL)        11.00    AGL Energy Ltd (ASX:AGL)             8.20
 3       Spark Infrastructure (ASX:SKI)       6.09    NAB Ltd (ASX:NAB)                    6.70    Whitehaven Coal Ltd (ASX:WHC)        9.49    BOQ Ltd (ASX:BOQ)                       8.55    Aurizon Holdings Ltd (ASX:AZJ)       7.03
 4       Platinum (ASX:PTM)                   6.06    Vicinity Centres (ASX:VCX)           6.36    NAB Ltd (ASX:NAB)                    8.23    Harvey Norman Ltd (ASX:HVN)             8.11    BEN Ltd                              6.65
 5       IOOF Holdings Ltd (ASX:IFL)          5.92    Harvey Norman Ltd (ASX:HVN)          6.24    BOQ Ltd (ASX:BOQ)                    7.84    Spark Infrastructure (ASX:SKI)          7.66    Spark Infrastructure (ASX:SKI)       6.16
 6       CSR Ltd (ASX:CSR)                    5.63    Spark Infrastructure (ASX:SKI)       6.08    Stockland (ASX:SGP)                  7.67    BEN Ltd                                 7.16    AusNet Services Ltd (ASX:AST)        5.81
 7       AMP Ltd (ASX:AMP)                    5.56    Westpac Banking (ASX:WBC)            6.00    Westpac Banking (ASX:WBC)            7.51    NAB Ltd (ASX:NAB)                       6.74    Dexus (ASX:DXS)                      5.54
 8       BEN Ltd (ASX:BEN)                    5.35    BOQ Ltd (ASX:BOQ)                    5.97    Spark Infrastructure (ASX:SKI)       7.24    Westpac Banking (ASX:WBC)               6.60    Telstra Ltd (ASX:TLS)                5.37
 9       ANZ Ltd (ASX:ANZ)                    5.26    BEN Ltd                              5.83    Wesfarmers Ltd (ASX:WES)             6.92    ANZ Ltd (ASX:ANZ)                       6.50    APA Group (ASX:APA)                  5.28
 10      ADBRI Ltd (ASX:ABC)                  5.06    Stockland (ASX:SGP)                  5.76    Platinum (ASX:PTM)                   6.58    Vicinity Centres (ASX:VCX)              6.18    Origin Energy Ltd (ASX:ORG)          5.25

                                                                              Dividend yield trend past 5 years - SKI vs ASX100 vs RFR
8%
7%
6%
5%
4%
3%
2%
1%
0%
  2016                                                     2017                                                   2018                                                       2019                                                  2020
                                                                                        Spark Yield             ASX 100 average yield             RFR
Source: Capital IQ
                                                                                                                                                                                                                                       33
INFRASTRUCTURE FOR THE FUTURE
GROWTH PIPELINE - FULLY FUNDED
Indicative Growth Capex Indicative RCAB
(Proportionate p.a. $m) 671 (Proportionate $m)
637 9,214
CAGR 6.6%
504 with Renewables Growth
433 6,703
368 378 CAGR 3.8%
BAU + ISP Growth
241
199
153
121
2016 2017 2018 2019 2020 2021 2022 2023 2024 2025 2020 2025
VPN SAPN TGD Renewables VPN SAPN TGD (RAB) TGD (CAB) Renewables
Indicative Funding
(Proportionate p.a. $m) • RAB growth supported by AEMO’s 2020 ISP + SAPN
regulatory outcome and VPN draft regulatory determination
294 391 • Contracted growth supported by AEMO ISP
70 273 173
80
84
70
70
• Renewable development pipeline established
80 70 70
199 204 161
308 272
211 161 190 • Growth fully funded through DRP and debt capacity
121 153
2016 2017 2018 2019 2020 2021 2022 2023 2024 2025 • Spark Infrastructure committed to investment grade ratings
Asset Level Financing DRP SKI Corporate Debt/Retained cash
(1) SAPN values derived from SA Power Networks Final Determination – differential of annual opening RAB value vs closing RAB value, adjusted for SKI Financial Year
(2) VPN values based on CitiPower and Powercor Regulatory Proposals submitted 31 January 2020 – differential of annual opening RAB value vs closing RAB value, adjusted for SKI Financial Year
(3) Renewables growth equivalent to capex investment of ~580MW (~$1.1bn) in 2021-2025
(4) TransGrid includes investments presented on slide 30
Spark Infrastructure I Investor Presentation I February 2021 34INFRASTRUCTURE FOR THE FUTURE SUSTAINABILITY E N V I R O N M E N TA L , S O C I A L A N D C O R P O R AT E G O V E R N A N C E Spark Infrastructure I Investor Presentation I February 2021 35
INFRASTRUCTURE FOR THE FUTURE

ESSENTIAL ENERGY INFRASTRUCTURE

                                                               Delivering long-term
                                                               sustainable value through
                                                               yield plus growth

                                                               Delivering safe, reliable
                                                               and affordable energy
                                                               services through well
                                                               managed operations and
                                                               efficient investment

                                                               Providing safe and
                                                               rewarding workplaces
                                                               for our people

                                                               Delivering a sustainable
                                                               energy future capturing
                                                               opportunities from
                                                               innovation and technology

                                                               Protecting the
                                                               environment in which we
                                                               operate, and investing in
                                                               the transition to a low
                                                               carbon emissions future

Spark Infrastructure I Investor Presentation I February 2021                               36
INFRASTRUCTURE FOR THE FUTURE
ESG AND SUSTAINABILITY GOALS
KEY ISSUES PRIORITY METRICS OUTCOMES
Renewable
energy generated Innovation and technology
Embedding policies and strategies that drive (from Bomen Solar Farm) UN Sustainable
• Investing in the low carbon transition
Climate Change tangible changes through asset management, Development Goals
network design and procurement Renewable energy • Capturing opportunities from innovation
transported across and technology
Growing and innovating business solutions our networks
Resource
to support and enable energy transition while
Management Environment
reducing waste
Environment Emissions reduction • Addressing our own operational impact
Minimising negative impacts on the metric to ensure clean reliable and affordable
Environmental environment by ensuring the highest standard
Protection energy for every Australian
of management practices are embedded and
Environmental • Transparently disclosing and
compliance standards are maintained
incidents addressing environmental incidents as
part of managing our climate risk
Fostering a safety culture across all investment
Customers and community
Health, Safety Community engagement
companies and integrating systems that support • Investing for the long-term in
and Wellbeing and investment
both employees and contractors sustainable energy infrastructure and
the communities where we operate
Committed to delivering a strong inclusive values-
People based culture that promotes diversity and enables
all employees to thrive and be successful
Diversity
Social Our people, health and safety
Enabling safe, reliable and affordable electricity
Customers and supply to our customers and contributing to the • Providing the right workplace
Community Gender pay ratio
development of our communities by investing in
initiatives that make a lasting positive impact • Promoting women in leadership
Health and safety • Championing health and safety
Financial Maintaining a balanced portfolio where earnings will
Management be supported by growth in the underlying assets of No fraud or material Security holders
the businesses and through sustainable investment breach or non-
in high value unregulated opportunities • Managing our portfolio for performance
compliance with and growth through efficient investment
Corporate Maintaining an effective governance and decision
making structure through representation on the Board policies
Governance for reliable returns
Board and Committees of the portfolio businesses
Governance No antitrust • Embedding responsible business
Ensuring effective identification of material risks or corruption practices and acting with integrity to
Risk
and putting in place an adequate and effective protect shareholder interests
Management
risk management and internal control system
Spark Infrastructure I Investor Presentation I February 2021 37INFRASTRUCTURE FOR THE FUTURE
ESG: SKI GROUP PERFORMANCE (PROPORTIONATE)
2020 2019
Health & Work related fatalities 0 0 ESG Ratings
Safety Lost Time Injury Frequency Rate (LTIFR) 2.3 2.1
Renewable energy capacity 100MW ac 0
Carbon Disclosure Project
85,160 21
CO2-e displaced through renewable generation
tonnes tonnes
Spark Infrastructure received a score
Environment Renewable energy transported / support by Networks(1) 33% 28%
of B in 2020 (up from D in 2019),
demonstrating the business is taking
coordinated action on climate issues
Reportable environmental incident(2) 2 2
Investment in community programs and engagement $1.4m(3) $1.7m
Anti-competitive, anti-trust or monopoly breaches 0 0
Global Real Estate
Social & Fraud, material breaches or non-compliances with Board policies 0 0 Sustainability Benchmark
Governance TransGrid scored 92 out of 100 points
Diversity: Women to Men ratio employed across all levels 21% 20% in 2020 and received a 5-star rating.
Ranking them 21 out of 406
infrastructure assets around the globe
Gender pay gap(4) 1% N/A
1. Based on the weighted average annual energy consumption x the State-based renewable energy (including residential solar)
2. Incidents attributed to SA Power Networks – relating to transformer oil spills that exceed state based regulatory thresholds requiring notification
3. Excludes $550,000 of committed funding in 2020 via the Bomen Solar Farm Community Partnership program (in partnership with Westpac Banking Group) that will be sequentially spent from 2021
4. Based on average female:male pay difference on comparable pay grades (excludes Executives)
Spark Infrastructure I Investor Presentation I February 2021 38INFRASTRUCTURE FOR THE FUTURE CLOSING REMARKS D E L I V E R I N G G R O W T H I N S U S TA I N A B L E A S S E T B A S E W I T H AT T R A C T I V E Y I E L D Spark Infrastructure I Investor Presentation I February 2021 39
INFRASTRUCTURE FOR THE FUTURE

OUTLOOK AND DISTRIBUTIONS
Delivering attractive total return from strong growth and sustainable yield into the future

  Outlook                                • SAPN and VPN regulatory determinations deliver revenue certainty for next 5 years
                                         • Expecting good customer and regulatory support for opex and capex allowances for VPN final determination; based on
                                           SAPN recent outcomes. Small uptick in risk-free rate and improved regulatory inflation forecasting methodology
                                         • Growth agenda for regulated and contracted assets at TransGrid is substantial
                                                   • Supported by AEMO’s 2020 ISP
                                                   • Financeability challenge of current regulatory settings for PEC remain
                                         • Renewable development pipeline established; disciplined approach to ensure high quality accretive growth
                                         • Will retain strongly defensive qualities, e.g. regulated assets to continue to exceed 85% of total assets
                                         • DRP sufficient to fund equity capital requirements for growth pipeline, whilst maintaining investment grade ratings

  Distribution                           • Guidance for FY21 of 12.5cps, subject to business conditions. Distribution estimated to be franked to ~25% (~3.0cps)
  guidance                               • Target to grow distributions by at or around CPI over next 5-years to 2025 (i.e. the end of new SAPN/VPN regulatory
                                           periods)
                                         • Distributions sustainability based on operating cash flows across the period
                                         • DRP to remain in operation, to fund equity commitments for growth pipeline

  Yield and Growth will continue to deliver sustainable value to Securityholders

Spark Infrastructure I Investor Presentation I February 2021                                                                                                      40
INFRASTRUCTURE FOR THE FUTURE APPENDIX Spark Infrastructure I Investor Presentation I February 2021 41
INFRASTRUCTURE FOR THE FUTURE

KEY METRICS
Distributions, RAB, credit metrics and gearing
SECURITY METRICS                                                                                           VICTORIA POWER NETWORKS                    $m
Market price at 19 February 2021                                                            $2.08          RAB(1) (including AMI)                   6,635
Market capitalisation                                                                  $3.6 billion
                                                                                                           Net debt                                 4,799
DISTRIBUTIONS                                                                                              Net debt/RAB                             72.3%
2020 actual                                                                              13.50cps
Comprising:
                                                                                                           SA POWER NETWORKS                          $m
                                                                                                                  (1)
  - Loan Note interest                                                                    7.05cps          RAB                                      4,395
  - Trust Distributions                                                                   6.45cps          Net debt                                 3,247
  - Franking credits                                                                      2.10cps
                                                                                                           Net debt/RAB                             73.9%
2021 Guidance                                                                            12.50cps
  - Franking credits                                                                        ~25%           TRANSGRID                                  $m
                                                                                                           RAB(1)                                   6,697
CREDIT RATINGS                                                                                                    (1)(2)
                                                                                                           CAB                                       820
Investment portfolio credit ratings
                                                                       SA Power Networks: A-                        (1)(2)
                                                                                                           RCAB                                     7,517
                                                                  Victoria Power Networks: A-
                                                                                                                        (3)
                                                                             TransGrid: Baa2               Net debt                                 6,064
Spark Infrastructure level credit rating                                                     Baa1          Net debt/RAB (4)                         89.5%
                                                                                                           Net debt/RCAB                            80.7%
SPARK INFRASTRUCTURE                                                                            $m
Total RAB and CAB (Spark Infrastructure share)                                               6,704
Gross debt at Spark Infrastructure level                                                         40
(1) December 2020 estimate (2) Includes WIP/partially completed assets and investment property
(3) Net Debt is calculated using gross debt less cash and adjusted for prescribed revenue over/(under) collection and includes TransGrid Services
(4) Relates to TransGrid Obligor Group
Spark Infrastructure I Investor Presentation I February 2021                                                                                                42
INFRASTRUCTURE FOR THE FUTURE UNREGULATED REVENUES (100% BASIS) Victoria Power Networks ($m) 2020 2019 Variance Beon Energy Solutions 233.8 239.5 (5.7) Service Level Agreement Revenue 23.3 22.7 0.6 Telecommunications 1.2 1.1 0.1 Joint Use of Poles 5.5 4.1 1.4 Other 11.9 19.1 (7.2) TOTAL 275.7 286.4 (10.7) SA Power Networks ($m) 2020 2019 Variance Energy Infrastructure and Solutions 296.2 268.2 28.0 Facilities Access / Dark Fibre 2.1 1.9 0.2 Asset Rentals 4.0 3.8 0.2 Sale of Salvage 1.0 1.7 (0.7) Other 4.5 6.6 (2.1) TOTAL 307.8 282.2 25.6 TransGrid ($m) 2020 2019 Variance Infrastructure Services 106.2 104.0 2.2 Property Services 4.9 5.0 (0.1) Telecommunication Services 13.1 11.0 2.1 TOTAL 124.2 120.0 4.2 Spark Infrastructure I Investor Presentation I February 2021 43
INFRASTRUCTURE FOR THE FUTURE

SEMI REGULATED REVENUES (100% BASIS)
Victoria Power Networks ($m)                                                                                 2020   2019   Variance
  Public Lighting                                                                                             7.9   11.9       (4.0)
    New Connections                                                                                          16.6   15.1        1.5
    Special Reader Activities                                                                                 4.4    4.6       (0.2)
    Service Truck Activities                                                                                  6.4    5.9        0.5
    Recoverable Works                                                                                         0.8    2.2       (1.4)
    Specification and Design                                                                                 13.5   13.3        0.2
    Other                                                                                                    12.8    7.8        5.0
TOTAL                                                                                                        62.4   60.8        1.6

SA Power Networks ($m)                                                                                       2020   2019   Variance
 Public Lighting                                                                                             11.1   23.5      (12.4)
    Metering Services                                                                                        15.8   15.7        0.1
    Pole/Duct Rental                                                                                          4.8    3.9        0.9
    Other Negotiated Services (1)                                                                            49.7   54.2       (4.5)
    TOTAL(2)                                                                                                 81.4   97.3      (15.9)

(1) Includes Asset Relocation and Embedded Generation
(2) Does not include Alternative Control Services (ACS) revenue, which is reported as part of DUOS revenue

Spark Infrastructure I Investor Presentation I February 2021                                                                           44
INFRASTRUCTURE FOR THE FUTURE
TAXATION UPDATE
• Federal Court confirmed earlier judgment on cash contributions but found in favour of VPN in respect of gifted assets. The effect of the decision is that:
Litigation
- Receipt of Gifted Assets do not give rise to an amount of assessable income (after the offset of any rebate paid by VPN to the customer)
update
- Receipt of Cash Contributions (where assets are built by VPN), treated as assessable income on receipt
• Cash impact to Spark Infrastructure re SAPN is that refund of approx. $45m ($40m primary tax and $5m interest) expected in 2021
• VPN expected to receive $23m tax refund in 2021
• Until full transition to monthly instalments, prior year liability used for current year underlying tax presentation
Effective Tax Rate
• Taxable income expected to peak in respect of 31 December 2020; but will be offset by tax refund
• Taxable income expected to be lower in future years due to the tax profile of the underlying businesses
• Tax payable is impacted by franked/unfranked dividends received from VPN; VPN tax refund and Government’s instant asset write off reduces VPN tax and
franking in short term
• Spark Infrastructure’s effective tax rate (excluding tax refund) for 2021-25 is expected to average ~13% of pre-tax Stand alone Cash Flow
• Spark Infrastructure announced that 2.1c of franking would accompany the March 2021 distribution. Further franking of 2.8c remains to be distributed in respect of
Franking
tax paid to date. Further franking credits to distribute will arise as tax continues to be paid as well as in respect of franked dividends received from VPN
• Distributions estimated to be franked to approximately 25% (of total distribution) through 2025
Underlying Tax
Underlying Tax Paid 2020 (re 2019) $m Underlying Tax Paid 2021 (re 2020) $m
Total Tax Paid per Statutory Cash Flow 85.9 Gross tax liability in relation to 2020 55.6
Less Historical Tax Paid (2015-18) (34.4) Expected Tax Refund (40.0)
Less Tax Instalments Paid in Relation to 2020 (17.7) Underlying Tax Paid 2021 (re 2020) 15.6
Add 2019 Tax Liability Paid in 2019 4.2
Underlying Tax Paid 2020 (re 2019) 37.9
45INFRASTRUCTURE FOR THE FUTURE CONSISTENT SERVICE OUTPERFORMANCE Victoria Power Networks (1) STPIS $m 2017 regulatory year 36 Being recovered in 2019 and 2020 regulatory years 2018 regulatory year 20 To be recovered in 2021 regulatory year 2019 regulatory year 26 To be recovered in 2022 regulatory year 2020 regulatory year(2) 22 To be recovered in 2023 regulatory year SA Power Networks(1) STPIS $m 2016/17 regulatory year 23 Recovered in 2018/19 regulatory year 2017/18 regulatory year 36 Recovered in 2019/20 regulatory year 2018/19 regulatory year 30 Being recovered in 2020/21 regulatory year 2019/20 regulatory year(2) 39 To be recovered in 2021/22 regulatory year TransGrid(1) STPIS $m 2017 calendar year 16 Recovered in 2018/19 regulatory year 2018 calendar year 17 Recovered in 2019/20 regulatory year 2019 calendar year 14 Being recovered in 2020/21 regulatory year 2020 calendar year(2) 6 To be recovered in 2021/22 regulatory year Our investment businesses are delivering high reliability to customers (1) Service Target Performance Incentive Scheme (STPIS) 100% basis (2) Preliminary estimate Spark Infrastructure I Investor Presentation I February 2021 46
INFRASTRUCTURE FOR THE FUTURE

REGULATED PRICE PATH
CPI minus X(1)

                                                CPI (% )                                                                                   CPI (% )
                                                                                          Expected                                                                 Expected
                CitiPower                       Actual             X-Factor               movement                             Powercor     Actual     X-Factor    movement
                                                                                                       (3)                                                                     (3)
                                                                                       in revenue            %                                                    in revenue         %
                                             (Forecast)                                                                                   (Forecast)
                  (2)                                                                                                           (2)
        Year 1                                    2.50                                                                  Year 1               2.50
                                                                         -                       -                                                        -             -
        (1 Jan 16)                               (2.50)                                                                 (1 Jan 16)          (2.50)
        Year 2                                    1.02                                                                  Year 2               1.02
                                                                      0.40                     0.62                                                      4.68         -3.71
        (1 Jan 17)                               (2.35)                                                                 (1 Jan 17)          (2.35)
        Year 3                                    1.93                                                                  Year 3               1.93
                                                                      -0.05                    1.99                                                     -0.81          3.08
        (1 Jan 18)                               (2.35)                                                                 (1 Jan 18)          (2.35)
        Year 4                                    2.08                                                                  Year 4               2.08
                                                                      -0.12                    2.20                                                     -3.02          5.16
        (1 Jan 19)                               (2.35)                                                                 (1 Jan 19)          (2.35)
        Year 5                                    1.59                                                                  Year 5               1.59
                                                                      -1.88                    3.50                                                     -2.40          4.03
        (1 Jan 20)                               (2.35)                                                                 (1 Jan 20)          (2.35)

  • Regulated electricity network revenues are determined by a price path set according to the CPI-X(1) formula. A negative X-factor means
     a real increase in distribution tariffs
  • The regulatory pricing period currently commences from 1 January for Victoria Power Networks (CitiPower and Powercor) but will be
     adjusted to a 1 July from 2021, SA Power Networks and TransGrid are from 1 July each year
  • Whilst CPI-X is the key underlying driver for year on year revenue movements, the revenue movements in reported results include
     adjustments for other factors
(1) Whilst referred to as “CPI-X”, the actual tariff increase formula used by the regulator is: (1+CPI)*(1-x)-1. Source: AER
(2) No CPI-X was applied in 2016. The AER calculated the revenue cap as a dollar amount
(3) Excludes over or under recovery and S factor revenue

Spark Infrastructure I Investor Presentation I February 2021                                                                                                                             47
You can also read