30 JUNE 2021 HALF YEAR RESULTS - TUESDAY, 24 AUGUST 2021 - AFR
←
→
Page content transcription
If your browser does not render page correctly, please read the page content below
30 JUNE 2021
HALF YEAR RESULTS
TUESDAY, 24 AUGUST 2021
INFRASTRUCTURE FOR THE FUTURE

BINDING OFFER FROM KKR, ONTARIO TEACHERS’ AND PSP INVESTMENTS
 •      As announced on 23 August 2021, Spark Infrastructure has entered into a Scheme Implementation Deed (“SID”) with KKR, Ontario Teachers’ and PSP Investments (the “Consortium”)
 •      Under the SID, the Consortium will acquire all of the units in the Spark Infrastructure Trust by means of a Trust Scheme and all of the loan notes issued by Spark RE by means of a
        Creditor’s Scheme (the “Schemes”)
 •      The Binding Offer of $2.95 per stapled security, before adjustment for any distributions paid or payable, values Spark Infrastructure at an equity value of $5.2 billion
 •      After adjusting for the interim distribution payable on 15 September 2021, the total value of $2.8875 represents a 26% premium to the closing price of Spark Infrastructure securities on
        13 July 2021(2) and a 31% premium to the 3 month VWAP up to and including 13 July 2021(2)
 •      If the Schemes are implemented, Spark Infrastructure securityholders will receive a total value of $2.8875 cash per stapled security(cps)(1) excluding franking credits, comprising cash
        consideration of approximately ~$2.7675 per stapled security plus a fully franked special distribution of approximately ~12.0 cents per stapled security (exact amounts to be determined
        closer to the Implementation Date, which is expected to be by the end of 2021)
 •      The special distribution will be franked to the fullest extent possible, which will provide certain Spark Infrastructure securityholders who can utilise the full benefit of franking credits with
        an additional benefit of approximately 5.00 cps
 •      The Spark Infrastructure Board unanimously recommends that Securityholders vote in favour of the Schemes, in the absence of a superior proposal and subject to an independent
        expert concluding (and continuing to conclude) that the Schemes are in the best interests of Securityholders
 •      The Schemes are subject to approval by Spark Infrastructure securityholders at Scheme meetings which are expected to be held by the end of 2021
 •      Should approvals be delayed such that Scheme meetings are not able to be held in 2021, the Consortium will pay additional consideration of 1.0 cps at 15 February 2022 plus additional
        consideration of $0.0003333 per security (i.e. approximately 1 cent per month) for every day thereafter up to Implementation Date

                                                                                                                                               • Approval of Australia’s Foreign Investment Review Board
                                                                                                                                               • The Consortium obtaining foreign merger clearances
                                                                                                                                               • Approval of Spark Infrastructure securityholders
                                                                                                                                               • The independent expert concluding that the Schemes are in the best
                                                                                                                                                 interests of Spark Infrastructure securityholders
     Total value of $2.8875(1)                    Spark Infrastructure has                          Implementation of the                      • Approval of the Creditor’s Scheme by the Court
      per security, increased                    agreed terms of a binding                         Schemes is subject to a
     from the initial proposal                   offer from the Consortium,                          number of conditions                      • No Spark Prescribed Occurrence or Material Adverse Change occurring
     of $2.6375 per security                       following due diligence                               including:                            • Other customary conditions
 1) Value of $2.8875 per security equal to initial offer price of $2.95 less the cash amount of the interim distribution for 2021 of 6.25 cents per security, to be paid on 15 September 2021
 2) Being the date prior to Spark Infrastructure’s securities being placed in trading halt on 14 July 2021 pending Spark Infrastructure’s announcement on 15 July 2021 of the initial proposal received from KKR and Ontario Teachers’
Spark Infrastructure I Investor Presentation I August 2021                                                                                                                                                                               2
INFRASTRUCTURE FOR THE FUTURE
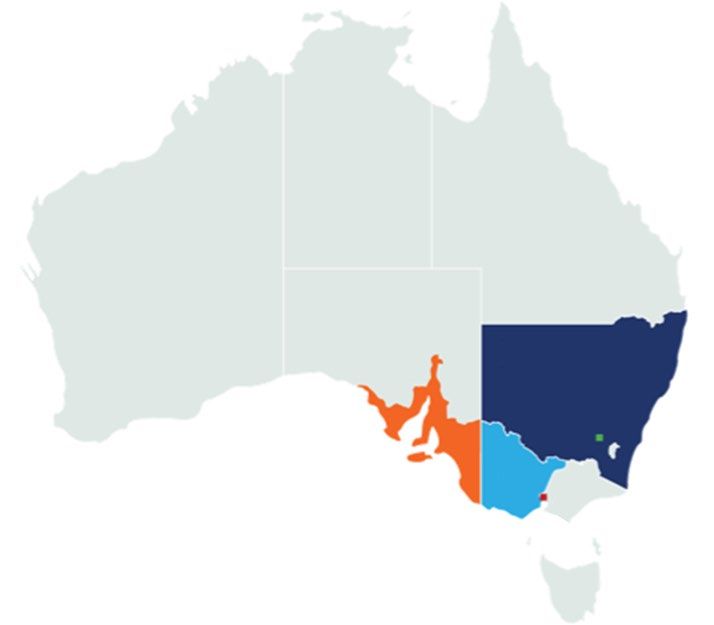
SPARK INFRASTRUCTURE – AT A GLANCE
ASX-listed owner of leading essential energy infrastructure
Renewable Generation Transmission Distribution Retailer Customer
Renewables Transmission Distribution
Spark Renewables TransGrid (NSW) Victoria Power Networks
SA Power Networks
100% 15% 49%
Spark ownership Spark ownership Spark ownership
$0.17bn $8.05bn $11.27bn
Contracted Asset Base Regulated and Regulated Asset Base
Contracted Asset Base BOMEN SOLAR FARM
~2.2GW
Development Portfolio(1)
1) Excludes Bomen Solar Farm (100MW - operational asset) and Dinawan Energy Hub Stage 2 – refer Slide 36 for more details
Spark Infrastructure I Investor Presentation I August 2021 3
INFRASTRUCTURE FOR THE FUTURE

THE FUTURE ENERGY MARKET
The pace of transition in electrification, decarbonisation and customer involvement is accelerating

                                                             • The world is heading for net zero
  The world is electrifying amidst
                                                             • Electrification is the key path to achieving these goals; green hydrogen has a role longer term
  the global push for net zero
                                                             • Australia’s energy landscape is changing – with ageing coal fired generation retiring

                                                             • Scale and efficiency of renewable generation and batteries is increasing
  Technology and Innovation is
                                                             • Customer involvement is increasing – e.g. roof-top solar, batteries, smart appliances, electric vehicles
  accelerating the transition
                                                             • Transmission and Distribution Networks are critical to the energy transition

                                                             • Major investment in transmission to increase interconnection between States and to connect
                                                               decentralised renewables and dispatchable energy sources
                                                             • Distribution: extend role to Distribution System Operator to enable two-way flows and grid stability by
  Opportunities for                                            utilising smart-grid innovation, smart meters, community batteries
  Spark Infrastructure
                                                             • Renewables platform: Energy hub (wind, solar and storage) concept; introduce minority investors in
                                                               platform or specific opportunities; integration of projects with green hydrogen proponents
                                                             • Increased recognition for strong ESG credentials

                                                      Uniquely positioned to play a major role in Australia’s energy transition
                                                Only ASX investment with networks and renewables without legacy fossil fuel assets

Spark Infrastructure I Investor Presentation I August 2021                                                                                                                4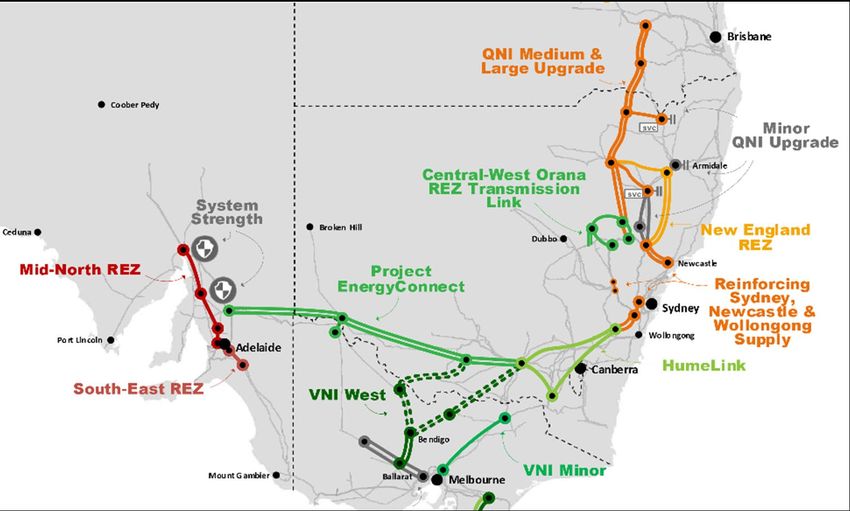
INFRASTRUCTURE FOR THE FUTURE

INVESTMENT CASE
Unique ASX listed business central to delivering the energy transition in Australia

                             Essential energy infrastructure                              Low cost of capital
                             • Super-core infrastructure                                  • Investment grade balance sheets
                             • Scale and Portfolio benefits                               • Predictable yield
                             • Growth in both core and                                    • Long life assets
                               unregulated businesses

              Growing Renewables business                                                              Potential corporate restructure
              • Wholly owned                                                                           • Reduces effective tax rate from 2022
              • Successful track record                                                                • Increases distributable cash flow
              • In-house EPC
              • Exciting pipeline

                   Excellent ESG credentials                                               Highly experienced management and development teams
                   • Supporting the clean energy transition                                • Australia’s best performing distribution businesses
                   • Only listed pure play electricity networks                            • Australia’s largest transmission business at centre of the
                     and renewables player in the region                                     NEM and undergoing significant growth
                   • No legacy fossil fuels

           Rare portfolio of high-quality infrastructure businesses with strong cashflows and once-in-a-generation growth opportunities

Spark Infrastructure I Investor Presentation I August 2021                                                                                                5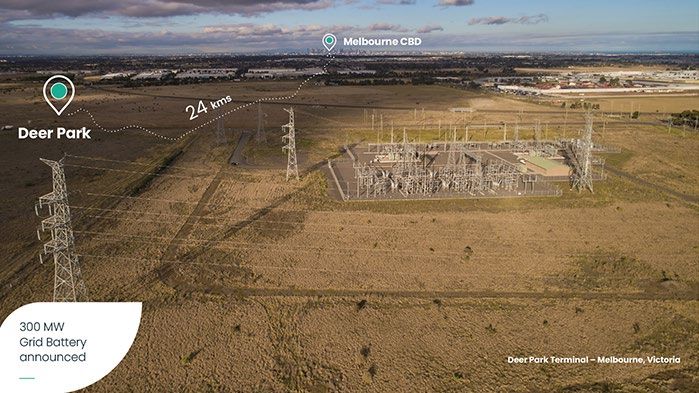
INFRASTRUCTURE FOR THE FUTURE

FINANCIAL HIGHLIGHTS
Solid earnings and growth delivered by high quality energy network businesses

                       Look-through Net
                                                                                           HY2021                                                   Regulated                                        Contracted
                       Operating Cash
                                                                                           Distribution                                             asset base(1)                                    asset base(2)
                       Flow (1)(6)

      $201m                                                                 6.25cps                                                  $6.6bn
                                                                                                                                     Up 4.3%
                                                                                                                                                                                               $299m
                                                                                                                                                                                               Up 8.6%
                                                                              + ~1.5cps franking
         Up 6.6%
                                                                                            FY2021                                                 Growth                                            FFO/
                                                                                            Distribution                                           capital                                           Net debt(5)
                                                                                            guidance (3)                                           expenditure(4)

                                                                            12.5cps                                                   $192.5m                                                  11.7%
                                                                                 + ~3.0cps franking                                   Up 40.6%                                                 Down -1.7%

(1)   On an aggregated proportional basis to Spark Infrastructure
(2)   Includes Bomen Solar Farm and TransGrid CAB on a proportional basis to Spark Infrastructure
(3)   Subject to business conditions and in the absence of a control transaction occurring before 31 December 2021
(4)   Represents increase in RCAB excluding Bomen Solar Farm acquisition and construction costs
(5)   Funds From Operations (FFO)/ Net debt on a look-through proportional basis including underlying Bomen Solar Farm cash flows and Spark Infrastructure corporate, interest and tax costs
(6)   Underlying before tax

Spark Infrastructure I Investor Presentation I August 2021                                                                                                                                                           6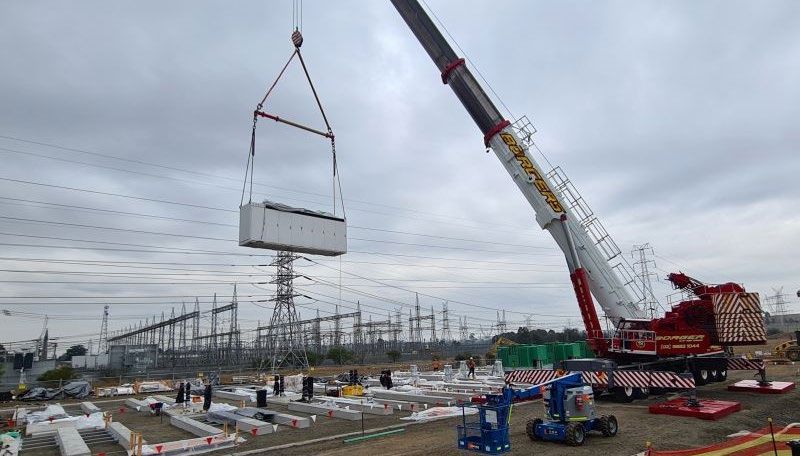
INFRASTRUCTURE FOR THE FUTURE

FINANCIAL PERFORMANCE SUMMARY
Adjusted Proportional Results                                                                         Proportional
                                                                      HY 2021    HY 2020    Change                        2021     2020 Change
(Spark Infrastructure share) ($m)(1)                                                                  Results ($m)
Distribution and transmission revenue                                   475.0      510.4     (6.9%)   EBITDA

Other revenue                                                            83.0       75.3     10.2%    VPN                190.8    213.9    (10.8%)
                                                                                                      SAPN               161.5    177.3     (8.9%)
Total Revenue                                                           558.0      585.7     (4.7%)
                                                                                                      TransGrid           53.2     49.0      8.6%
Operating costs                                                        (164.9)    (157.8)     4.5%
                                                                                                      Proportional
Beon margin                                                               5.6        3.9     43.6%                       405.5    440.2     (7.9%)
                                                                                                      EBITDA
Enerven margin                                                            6.8        8.4    (19.0%)
                                                                                                      Bomen Solar Farm      4.7        -       n/m
EBITDA                                                                  405.5      440.2     (7.9%)
                                                                                                      Corporate Costs     (8.1)    (7.5)    (8.0%)
Net external finance costs                                              (87.5)     (93.6)    (6.5%)   Underlying look-
                                                                                                                         402.1    432.8     (7.1%)
EBTDA                                                                   318.0      346.6     (8.3%)   through EBITDA

Growth Capex(2)                                                         192.5      136.9     40.6%
RCAB (Spark share)(2)                                                   6,729      6,435      4.6%

 Spark Infrastructure share of RCAB(2) has increased by 4.6% over the last 12 months

  (1)   On an aggregated proportional basis to Spark Infrastructure
  (2)   Excludes Bomen Solar Farm

Spark Infrastructure I Investor Presentation I August 2021                                                                                           7
INFRASTRUCTURE FOR THE FUTURE

SUSTAINABILITY PERFORMANCE SUMMARY
Our leading ESG credentials help attract the best talent and the broadest access to low cost capital
                                            Priority Metrics                                                                                     1H21                FY20      FY19
                                                                                                                                                                                         UN Sustainable
                                             Renewable energy capacity                                                                        100MW ac              100MW ac     0     Development Goals

                                             CO2-e displaced through renewable generation (tonnes)                                              68,008               85,160     21

                                             Renewable energy transported / support by Networks(1)                                                N/A                 33%      28%
         Environment
                                             Reportable environmental incident(2)                                                                   0                  2         2

                                             Work related fatalities                                                                                0                  0         0

                                             Lost Time Injury Frequency Rate (LTIFR)                                                             2.3 (3)              2.3       2.1

                                             Investment in community programs and engagement (4)                                                $1.3m                $1.4m     $1.7m

              Social                         Diversity: Women to Men ratio employed across all levels                                             21%                 21%      20%

                                             Gender pay gap(5)                                                                                    N/A                 1%        N/A

                                             Anti-competitive, anti-trust or monopoly breaches                                                      0                  0        0

                                             Fraud, material breaches or non-compliances with Board policies                                        0                  0         0
         Governance

1.  Based on the weighted average annual energy consumption x the State based renewable energy (including residential solar). Calculated Annually.
2.  Previous incidents attributed to SA Power Networks – relating to transformer oil spills that exceed state based regulatory thresholds requiring notification.
3.  LTIFR calculation excludes contractors for SA Power Networks and Bomen Solar Farm.
4.  Refers to actual investments made, excluding future commitments that have not yet transpired.
5.  Based on average female:male pay difference on comparable pay grades (excludes Executives). Calculated Annually.
Spark Infrastructure I Investor Presentation I August 2021                                                                                                                                                 8
INFRASTRUCTURE FOR THE FUTURE

FINANCIAL RESULTS
HALF YEAR 2021

Spark Infrastructure I Investor Presentation I August 2021   9
INFRASTRUCTURE FOR THE FUTURE

STANDALONE NET OPERATING CASH FLOW
Net Operating Cash Flow ($m)                                                                        HY 2021               HY 2020                Change          • Distributions from Victoria Power Networks
                                                                                                                                                                   decreased due to lower regulatory returns
Investment Portfolio Distributions                                                                                                                                 across the 6 month transition period 1 January
                                                                                                                                                                   2021 to 30 June 2021
Victoria Power Networks                                                                                   68.6                  78.4              (12.5%)
                                                                                                                                                                 • Distributions from SA Power Networks
SA Power Networks                                                                                         34.3                  46.8              (26.7%)
                                                                                                                                                                   decreased reflecting the impact of its current
TransGrid                                                                                                  6.8                  11.6              (41.4%)          regulatory period that commenced on 1 July
Total Investment Portfolio Distributions                                                                109.7                 136.8               (19.8%)          2020 set at the new lower rate of return
Net operating cashflows – Bomen Solar Farm                                                                 5.3                  (0.4)                  n/m       • Distributions from TransGrid decreased due to
                                                                                                                                                                   the retention of a portion of operating cash for
Net interest (paid)/received                                                                             (1.5)                   0.4                   n/m
                                                                                                                                                                   significant capital expenditure growth related
Corporate expenses                                                                                       (8.1)                  (7.5)                8.0%          to major ISP projects and other regulated
Underlying Net Standalone OCF before tax                                                                105.5                 129.3               (18.4%)          projects
Underlying tax paid       (1)
                                                                                                        (27.4)                (19.0)               44.2%         • Bomen Solar Farm has performed well in H1
                                                                                                                                                                   2021 equating to a net operating cash
Underlying Net Standalone OCF after tax                                                                   78.1                110.3               (29.2%)
                                                                                                                                                                   contribution of $5.3m
Project and transaction bid costs                                                                        (1.5)                  (3.3)             (54.5%)
Other interest paid(3)                                                                                        -                 (6.7)                  n/m
Other tax paid(2)                                                                                       (25.0)                (55.3)              (54.8%)
Standalone Net OCF                                                                                        51.6                  45.0               14.7%

  Cumulative underlying payout ratio for the last 4½ years (2017 – HY2021) is 99% (after tax payments)

(1) 2021 tax paid of $27.4m represents half of the total $54.8m tax liability in respect of the 31 December 2020 income tax year. 2020 tax paid of $19.0m represents half of the $37.9m tax liability in respect of the 31 December
2019 income tax year (2) Other tax paid of $25.0m relates to tax paid in relation to 31 December 2021 and 31 December 2020 tax years. 2020 other tax paid represents $55.3m of tax paid in relation to a number of historical tax
years (2015-2020). (3) Other interest paid includes an interest charge of $6.7m in 2020 on historical tax payments made (related to the ATO litigation) of which $5.0m is expected to be refunded in the second half of FY2021.

Spark Infrastructure I Investor Presentation I August 2021                                                                                                                                                                        10
INFRASTRUCTURE FOR THE FUTURE
UNDERLYING LOOK-THROUGH CASH FLOW SUMMARY
Victoria
SA Power Spark
Spark Infrastructure share ($m) Power TransGrid HY 2021 HY 2020 Change
Networks Infrastructure
Networks
EBITDA from operations 190.8 161.5 53.2 4.7 410.2 440.2 (6.8%)
less corporate costs - - - (8.1) (8.1) (7.5) 8.0%
Look-through EBITDA 190.8 161.5 53.2 (3.4) 402.1 432.8 (7.1%)
less net finance charges (40.0) (31.3) (16.6) (1.5) (89.3) (88.4) 1.0%
less net reg depreciation/maint. capex(1) (43.8) (67.8) (17.5) - (129.1) (138.0) (6.4%)
Working capital/non cash movements 15.1 3.8 (1.8) 0.6 17.6 (17.5) n/a
Underlying net operating cash flows before tax 122.0 66.1 17.2 (4.4) 201.2 188.8 6.6%
less underlying tax paid(2)(3) - - - (27.4) (27.4) (19.0) 44.2%
Underlying net operating cash flows after tax 122.0 66.1 17.2 (31.8) 173.8 169.8 2.4%
Underlying net LTOCF per Security 9.9 cps 9.9 cps -
Distributions paid (4) 109.7 120.5
Growth capex(5)(6) (121.7) (7.2) (63.5) - (192.5) (136.9) 40.6%
Bomen Solar Farm acquisiton and construction costs - - - 0.8 0.8 (7.1) n/a
Other(6) 4.2 (3.5) 17.1 (0.1) 17.8 (4.4) n/a
Investing cash flows (117.5) (10.7) (46.4) 0.7 (173.9) (148.4) 17.2%
Underlying net operating cash flows before tax increased by 6.6%; Growth capex up 40.6% to $192.5m
1) Net reg depreciation is a proxy for maintenance capex. It is calculated as regulatory depreciation net of CPI uplift on RAB.
2) Spark Infrastructure corporate tax paid of $27.4m in 2021 represents half of the 2020 tax liability for the SIH1 and SIH2 tax groups. 2020 tax paid of $19.0m represents half of the 2019 tax liability for SIH2 tax group.
Excludes other tax paid of $25.0m in 2021 ($55.3m in 2020).
3) VPN and SAPN cash tax paid of $2.7m and $4.0m respectively and the benefit of franking credits will be distributed to Spark Infrastructure in future years.
4) Total HY2021 and HY2020 distributions are based on interim distributions paid/payable.
5) Represents net increase in RCAB.
6) Other adjustment for TransGrid primarily relates to capex previously incurred in relation to major ISP and other regulated projects following CPA approval by the AER which has now been included in the RAB.
Spark Infrastructure I Investor Presentation I August 2021 11INFRASTRUCTURE FOR THE FUTURE OUR INVESTMENTS’ FINANCIAL RESULTS HALF YEAR 2021 Spark Infrastructure I Investor Presentation I August 2021 12
INFRASTRUCTURE FOR THE FUTURE

VICTORIA POWER NETWORKS
Financial ($m)(1)                                                                  HY 2021               HY 2020                Change          Connections
                                                                                                                                                Growth(2)                 18.3%
Regulated revenue - DUOS                                                                434.3                 494.7

                                                                                                                                                                          0.6%
Prescribed metering ("AMI")                                                               39.6                  40.4
                                                                                                                                                Consumption
Semi-regulated revenue                                                                    31.6                  30.1                            Growth (4)
Unregulated revenue                                                                       19.0                  19.7
Total Revenue
Operating costs
                                                                                        524.5
                                                                                      (146.6)
                                                                                                              584.9
                                                                                                            (156.2)
                                                                                                                                 (10.3%)        FTE
                                                                                                                                                Change(4)                 -1.2%
Beon margin                                                                               11.5                    7.9
EBITDA                                                                                  389.4                 436.6              (10.8%)        Net Debt /
                                                                                                                                                RAB                       71.9%
Other
Net finance costs(3)                                                                    (80.0)                (85.7)
Net capital expenditure                                                                 323.4                 311.5
                                                                                                                                                FFO /
                                                                                                                                                Net Debt                  13.0%
Distributions received by Spark Infrastructure                                            68.6                  78.4             (12.5%)

  VPN revenue decreased 10.3% reflecting reduction in regulated return from 5.8% to 4.6% during regulatory transition period
(1) 100% basis (2) For the 6 months to 30 June 2021 compared with the same period in 2020 (3) HY2021 includes a $1.8m gain in non-cash credit valuation hedge adjustments (HY2020: $3.1m loss) (4) Compared with HY2020

Spark Infrastructure I Investor Presentation I August 2021                                                                                                                                                          13
INFRASTRUCTURE FOR THE FUTURE
VICTORIA POWER NETWORKS
Key Financial Drivers
Regulated Revenue • In October 2020, the AER released a final decision to extend Citipower's and Powercor's electricity distribution determinations for the
Down by 12.2% 2016-20 regulatory control period for an additional six month transition period. The reduction in revenue was primarily due to the following:
• Reduction in the regulated rate of return from 5.79% to 4.63%
• Exclusion of incentive scheme revenue from the January - June 2021 transitional revenue period
Regulated Asset Base • RAB increased to $6,858m
Up by 5.2%(2) • Increase driven by net capex of $621m, less regulatory depreciation of $386m, and CPI uplift of $130m
Other Revenue • Semi-regulated revenue: up 5.0% – increased new connections revenue driven by residential growth in the Powercor Network
(excl. Beon) • AMI revenue: down 2.0% – depreciating RAB
In line
• Unregulated revenue: down 3.6% – decrease in service level agreement revenue
Operating Costs • Timing of vegetation management costs and a reduction in staff costs; partially offset by:
(excl. Beon)
Down by 6.1% • GSL provisions and higher insurance costs
Beon Margin • Continued growth in new solar projects such as Sebastopol, Metz, Jemalong and Melbourne Airport Solar Projects
Up by 45.6%
Net Capital Expenditure • Growth capex of $213.8m up 3.7% (network connections and augmentation) – continuation of REFCL(1) program and IT Infrastructure
Up by 3.8% • Maintenance capex of $109.6m up 3.9% – zone substation replacement projects
Victoria Power Networks RAB has increased 5.2% over the last 12 months
(1) Rapid Earth Fault Current Limiter (2) From 30 June 2020
Spark Infrastructure I Investor Presentation I August 2021 14INFRASTRUCTURE FOR THE FUTURE
VPN HISTORICAL OUTPERFORMANCE
Operating expenditure eligible for EBSS ($m 2021) Capital expenditure eligible for CESS ($m 2021)
2016-2020 2016-2020
Allowance Allowance after deferrals
PAL 1,277.9 PAL 2,027.3
CP 463.4 CP 863.7
Total 1,741.3 Total 2,891.0
Actual Actual
PAL 1,150.4 PAL 1,799.1
CP 398.8 CP 593.5
Total 1,549.2 Total 2,392.6
Out/(under) performance 11.0% Out/(under) performance 17.2%
STPIS(1) (100% basis) F-Factor
Regulatory year STPIS ($m) Commentary Year recovered F-Factor ($m)
2017 36 Recovered in 2019 regulatory year 2017 1.8
2018 20 Recovered in 2020 regulatory year 2018 1.9
2019 26 To be recovered in FY2021/22 regulatory year 2019 4.6
2020 22 To be recovered in FY2022/23 regulatory year (estimate) 2020 1.0
To be recovered in FY2022/23 regulatory year (prelim
HY2021 21 FY2022 3.8
estimate)
(1) Service Target Performance Incentive Scheme (STPIS) 100% basis
Spark Infrastructure I Investor Presentation I August 2021 15INFRASTRUCTURE FOR THE FUTURE
SA POWER NETWORKS
Financial ($m)(1) HY 2021 HY 2020 Change STPIS(3) $13.7m
Regulated revenue – DUOS 410.4 430.0
Semi-regulated revenue 48.5 40.6
Customer
Growth(4) 0.4%
Unregulated revenue 8.8 4.8
Total Revenue 467.7 475.4 (1.6%) Consumption
(4) -0.03%
Operating costs (152.2) (130.9)
Enerven margin 13.8 17.1 FTE
Change(4) 2.4%
EBITDA 329.3 361.6 (8.9%)
Other
Net finance costs (2)
(63.7) (72.2)
Net Debt /
RAB 72.7%
Net capital expenditure
Distributions received by Spark Infrastructure
161.3
34.3
177.1
46.8 (26.7%)
FFO /
Net Debt 16.1%
SAPN revenue decreased 1.6% reflecting reduction in regulated return from 6.17% to 4.75% under the new regulatory determination
(1) 100% basis (2) HY2021 includes a $0.9m gain in non-cash credit valuation hedge adjustments (HY2020: includes a $4.1m loss) (3) 2018/19 STPIS result to be recovered from 1 July 2020 (4) Compared to HY 2020
Spark Infrastructure I Investor Presentation I August 2021 16INFRASTRUCTURE FOR THE FUTURE
SA POWER NETWORKS
Key Financial Drivers
Regulated Revenue • CPI of 1.84% from 1 July 2020 (1 July 2019: CPI 1.78%)
Down by 4.6% • X-factor applicable from 1 July 2019 was -0.85% representing a real increase in revenue before CPI. No X-factor was applied for
2020/21 because the AER set the 2020/21 expected revenue in the Final Determination
• Reduction in the regulated rate of return from 6.17% to 4.75%(3)
• $13.7m STPIS recovery
Regulated Asset Base • RAB increased to $4,410m
Up by 0.9%(2) • Increase driven by net capex of $335m(1), less regulatory depreciation of $329m, and includes CPI uplift of $38m
Other Revenue • Semi-regulated revenue: up 19.5% - council funded replacement of public lighting and increased asset relocation and metering works
(excl. Enerven) • Unregulated revenue down $4.0m due to fire insurance recoveries and timing of diesel fuel rebates
Up by 26.2%
Operating Costs (excl. • Increased public lighting and asset relocation works in line with the increase in semi-regulated revenue (above)
Enerven) • Bushfire provisions (including write back of $4.5m in HY2020)
Up by 16.3% • Increased labour costs
Enerven Margin • Due to the winding down of the $300m SA Water project and delays in prospective renewables projects awaiting the completion of the
Down by 19.3% NSW-SA Interconnector.
• Enerven continues to look at expanding nationally whilst maintaining solid cost control.
Net Capital Expenditure • Growth capex of $58.2m, down 6.7% - network connections and augmentation
Down by 8.9% • Maintenance capex of $103.1m, down 10.1%
SA Power Networks has seen RAB growth of 0.9% over the last 12 months
(1) Excludes corporate overheads (2) Includes public lighting RAB (3) Per AER Final Regulatory Determinations
Spark Infrastructure I Investor Presentation I August 2021 17INFRASTRUCTURE FOR THE FUTURE
SAPN HISTORICAL OUTPERFORMANCE
EBSS CESS
Operating Expenditure ($m) 2016-2020 Capital Expenditure ($m) 2016-2020
Allowance 1,356.5 Allowance 1,960.1
Actual 1,297.1 Actual 1,650.0
59.4 310.1
Out/(under) performance 4.4% Out/(under) performance 15.8%
STPIS(1) (100% basis) Enerven revenue by year and major segment
Regulatory year STPIS ($m) Commentary
A$m 322
297
2016/17 23 Being recovered in 2018/19 regulatory year 300
250 215 116 144
2017/18 36 To be recovered in 2019/20 regulatory year 200 172 171 47
134 147 148
150 130 131 123 127
100 100 42 75 52 46
2018/19 30 To be recovered in 2020/21 regulatory year 67 50 51
100
50
2019/20 39 To be recovered in 2021/22 regulatory year
0
2006 2007 2008 2009 2010 2011 2012 2013 2014 2015 2016 2017 2018 2019 2020
2020/21(2) 16 To be recovered in 2022/23 regulatory year (prelim estimate)
Transmission Construction Transmission Maintenance Other
Regulated Work Major Project / Mining Telecommunications
(1) Service Target Performance Incentive Scheme (STPIS) 100% basis Renewables Approved Plan
(2) Preliminary estimate
Spark Infrastructure I Investor Presentation I August 2021 18INFRASTRUCTURE FOR THE FUTURE
TRANSGRID
Financial ($m) (1) HY 2021 HY 2020 Change CPI-X(2) $8.0m
Regulated revenue 406.8 381.5
Unregulated revenue 71.2 63.0
STPIS(3) $7.0m
Other Revenue(8) 0.2 (3.8)
Total Revenue 478.2 440.7 8.5%
RAB(4)
Growth 9.1%
Regulated operating costs (82.1) (81.3)
Unregulated operating and other costs (41.4) (32.8)
CAB(4)(5)
Growth 18.5%
EBITDA 354.7 326.6 8.6%
Other
FTE
Change(4) 8.7%
Net finance costs (113.8) (108.2)
Regulated capital expenditure 506.7 204.6
Net Debt /
RCAB(5)(6) 76.9%
Contracted capital expenditure 57.4 105.7
Distributions received by Spark Infrastructure 6.8 11.6 (41.4%)
FFO /
Net Debt(7) 7.4%
TransGrid revenue Increased 8.5% reflecting strong growth in RCAB of 10.0%
(1) 100% basis (2) Relates to period 1 January 2021 to 30 June 2021 (3) 2019 STPIS recovered from 1 July 2020 (4) Compared with 30 June 2020 (5) CAB comprises of unregulated infrastructure and telecommunication assets
and investment property (6) Net Debt is calculated using gross debt less cash and adjusted for prescribed revenue over/(under) collection and includes TransGrid Services (TGS) (7) Relates to TransGrid Obligor Group (i.e.
excludes TGS) (8) HY2020 amount of ($3.8m) relates to revaluation of investment property.
Spark Infrastructure I Investor Presentation I August 2021 19INFRASTRUCTURE FOR THE FUTURE
TRANSGRID
Key Financial Drivers – Regulated Business
Regulated Revenue • CPI of 1.80% from 1 July 2020 (1 July 2019: CPI of 1.80%)
Up by 6.6% • X-factor from 1 July 2020 was -0.17% and from 1 July 2019 was -0.97% representing a real increase in revenues before CPI
• $7.0m STPIS payment
Regulated Asset Base • RAB increased to $7,186m
Up by 9.1% • Increase driven by capital expenditure of $746m, less regulatory depreciation of $290m, and includes CPI uplift of $63m
Operating Costs • Higher maintenance costs and additional costs associated with the revenue reset proposal partially offset by lower bushfire remediation
Up by 1.0%
costs incurred in HY2020 as a result of damage sustained during the November and December 2019 bushfires
Capital Expenditure • Growth/Augmentation capex(1) of $396.1m (up 363.3%)
Up by 147.7%
• Maintenance capex of $91.4m (down 3.7%)
• Non-network(2) capex of $19.2m (down 20.3%)
• Increase was mainly due to investment in augmentation projects including Project EnergyConnect, Powering Sydney's Future and ISP
projects.
TransGrid has seen RAB growth of 9.1% over the last 12 months
(1) Includes Integrated System Plan (ISP) projects
(2) Includes Network Capability Incentive Project Action Plan (NCIPAP) capex
Spark Infrastructure I Investor Presentation I August 2021 20INFRASTRUCTURE FOR THE FUTURE
TRANSGRID
Key Financial Drivers – Unregulated Business
Contracted Capital • Infrastructure capex includes several projects delivered in HY2021 (Wallgrove Battery and Snowy Hydro Network augmentation)
Expenditure
Down by $48.3m
Unregulated Revenue • Infrastructure connection revenue of $40.3m (HY2020: $44.3m). Connections revenue is expected to continue to grow with a number of
Up by $8.2m new connections projects currently under construction and in the pipeline
• Increase in line modification revenue to $9.2m (HY2020: $4.4m)
• Increase in telecommunications revenue as a result of growth in data services and co-location facilities
Unregulated Operating • Mainly due to infrastructure connections and additional project development costs supporting the acceleration of TransGrid’s rapidly
Costs expanding non prescribed connections pipeline, which is delivering increased contracted revenue growth (i.e. pre-contract / proposal
Up by $8.6m costs)
Contracted Asset Base • CAB increased to $863m
Up by $135.0m(1)
• Increase driven by capex of $161.5m less depreciation of $29m and revaluation increment on investment property $2.5m
TransGrid has seen CAB growth of 18.5% over the last 12 months
(1) From 30 June 2020
Spark Infrastructure I Investor Presentation I August 2021 21INFRASTRUCTURE FOR THE FUTURE
TRANSGRID HISTORICAL OUTPERFORMANCE
STPIS(1) (100% basis) TGD Contracted Asset Base (CAB)
1000
Regulatory year STPIS ($m) Commentary
750
2017 16 Being recovered in 2018/19 regulatory year
500
2018 17 To be recovered in 2019/20 regulatory year 820 863
637
250 431
2019 14 To be recovered in 2020/21 regulatory year 355
0
2020 8 To be recovered in 2021/22 regulatory year (prelim estimate) 2017 2018 2019 2020 HY2021
$m Total Non-Prescribed Revenue $m Infrastructure Connections Revenue $m Total Non-Prescribed Margin
160 90 80
140 80 70
120 70 60
60
100 50
50
80 40 77
150 40 81 72
60 120 124 30 62
30
40 47 51 20
67 71 20 40 37 35
32
20 10 10
0 0 0
2017 2018 2019 2020 HY2021 2017 2018 2019 2020 HY2021 2017 2018 2019 2020 HY2021
(1) Service Target Performance Incentive Scheme (STPIS) 100% basis
Spark Infrastructure I Investor Presentation I August 2021 22INFRASTRUCTURE FOR THE FUTURE
BOMEN SOLAR FARM
Revenue • The revenues were underpinned by the fixed
Underlying Financial Results ($m) HY2021 $6.3m for the first 6 months revenues associated with the PPA agreements
of operations with Westpac and Flow Power.
PPA Fixed Revenue 5.0
• Continued strong pricing in the Large-scale
Merchant Electricity Revenue 0.1 Generation Certificate’s (LGC) market delivered
$0.3m of revenue during the period.
Merchant LGC Revenue 0.3
Operating costs • Operating expenditure was in line with
Other Revenue 0.9 $1.6m expectations with marginal variances relating to
FCAS charges. The implementation of self-
Total Revenue 6.3
forecasting and auto-bidding solutions has
Operating Expenses (1.6) improved this significantly.
EBITDA 4.7 Generation • The site generated 83,960 MWh of renewable
83,960 MWh energy during the period, with no material
Working capital 0.6 curtailment or scheduled outages however
production was impacted by a 3 week outage in
Net operating cash flows 5.3 January due to a substation fault which has since
been rectified.
Other CO2-e displaced(1) • The renewable energy generated from Bomen
68,008 tonnes Solar Farm in the period represented the
Generation (MWh) 83,960 displacement of 68,008 tonnes of CO2-e.
Bomen Solar Farm revenues remained in line with expectations despite an outage in January impacting generation.
(1) Australian Government, Department of Industry, Science, Energy and Resources – National Greenhouse Accounts Factors, October 2020.
Spark Infrastructure I Investor Presentation I August 2021 23INFRASTRUCTURE FOR THE FUTURE EFFICIENCY AND REGULATION I N D U S T R Y A N D B U S I N E S S C O N S I D E R AT I O N S Spark Infrastructure I Investor Presentation I August 2021 24
INFRASTRUCTURE FOR THE FUTURE

HIGH PERFORMING NETWORK BUSINESSES
AER Benchmarking Report 2020 – Multilateral Total Factor Productivity (MTFP)1 Rankings

  Distribution Network Service Providers                                                                     Transmission Network Service Providers

   DNSP                                                      2019             Δ            2018               TNSP                                  2019              Δ            2018

   SA Power Networks                 South Australia           1               -             1                TasNetworks                              1              -              1
   CitiPower                         Victoria                  2               -             2                ElectraNet                               2              -              2
   Powercor                          Victoria                  3              ↑              4                TransGrid                                3              ↑              4
   United Energy                     Victoria                  4              ↑              5                Powerlink                                4              ↑              5
   Ergon Energy                      Queensland                5              ↓              3                AusNet                                   5              ↓              3
   Energex                           Queensland                6              ↑              7              • CitiPower and Powercor (together
   Endeavour Energy                  NSW                       7              ↑              8                Victoria Power Networks) and SA
   Essential Energy                  NSW                       8              ↓              6                Power Networks have remained in
   TasNetworks                       Tasmania                  9              ↑             10
                                                                                                              top 4 DNSPs since reporting began in
                                                                                                              2006
   Jemena                            Victoria                  10             ↓              9
   AusNet                            Victoria                  11              -            11              • TransGrid achieved the highest
   Evo Energy                        ACT                       12              -            12                productivity gains across TNSPs in
                                                                                                              2018 and improved its rank from 4th
   Ausgrid                           NSW                       13              -            13
                                                                                                              to 3rd in 2019

                           Continuing to deliver high productivity performances to provide benefits to customers and improve returns
(1) The multilateral total factor productivity is a productivity index numbers (PIN) technique that measures the relationship between total output and total input. It allows both total productivity levels and growth rates to be compared
between entities (networks). In the 2020 annual benchmarking report, the AER also apply the method to time-series TFP analysis at the industry level and for individual TNSP to better capture large Energy Not Supplied (ENS) changes.

Spark Infrastructure I Investor Presentation I August 2021                                                                                                                                                                                25
INFRASTRUCTURE FOR THE FUTURE
REGULATORY TIMELINES
VNI CPA & HumeLink HumeLink CPA Draft Final Proposal Revised Period
Final Decision PACR Submission Decision Decision due Proposal Commences
13 April 29 July Q1 Sept April 31 Jan Dec 1 July
PEC CPA Proposal Revised Period Draft Final
Final Decision due proposal due commences Decision Decision
31 May 31 Jan Dec 1 July 30 Sep April
2021 2022 2023 2024 2025
TRANSGRID 2018 to 2023 (MAJOR PROJECTS1,3)
6 month Period TRANSGRID 2023 to 2028 Draft
transition commences Decision
period 1 July 30 Sep
1 Jan2 VICTORIA POWER NETWORKS 2021 to 2026(2)
Proposal Revised
Final due Proposal
Decision
VICTORIA POWER NETWORKS 2026 to 2031 31 Jan Dec
April 30
SA POWER NETWORKS 2025 to 2030
Regulatory processes to support delivery of Major Projects will continue in 2021
(1) The Regulatory Investment Test Transmission (RIT-T) and contingent project application (CPA) processes are expected to continue throughout 2021 (2) 6 month transition period occurred between 1 January 2021 and 30
June 2021 as a result of the Victorian Government decision to change the regulatory period cycle to a 1 July commencement date. A 5 year regulatory period commenced from 1 July 2021 (3) Revenue will be adjusted in the
current regulatory period to incorporate the AER’s decisions on CPA’s – Dates subject to change.
Spark Infrastructure I Investor Presentation I August 2021 26INFRASTRUCTURE FOR THE FUTURE
REGULATORY REVIEWS
Engage and advocate for outcomes that support returns required while delivering outcomes in the best long-term interests of consumers
Review Objective Implementation
AER Inflation Review Assess performance of inflation forecasting methodology and impact on returns 1 July 2021
Rules to improve financeability of
AEMC Better match the cash flow from regulated revenue with the financing costs of Actionable ISP projects Not implemented
Actionable ISP projects
AEMC Dedicated connection assets Make it easier for generators to share transmission assets whilst retaining individual connection points. July 2021
AEMC Rules to integrate DER Allow two-way energy flows and charging for export Late 2021
Regulatory Framework for stand
AEMC Allow customers to benefit from new technology that lowers costs of providing regulated services Late 2021
alone power systems
Renewable Energy Zones (REZ)
ESB Develop arrangements to support Renewable Energy Zones and interim implementation Late 2021
framework
Transmission Planning and A review of issues under the regulatory framework that may affect the timely and efficient delivery of major transmission
AEMC 2022
Investment Review projects.
Improve the efficiency and effectiveness of ring fencing arrangements for distribution and transmission network service 2022 Distribution
AER Ring Fencing review
providers 2023 Transmission
AEMC Integration of storage in to the NEM Efficient integration of storage in to the National Electricity Market (NEM) April 2023
NSW Establish renewable energy zones and support investment, connection and access to REZs to deliver required transfer
Electricity Infrastructure Roadmap 2022
Government capacity and renewable generation resources that support jobs, economic growth and reach net zero emissions by 2050.
AEMO Integrated System Plan (ISP) Efficient development of the National Electricity Market July 2022
AER Rate of Return Instrument (RORI) Sets out approach to estimate rate of return: return on debt, return on equity and value of imputation credits Dec 2022
With support from the AEMC, support system strength and create new markets for synchronous services, reserve markets
ESB (and and ahead markets; optimise the integration of DER and two sided markets; ensure adequate reserve capacity and manage
Post 2025 NEM Design 2025
AEMC) the exit of thermal generation; better co-ordinate generation and transmission investment and provide certainty to support
new investment and improve planning information.
Spark Infrastructure I Investor Presentation I August 2021 27INFRASTRUCTURE FOR THE FUTURE STRATEGY AND GROWTH DELIVERING GROWTH FOR THE FUTURE Spark Infrastructure I Investor Presentation I August 2021 28
INFRASTRUCTURE FOR THE FUTURE

STRATEGIC VISION AND PRIORITIES

     OBJECTIVE                                                                                                 BUSINESS MODEL

     Delivering long-term sustainable value through                                                            Value Enhance
     yield plus growth from our portfolio of high-                                                             Managing our portfolio for performance
                                                                                                               and organic growth through efficient
     quality, long-life essential energy infrastructure                                                        investment

     businesses
                                                                                                               Value Build
     By building sustainable businesses and harnessing their evolving growth                                   Develop, build, own and operate
     potential we will continue to create long-term value for Securityholders                                  energy infrastructure

                                                                                                               Value Acquire
                                                                                                               Growing through disciplined
     ELECTRICITY                     RENEWABLE               ELECTRICITY   GAS NETWORKS /   WATER NETWORKS /   acquisitions
     NETWORKS                        ENERGY                  STORAGE       GAS STORAGE      WATER STORAGE

Spark Infrastructure I Investor Presentation I August 2021                                                                                              29
INFRASTRUCTURE FOR THE FUTURE
GROWTH: INVESTING IN THE ENERGY TRANSITION
Spark Infrastructure’s investment portfolio benefits from exposure to regulated transmission and distribution businesses with staged
reset dates, an operational renewables project (100MW Bomen Solar Farm in NSW) and a renewables development portfolio of ~2.2GW
• TransGrid: Potential for significant investment in new transmission under AEMO’s Integrated System Plan and the NSW Government’s
Electricity Infrastructure Roadmap
• Interstate connectivity; system strength; increase capacity for new renewables
• Renewable Energy Zones: new areas of transmission to access high quality renewable resources
• Connection assets: unregulated, contracted growth through connections of new utility scale renewable projects
• VPN and SAPN: investment in distribution for rooftop solar; smart meters/demand management; community batteries; electric vehicles
• Unregulated growth for Beon driven by strong demand for credible EPC and O&M providers in solar and wind projects
• Unregulated growth for Enerven driven by large infrastructure contracts and renewables projects
• Spark Renewables:
• Successful construction and operation of 100MWac Bomen Solar Farm near Wagga Wagga, NSW
• Development portfolio of ~2.2GW of utility scale solar, wind, storage and green hydrogen opportunities
• Direct adjacency to transmission and at the centre of Australia’s energy transition from
Spark Infrastructure is the only ASX listed business owning both electricity networks and renewables
Spark Infrastructure I Investor Presentation I August 2021 30INFRASTRUCTURE FOR THE FUTURE
TRANSGRID: TRANSMISSION GROWTH
Spark Infrastructure will significantly benefit from the expected growth from ISP major projects through our 15% interest in TransGrid
Modelled Delivery
TransGrid Network Opportunities
Cost Target
2018-2023 capex allowance $1.2bn N/A
Committed
QNI Minor(1) $0.2bn 2021
VNI Minor(2) $0.1bn 2021
Project EnergyConnect (PEC)(3) $1.8bn 2023
Total $2.1bn
Actionable
Central-West Orana REZ Transmission Link(4) $0.7bn 2024-25
HumeLink(5) $3.3bn 2026-27
VNI West (Kerang Route)(6) $2.4bn 2027-28
Total $6.4bn
Preparatory Activities Required
2032-33 to
QNI Medium & Large(4) $3.3bn
2035-36
New England REZ Network Expansion(7) $1.3bn 2030s
North West NSW Network Expansion(8) $0.9bn 2030s
Total $5.5bn Source: AEMO 2020 ISP
Total ISP Modelled Projects $14.0bn
(1) $2017-18 Contingent Project Application (CPA) approved 28 April 2020 (2) $2017-18 CPA approved 13 April 2021 (3) $2017-18 CPA approved 31 May 2021 (4) AEMO 2020 ISP (5) HumeLink PACR - Option 3C
(preferred option) (6) RIT-T process underway (details based on AEMO 2020 ISP) (7) AEMO 2020 ISP - Includes combined costs for Stage 1 & 2 (8) AEMO 2020 ISP - Includes combined costs for Stage 1,2 & 3
Spark Infrastructure I Investor Presentation I August 2021 31INFRASTRUCTURE FOR THE FUTURE
TRANSGRID: PROJECTS UNDERWAY
TransGrid has successfully achieved approval to deliver three major projects as outlined in AEMO’s Integrated System Plan
Project EnergyConnect (PEC) QNI Minor
• AER Approved in May 2021 • AER Approved $218m ($2017-18) in April
2020
• 900km transmission line connecting SA
and NSW energy grids • On track for completion in December
2021
• TransGrid to deliver PEC in NSW
(~$2bn increase in TransGrid RAB) • Allows a further 460MW of power to be
transferred into QLD and 190MW more
• Expected to deliver net savings to into NSW and enhance network reliability
consumers of up to $100 per household
• Delivers net benefits of up to $170 million
• Forecast to unlock 1,800MW of to electricity customers
additional renewable generation
• Spark Infrastructure instrumental in Source: AEMO 2020 ISP
sourcing unique funding solution with
CEFC
VNI Minor
• AER Approved $45m ($2017-18) in May 2021
• On track for completion in December 2021
• Increases transfer capacity into NSW from Victoria by 170MW
• Benefits consumers and producers of electricity by deferring the
need to build new generation and storage capacity in NSW, and
allowing for more efficient sharing of generation across the NEM
Spark Infrastructure I Investor Presentation I August 2021 32INFRASTRUCTURE FOR THE FUTURE
TRANSGRID: HUMELINK
TransGrid has recently published the Project Assessment Conclusion Report (PACR) for HumeLink
• HumeLink will provide net benefits of up to $491m
• Total Capex is expected to be $3,317m made up of:
- Lines and substations: $2,380m
- Biodiversity offset costs: $935m
• The largest part of the difference in cost since the
Project Assessment Draft Report (PADR) is the
biodiversity offset costs required in NSW
• The PACR identifies the preferred option (3C) to
comprise new 500kV lines in an electrical ‘loop’
between Maragle, Wagga Wagga and Bannaby
Source: HumeLink PACR
Delivers net Unlocks capacity Increases Unlocks full Creates >1,000
benefits up to for new energy electricity capacity capacity of the construction jobs
$491m sources across the NEM Snowy Hydro in regional NSW
Scheme
Spark Infrastructure I Investor Presentation I August 2021 33INFRASTRUCTURE FOR THE FUTURE
ENERGY TRANSITION: DRIVING UNREGULATED GROWTH
VPN, SAPN and TransGrid’s unregulated businesses have each seen increasing growth in activity as a result of the energy transition
Beon Margin Enerven Margin Lumea Margin
25 30 80
20 25
60
20
15
A$m
A$m
A$m
15 40 77
27.1 72
10 20.1 23.7 22.8 62
10
11.3 11.5 15.3 20 37 35
5 10.1 13.8
7.2 5
0 0 0
2017 2018 2019 2020 HY2021 2017 2018 2019 2020 HY2021 2017 2018 2019 2020 HY2021
Future-focused energy solutions business with a heritage Highly skilled provider of services in the competitive Growing portfolio of >9GW of renewable energy
in safety and reliability energy and telecommunications sectors connection assets across the National Electricity Market
A leader is the deployment of large-scale renewable Significant growth since its origins as the Construction and Strategically positioned to deliver Renewable Energy
energy and infrastructure projects Maintenance Services spin-off from Field Services in 2007 Zones across the ISP with assets across the NEM to
support the NSW government with the creation of
Extensive expertise in design, construction and Enormously successful in diversifying from its origins,
Renewable Energy Zones
maintenance dominantly providing transmission construction and
maintenance services to ElectraNet Focused on innovation and delivering new technologies
Technical expertise and agility to provide energy solutions
including large scale batteries and vehicle electrification
for renewables, utility and infrastructure, business Major provider of broader infrastructure services in South
solutions, and residential development Australia including to the telecommunications and Leading telecommunications provider to renewable
renewables sectors projects, with a focus on regional areas, data transmission
and emergency broadcast services
Spark Infrastructure I Investor Presentation I August 2021 34INFRASTRUCTURE FOR THE FUTURE
LUMEA BATTERY PROJECTS
Leading the way in delivering large scale battery projects
Australian’s first privately funded grid scale battery NSW first grid-scale battery
• Lumea has recently commenced an EOI for the development of a • The Wallgrove battery is delivering a unique commercial structure to
300MW grid scale battery intended to be fully financed from deliver synthetic inertia as a service to TransGrid. The project
private sector market participants. received funding from ARENA and NSW Government as part of the
Emerging Energy program.
• One of the first for Australia, the large-scale battery storage
system will operate in the NEM from the Deer Park Energy Hub in • These network services help to stabilise the grid and will become
Victoria, the key source of electricity supply for metropolitan increasingly integral to enable the increase of renewable generation
Melbourne. to safely connect to the grid.
Sydney West Substation – Wallgrove, NSW
Spark Infrastructure I Investor Presentation I August 2021 35INFRASTRUCTURE FOR THE FUTURE
RENEWABLES PORTFOLIO
Operational Asset
1 Bomen Solar Farm
Location Capacity COD Capex Status
Development Projects NSW 100MW 2020 $170m Complete
Dinawan Energy Hub
Solar, Wind & Storage
Potential Capacity: ~2.5 GW Development Projects
4 2 Dinawan Energy Hub
Bomen Energy Hub
Solar, Storage & Green Hydrogen Location Capacity Est. FID Est. Capex Status
Potential Capacity: ~60MW
NSW
2 3 Stage 1 ~1.0GW 2024 $1,800m Early stage
1
Stage 2 ~1.5GW 2026 $2,450m Early stage
Operational Asset 3 Bomen Energy Hub
Bomen Solar Farm Location Capacity Est. FID Est. Capex Status
Capacity: 100 MW
NSW ~60MW 2022 $80m Early stage
Development Pipeline
Development Pipeline
4
New South Wales
Location Capacity Est. FID Est. Capex Status
Solar + Storage
Potential Capacity: ~150MW NSW
Wind Farm ~150MW 2023 $170-230m Early stage
Solar + Storage
Potential Capacity: ~350 MW
Operational Asset Wind Farm ~350MW 2024 $715m Early stage
Development Projects South Australia
South Australia
Development Pipeline Wind Farm
Potential Capacity: ~600 MW Wind Farm ~600 MW 2023 $1,700m Early stage
Spark Infrastructure I Investor Presentation I August 2021 36INFRASTRUCTURE FOR THE FUTURE CAPITAL MANAGEMENT P R U D E N T C A P I TA L M A N A G E M E N T W I L L D E L I V E R G R O W T H I N A S S E T B A S E Spark Infrastructure I Investor Presentation I August 2021 37
INFRASTRUCTURE FOR THE FUTURE

GROWTH PIPELINE - FULLY FUNDED
      Indicative growth Capex                                                                                                                                                                                 Indicative RCAB
                                                                                                                                            687
               (Proportionate p.a. $m)                                                                                                                       645                                               (Proportional $m)

                                                                                                           516              527                                                                                                              9,215
                                                                                                                                                                                                                       CAGR 6.6%
                                                          368                                                                                                                                        6,703
                                                                                                                                                                                                                   with Renewables Growth

                                                                                           319                                                                                                                         CAGR 3.8%
                                                                          241                                                                                                                                        BAU + ISP Growth
                                         199
        121              153

       2016             2017            2018             2019            2020             2021            2022             2023            2024             2025                                     2020                                    2025
                                                                VPN            SAPN             TGD         Renewables                                                                         VPN     SAPN     TGD (RAB)            TGD (CAB)   Renewables

        Indicative Funding                                                                                                                                                         •   RAB growth supported by regulatory determinations
          (Proportionate p.a. $m)
                                                                                                                                                                                   •   TransGrid RCAB growth supported by AEMO’s ISP

                                                                                                          110                               439             385                    •   Renewables investment reflects probability weighted rollout
                                                                                                                           207                                                         of announced early stage development pipeline
                                                                                                          70
                                                         80
                                          -                                                35                               70
                                                         84
        -                -
                                                                           -
                                                                          80
                                                                                                          330
                                                                                                                                            70               70                    •   DRP to be reinstated to fully fund growth together with
                                                                                          295
        -
                       153              199             204              161
                                                                                                                           245
                                                                                                                                            179             190                        existing debt capacity
       121

      2016            2017             2018            2019             2020             2021            2022             2023             2024            2025                    •   Spark Infrastructure committed to investment grade ratings
                                        Asset Level Financing             DRP          SKI Corporate Debt/Retained cash

(1)   SAPN values derived from SA Power Networks Final Determination – differential of annual opening RAB value vs closing RAB value, adjusted for SKI Financial Year
(2)   VPN values based on CitiPower and Powercor Regulatory Proposals submitted 31 January 2020 – differential of annual opening RAB value vs closing RAB value, adjusted for SKI Financial Year
(3)   Renewables growth equivalent to capex investment of ~610GW (~$1.3bn) in 2021-2025
(4)   TransGrid includes investments presented on Slide 31

Spark Infrastructure I Investor Presentation I August 2021                                                                                                                                                                                                    38
INFRASTRUCTURE FOR THE FUTURE CLOSING REMARKS D E L I V E R I N G G R O W T H I N S U S TA I N A B L E A S S E T B A S E W I T H AT T R A C T I V E Y I E L D Spark Infrastructure I Investor Presentation I August 2021 39
INFRASTRUCTURE FOR THE FUTURE

OUTLOOK AND DISTRIBUTIONS
Delivering attractive total return from strong growth and sustainable yield into the future

  Outlook                                • SAPN and VPN regulatory determinations deliver revenue certainty for next 5 years
                                         • TransGrid’s ISP Major Projects pipeline underway: PEC into construction; Humelink approval process commenced
                                         • Businesses exploring new technologies, including batteries, as part of their networks for the future
                                         • Growth agenda for regulated and contracted assets at TransGrid is substantial
                                                   • Supported by AEMO’s 2020 ISP and NSW Electricity Infrastructure Roadmap
                                         • Renewable development pipeline established; disciplined approach to ensure high quality accretive growth
                                         • Reinstate DRP to fund equity capital requirements for growth pipeline, whilst maintaining investment grade ratings
                                         • Tax refund of approximately $45m ($40m primary tax and $5m interest) expected in 2H 2021

  Distribution                           • Guidance for FY21 of 12.5cps (i.e. final distribution for FY21 of 6.25cps), subject to business conditions and in the
  guidance – subject                       absence of a control transaction occurring before 31 December 2021
  to Offer
                                         • Intention to grow distributions by ‘at or around’ CPI over next 5-years to 2025
                                         • Distribution sustainability based on cumulative operating cash flows across the period
                                         • DRP to be reinstated to fund equity commitments for growth pipeline

                                                       Yield and Growth will continue to deliver sustainable value to Securityholders

Spark Infrastructure I Investor Presentation I August 2021                                                                                                         40
INFRASTRUCTURE FOR THE FUTURE APPENDIX Spark Infrastructure I Investor Presentation I August 2021 41
INFRASTRUCTURE FOR THE FUTURE

KEY METRICS
Distributions, RAB, credit metrics and gearing
SECURITY METRICS                                                                                                      VICTORIA POWER NETWORKS             $m
                                                                                                                            (1)
Market price at 20 August 2021                                                                           $2.77        RAB         (including AMI)       6,858
Market capitalisation                                                                               $4.9 billion      Net debt                          4,934
                                                                                                                      Net debt/RAB                      71.9%
DISTRIBUTIONS
HY 2021 actual                                                                                         6.25 cps       SA POWER NETWORKS                   $m
Comprising:
                                                                                                                      RAB(1)                            4,410
   - Loan Note interest                                                                                 3.50cps
                                                                                                                      Net debt                          3,206
   - Trust Distribution                                                                                 2.75cps
                                                                                                                      Net debt/RAB                      72.7%

CREDIT RATINGS                                                                                                        TRANSGRID                           $m
Investment portfolio credit ratings                                                  SA Power Networks: A-                  (1)
                                                                                                                                                        7,186
                                                                                                                      RAB
                                                                                Victoria Power Networks: A-
                                                                                                          (4)         CAB(1)(2)                          863
                                                                                          TransGrid: Baa2
                                                                                                                              (1)(2)
Spark Infrastructure level credit rating                                                              Baa2            RCAB                              8,049
                                                                                                                      Net debt(3)                       6,191
SPARK INFRASTRUCTURE                                                                                         $m       Net debt/RAB      (5)
                                                                                                                                                        84.4%
Total RAB and CAB (Spark Infrastructure share)                                                            6,899       Net debt/RCAB(3)                  76.9%
Gross debt at Spark Infrastructure level                                                                    100

  (1)   June 2021 estimate
  (2)   Includes WIP/partially completed assets and investment property
  (3)   Net Debt is calculated using gross debt less cash and adjusted for prescribed revenue over/(under) collection and includes TransGrid Services
  (4)   Relates to the AMTN and USPP Notes of the TransGrid Obligor Group
  (5)   Relates to TransGrid Obligor Group
Spark Infrastructure I Investor Presentation I August 2021                                                                                                 42
INFRASTRUCTURE FOR THE FUTURE UNREGULATED REVENUES (100% BASIS) Victoria Power Networks ($m) HY 2021 HY 2020 Variance Beon Energy Solutions 143.2 104.2 39.0 Service Level Agreement Revenue 9.5 11.5 (2.0) Telecommunications 0.6 0.6 0.0 Joint Use of Poles 2.1 3.1 (1.0) Other 6.7 4.5 2.2 TOTAL 162.1 123.8 38.2 SA Power Networks ($m) HY 2021 HY 2020 Variance Energy Infrastructure and Solutions 98.1 151.7 (53.6) Facilities Access / Dark Fibre 1.0 1.0 - Asset Rentals 2.3 2.1 0.2 Sale of Salvage 0.8 0.4 0.4 Other 4.9 1.3 3.6 TOTAL 107.1 156.5 (49.4) TransGrid ($m) HY 2021 HY 2020 Variance Infrastructure Services 61.5 54.0 7.5 Property Services 2.6 2.5 0.1 Telecommunication Services 7.1 6.5 0.6 TOTAL 71.2 63.0 8.2 Spark Infrastructure I Investor Presentation I August 2021 43
INFRASTRUCTURE FOR THE FUTURE

SEMI REGULATED REVENUES (100% BASIS)
Victoria Power Networks ($m)                                                                                 HY 2021   HY 2020   Variance
   Public Lighting                                                                                               5.8       5.9       (0.1)
     New Connections                                                                                             8.4       7.7        0.7
     Special Reader Activities                                                                                   2.6       2.3        0.3
     Service Truck Activities                                                                                    2.5       3.1       (0.6)
     Recoverable Works                                                                                           1.5       0.6        0.9
     Specification and Design                                                                                    7.6       6.0        1.6
     Other                                                                                                       3.2       4.5       (1.3)
TOTAL                                                                                                           31.6      30.1        1.5

SA Power Networks ($m)                                                                                       HY 2021   HY 2020   Variance
 Public Lighting                                                                                                 8.0       8.2       (0.2)
   Metering Services                                                                                             9.6       7.6        2.0
   Pole/Duct Rental                                                                                              2.2       2.5       (0.3)
   Other Negotiated Services(1)                                                                                 28.7      22.3        6.4
   TOTAL(2)                                                                                                     48.5      40.6        7.9

(1) Includes Asset Relocation and Embedded Generation
(2) Does not include Alternative Control Services (ACS) revenue, which is reported as part of DUOS revenue

Spark Infrastructure I Investor Presentation I August 2021                                                                               44
INFRASTRUCTURE FOR THE FUTURE
VPN 2021-26 FINAL REGULATORY DETERMINATIONS
The AER Final Determination establishes revenue certainty until 30 June 2026
CitiPower Powercor The Final Determinations will continue to deliver RAB growth
Regulatory across both CitiPower and Powercor
proposal 2016-20 2021-26 2021-26 2021-26 2016-20 2021-26 2021-26 2021-26
metric Allowance Draft Revised Final Allowance Draft Revised Final Standard Control Services Revenue ($m Nominal)(1)(2)(3) and RAB ($bn)(4)
(1) Decision(2) Proposal(2) Decision(3) (1) Decision(2) Proposal(2) Decision(3) $800
Net capex
$849m $567m $633m $590m $2,060m $1,561m $1,836m $1,728m
($2021)
$600
Opex
$473m $463m $472m $477m $1,317m $1,321m $1,388m $1,423m
($2021)
7.74
$400 7.42 7.60
WACC 6.11% 4.59% 4.59% 4.73% 6.11% 4.59% 4.59% 4.73% 6.81 7.17
6.26 6.48
5.72 5.97
5.27 5.47
Risk-free
2.48% 0.93% 0.93% 1.38% 2.48% 0.93% 0.93% 1.38%
Rate $200
Inflation 2.35% 2.37% 2.37% 2.00% 2.35% 2.37% 2.37% 2.00%
$-
DEC DEC DEC DEC DEC JUN JUN JUN JUN JUN JUN
Gamma 0.4 0.585 0.585 0.585 0.4 0.585 0.585 0.585 16 17 18 19 20 21 22 23 24 25 26
CitiPower Revenue Allowance CitiPower Revised Proposal CitiPower Final Decision
(2016-20)
Revenue
$1,484m $1,426m $1,441m $1,486m $3,205m $3,242m $3,345m $3,451m Powercor Revenue Allowance Powercor Revised Proposal Powercor Final Decision
(Nominal) (2016-20)
VPN Regulated Asset Base
The Final Determinations reinforce VPN’s improved consumer engagement and credible responses to the AER’s Draft Decisions
(1) AER: CitiPower / Powercor – Final Decision 2016-2020 (Capex and Opex updated to $2021) (2) CitiPower / Powercor – Revised Proposal 2021-2026 – December 2020
(3) AER: CitiPower / Powercor – Final Decision 2021-2026 – April 2021 (4) RAB values from RAB roll-forward model (RFM) and post-tax revenue model (PTRM)
Spark Infrastructure I Investor Presentation I August 2021 45INFRASTRUCTURE FOR THE FUTURE
SAPN 2020-25 FINAL REGULATORY DETERMINATION
The AER Final Determination establishes revenue certainty until 30 June 2025
Regulatory 2020-25
2015-20 2020-25 2020-25 The Final Determination is in line with expectations with
proposal Revised
metric
Allowance(1) Draft Decision(2)
Proposal(2)
Final Decision(2)
improved capex and inflation outcomes
Capex
($2019-20)
$2,011m $1,247m $1,693m $1,596m Standard Control Services Revenue ($m) and RAB ($bn)(1)(2)
$1,000
Opex
$1,375m $1,473m(3) $1,470m $1,470m
($2019-20)
$800
WACC 6.17% 4.95% 4.79% 4.75%
$600
4.77 4.85
Risk-free 4.48 4.59 4.68
2.96% 1.32% 0.96% 0.90% 4.36
Rate $400 4.09 4.23
3.88 3.93
Inflation 2.50% 2.45% 2.36% 2.27%(4) $200
Gamma 0.4 0.585 0.585 0.585 $-
FY16 FY17 FY18 FY19 FY20 FY21 FY22 FY23 FY24 FY25
Revenue Allowance Draft Determination Revised Proposal Final Determination
Revenue
$3,769m $3,905m $3,933m $3,914m
(Nominal) Regulated Asset Base
The majority of SA Power Networks’ Revised Proposal was accepted by the AER in the Final Determination released on 5 June 2020
(1) AER Final Decision 2015-2020, October 2015 updated to $2020 (2) AER Final Decision Overview, June 2020.(3) AER Draft Decision Overview, October 2019. (4) The reduction in the inflation forecast was due to the using of
the trimmed mean CPI forecast as it was more appropriate in the COVID-19 circumstances.
Spark Infrastructure I Investor Presentation I August 2021 46INFRASTRUCTURE FOR THE FUTURE
CAPITAL EXPENDITURE (100% BASIS)
CAPITAL EXPENDITURE
Victoria Power
$m SA Power Networks TransGrid Totals
Networks
HY 2021 HY 2020 HY 2021 HY 2020 HY 2021 HY 2020 HY 2021 HY 2020
Growth capex 213.8 206.2 58.2 62.4 396.1 85.6 668.1 354.2
Growth capex - unregulated - - - - 57.4 105.7 57.4 105.7
Non-network capex(1) - - - - 19.2 24.1 19.2 24.1
Maintenance capex 109.6 105.3 103.1 114.7 91.4 94.9 304.1 314.9
Total 323.4 311.5 161.3 177.1 564.1 310.3 1,048.8 798.9
Spark share 158.5 152.6 79.0 86.8 84.7 46.6 322.2 286.0
Change vs pcp (%) 3.8% -8.9% 81.8% 12.6%
Maintenance capex Regulatory Less inflation uplift on Net regulatory
$m
spend depreciation RAB depreciation
HY 2021 HY 2020 HY 2021 HY 2020 HY 2021 HY 2020 HY 2021 HY 2020
Victoria Power Networks 109.6 105.3 169.5 185.1 (80.1) (50.3) 89.4 134.9
SA Power Networks 103.1 114.7 165.0 164.2 (26.7) (41.3) 138.4 122.9
TransGrid 91.4 94.9 145.0 137.3 (28.4) (59.3) 116.6 78.0
Total 304.1 314.9 479.5 486.6 (135.1) (150.9) 344.4 335.8
Spark share 117.9 122.1 185.7 191.8 (56.6) (53.8) 129.1 138.0
(1) Non-network capex includes NCIPAP
Spark Infrastructure I Investor Presentation I August 2021 47You can also read