SOFT DRINKS REVIEW 2018 - Britvic
←
→
Page content transcription
If your browser does not render page correctly, please read the page content below
GROCERY
    SOFT DRINKS REVIEW
    2018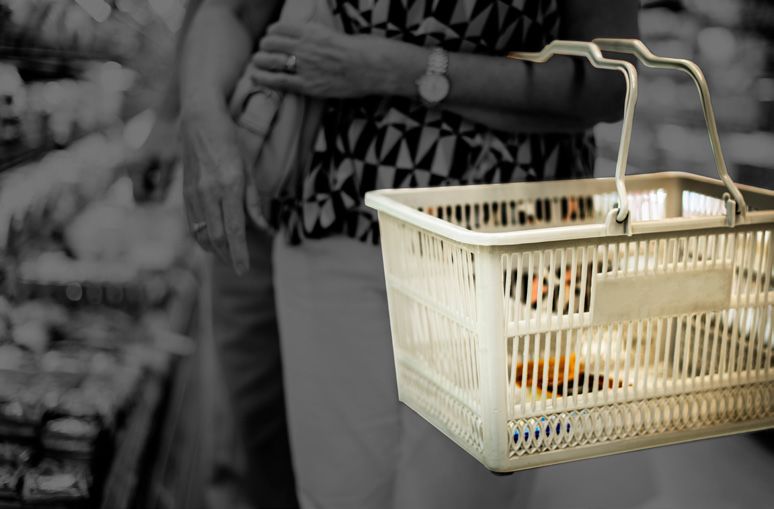
2
WELCOME to the Britvic Soft Drinks Review
It has been an unprecedented year for our category with a series In January this year, government took the next step by opening
of impactful events to navigate. A number of opportunities consultation to gain industry insight into regulations around
and challenges arose from changes in the consumer, retail and high fat salt sugar (HFSS). At Britvic we are very much aligned
regulatory landscape. to this desire to make a positive difference to the people and
world around us through our sustainable business programme, ‘A
Pleasingly, the soft drinks category performance continues to be Healthier Everyday’, which focuses on three areas where we can Paul Graham
amazingly resilient, growing in both value (+7.7%) and volume (+ make a real difference: healthier people, healthier communities GB Managing Director
2.9%)1. and a healthier planet.
The Soft Drinks Industry Levy (SDIL) was introduced last April, Spearheaded by the Blue Planet II documentary, plastic - and This level of activity shows the vibrant and dynamic nature of the
signalling the start of increasing government focus on initiatives particularly single use - came into sharp focus. Many positive sector, which continues to offer great opportunity, but the offer
to help improve the nation’s health through reducing calories from steps have been taken in retail, including charging for plastic bags has to be distinctive and well-run to thrive. All was not positive
our diets. and the introduction of reverse vending machine trials and as though - last year also saw high-profile closures of a number of
an industry we must continue to prioritise how we can limit our retail businesses.
Britvic’s strategy and long-term focus on health and the strength environmental impact.
of our no/low portfolio meant we entered the levy from a robust Preparations for Brexit continued throughout 2018. There will of
position, already benefiting from strong sales growth. Today 99% Although the summer’s CO2 shortage saw soft drink volume sales course be regulatory changes to adapt to but I believe that the
of our GB owned brands are below/exempt (90% in Ireland) and lost through the limited production of carbonated soft drinks, soft drinks category will again demonstrate resilience in this area.
our strategy to encourage healthier choices is working effectively. value was maintained in the category due to quick reactions
including scaling back on promotional activity2 and suppliers who Our category continues to be a dynamic and creative place to be
The levy has had a lasting impact on the soft drinks industry, operated in non-carbonated spaces, like Britvic, that were able to with a wealth of opportunities and innovation from both suppliers
particularly in the cola category, with significant volume shift from offer retailers choice. and retailers, which continues to excite consumers and make soft
regular to low and no sugar options and products such as Pepsi drinks among the most exhilarating categories in the UK.
Max have now gained significant share from full sugar products. 2018 was also a record year for mergers and acquisitions
with more than a quarter of deals in the past 22 years signed Kind Regards,
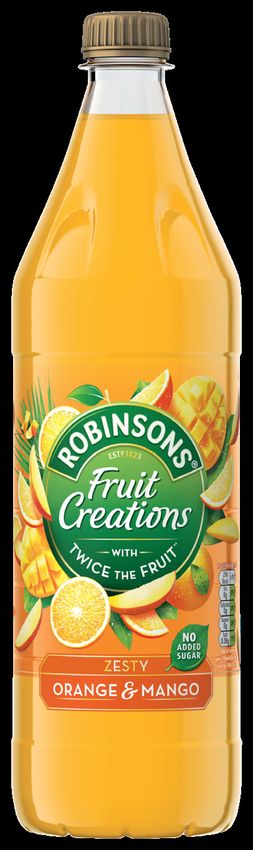
The post-levy trend towards no/low sugar has also seen the in the last 12 months, including completion of the Tesco/ Paul Graham
dilutes category improve its fortunes, driven by Robinsons’ Booker deal. This consolidation has continued into 2019 with
excellent performance and the launch of its premium Fruit the announcement of the Ocado/M&S joint venture and these
Cordials and Creations, with Robinsons Creations the top soft business movements have opened up an even more competitive
drink launch of the past two years.2 marketplace with retailers looking to differentiate and grow value.
Key Grocery 2019 And Def initions
2018 Market The Year In Channel Sof t Drink Beyond In Future Drivers Future
Welcome Conclusion & Glossary Data Sources
Inf luences Numbers Performance Inf luences Grocery In Sof t Drinks Outlook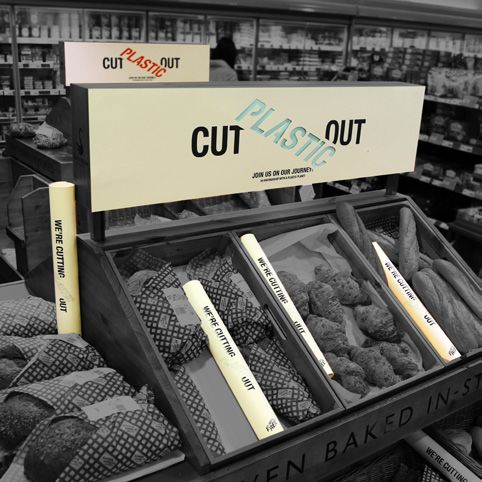
3

   2018 MARKET INFLUENCES
   First half
                                MFG                                         Beast                                                                              Hottest
                                acquires                                                                                                                    summer on record
                                                                                                                      Soft Drinks Industry
                                MRH
                                                                          from the East
                                                                                                                      Levy      introduced
                                                                                                                                                                30
                                                                                                                                                              for   years

          Jan                               Feb                                 Mar                                      Apr                                    May

                                                                                                                                               Nisa / Co-op
                                                                         Tesco completes
                Plastic                                                      £4bn                                                       deal approved
               Blue Planet II                                                                                                            by Nisa members
                                                                         takeover of Booker

                                                         Key Grocery      2019 And                                                           Def initions
           2018 Market     The Year In       Channel       Sof t Drink    Beyond In       Future Drivers    Future
Welcome                                                                                                                    Conclusion        & Glossary        Data       Sources
            Inf luences     Numbers        Performance    Inf luences      Grocery        In Sof t Drinks   Outlook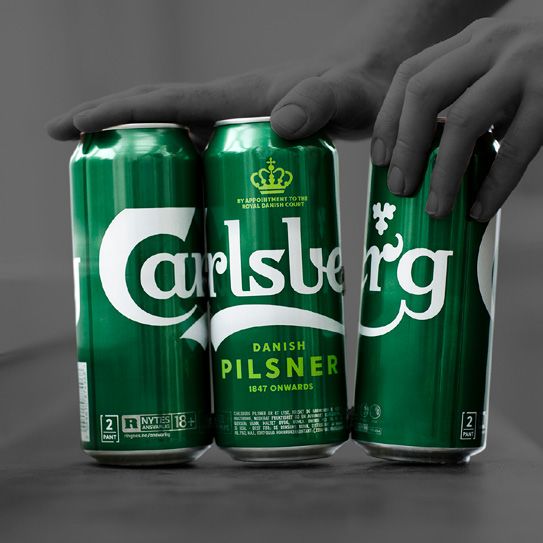
4

   2018 MARKET INFLUENCES
   Second half
                                     England reach the semi-finals

             CO2
                                       of theWorld Cup                                CCEP
                                                                                                           Applegreen completes        The Restaurant
          shortage                                                             purchase                       takeover                Group completes

                                                                                      Costa
                                                                                                            of Welcome Break           takeover
                                                                                                                                      of Wagamama

              CO2

          Jun                                 Jul                                Aug                                    Nov                                     Dec

                                                                                                                       Today’s / Landmark
                                                    Tesco and Carrefour                                                   merger
                                                       form strategic                                                                                   Asda / Sainsbury’s

                        Co-op to supply to
                                                        alliance                       U16 Energy drink                                                 merger referred to
                                                                                                                                                           competition
                   2,200      Costcutter stores
                                                                                      consultation                                                      commission
                                                                                       announcement
                      following P&H closure

                                                         Key Grocery      2019 And                                                       Def initions
           2018 Market     The Year In      Channel        Sof t Drink    Beyond In      Future Drivers      Future
Welcome                                                                                                                  Conclusion      & Glossary           Data           Sources
            Inf luences     Numbers       Performance     Inf luences      Grocery       In Sof t Drinks     Outlook
5

   THE YEAR IN NUMBERS

                                                                                                                   5 biggest
                                                                                                                         th
                                                                                                                                                                                 4
                      Overall grocery sales

                           0.0%                       3
                                                                                                                                   Retailer - Aldi supermarket
                                                                                                                               Aldi is now the fifth biggest retailer in UK Grocery,
                                                                                                                               moving ahead of Waitrose and more recently Co-op.
          Flat in both value and volume, which was better than
          expected, and was driven by a solid end to the year.

          Q4 Sales seeing                  December growth                                             However, the top four are also returning to growth, with Tesco
                                                                                                       and Asda leading the way, with 0.3% value growth and 1.9%
                                                                                                       growth respectively in the L12w vs YA.
                +1.4%                           +3.3%
                             3                                   3

                                                                                                       Value growth
                                           Best 4w/e grocery                                           Tesco                              Asda
                                           growth since 2012

                                                                                                             +0.6%                             +0.7%
          The biggest movements in where we shop continued to be                                                         21                                    21
          away from the main shop in supermarkets towards (in order):4

                     1                               2                                                                                    In the L12w vs YA.

            main shop in                    main shop                                                      We saw less and less promotions, with spend
            discounters                     online                                                         on offer falling to its lowest level in six years.

                                    3
                           top-up shop in                                                               Private label is becoming increasingly
                           discounters                                                                  important & driving growth, particularly
                                                                                                        in Tesco and Co-op where PL has seen
                                                                                                        massive support. Notably Premium PL is
                                                                                                                                                        private label
                                                                                                        gaining share.1
          This leaves online & discounters
          continuing to drive growth

                                                                     Key Grocery     2019 And                                                           Def initions
            2018 Market      The Year In        Channel                Sof t Drink   Beyond In   Future Drivers      Future
Welcome                                                                                                                                Conclusion       & Glossary            Data     Sources
             Inf luences      Numbers         Performance             Inf luences     Grocery    In Sof t Drinks     Outlook
6
Pack format Category data1 Manufacturers1
Total value of soft drinks1 growth1
£6.2
Juice drinks Pure juice CCEP
£400m value £872m value £1.5bn value
+8.6%
bn
single
-6.4% growth +2.5% growth +11.3% growth
+8.2%
single
multipack Glucose stimulants drinks Plain water Private label
7.7 + % +6.8% multi-serve £493m value £645m value £1.3bn value
+4.4% growth +4.7% growth +3.3% growth
Dairy & Dairy Substitute Smoothies Britvic
Top 10 Brand performance1
Cola-Cola Pepsi Innocent Lucozade Robinsons
£414m value £236m value £741m value
£896m value £386m value £248m value £235m value £218m value
+5.4% growth +6.1% growth +11.4% growth
Sport drinks Squashes LRS
+12.5% growth +13.4% growth +6.3% +4.1% +7.6%
£75m £438m £328m
growth growth growth
value value value
Tropicana Red Bull Fanta Schweppes Fever Tree
+6.2% +7.9% +2.5%
£188m £146m £124m £115m £114m
growth growth growth
value value value value value
Non fruit carbonates Fruit carbonates Danone
+3.9% growth +10.3% growth +17.4% growth +24.0% growth +53.4% growth £138m value £448m value £283m value
Top 10 Brands in growth1 +9.0% growth +10.7% growth +1.6% growth
Water plus Cola Innocent
Highest Ranked by highest % value difference vs YA
Fever Tree Schweppes Fanta Dr. Pepper Vimto £211m value £1.3bn value £258m value
£113.8m value £114.7m value £123.5m value £60.1m value £62.6m value +12% growth +12.6% growth +5.4% growth
+53.4% +24.0% +17.4% +13.8% +13.5%
Lemonade Cold hot drinks Tropicana
growth growth growth growth growth
Pepsi Highland Spring Coca-Cola Irn Bru Red Bull
£125m value £99m value £222m value
£386.3m value £88.0m value £896.4m value £75.2m value £145.9m value +17.4% growth +30% growth +2.4% growth
Traditional Mixers Nestle Waters
+13.4% growth +12.6% growth +12.5% growth +11.6% growth +10.3% growth
£250m value £199m value
Lowest Ranked by lowest % value differences vs YA
+30.8% growth +5.2% growth
Strathmore Aqua Coldpress Suncrest Quarker
Red Bull
£828,000 value £676,000 value £1.8m value £278,000 value £453,000 value £146m value
-60.0% growth -54.5% growth -51.9% growth -49.9% growth -47.8% growth +10.3% growth
Acqua Pura Jammin Acqua Frita Aceau Vitamin Sunpride Barrs
£3.6m value £586,000 value £1.4m value £2.5m value £1.2m value £132m value
-47.1% growth -46.7% growth -46.5% growth -39.7% growth -31.1% growth +11.5% growth
Key Grocery 2019 And Def initions
2018 Market The Year In Channel Sof t Drink Beyond In Future Drivers Future
Welcome Conclusion & Glossary Data Sources
Inf luences Numbers Performance Inf luences Grocery In Sof t Drinks Outlook
7

   CHANNEL                                                                                      Discounters and
                                                                                                online growth

   PERFORMANCE
                                                                                                Competition in the grocery channel remained
                                                                                                strong in 2018, with customers switching into
                                                                                                discounters and online sales growth continuing
                                                                                                but slowing down.7

                                                                                                Discounters’ rapid store expansion is driving
   2018 was a year of very strong performance with total soft drink                             growth and helping them attract new shoppers
   sales up 7.7%1 in the Grocery channel.                                                       with Aldi and Lidl now contributing £446m7 to
   Whilst overall consumer confidence weakened to its lowest point
                                                                                                soft drinks sales.                                         Soft drinks sales share value

                                                                                                                                                        £446m
   in the last four years1 due to uncertainty around Brexit, increased
   at home socialising occasions, along with good weather helped
   provide strong soft drinks growth in the grocery sector.
                                                                                                                                                                                             7
   Unprecedented events in the past year delivered both excitement
   and turmoil to the soft drinks market. April saw the introduction
   of the Soft Drinks Industry Levy (SDIL) and there was the hottest
   summer on record since 1976. Even with the challenge of
   the CO2 issue across Europe, the soft drinks category saw its
   highest performance in five years1. Still soft drinks categories                              Online sales continued to grow through
   disproportionately benefited from the issue and brands continued                              existing shoppers spending more, with sales
   to see strong growth. Despite more limited availability, the hot
   weather and huge demand also drove the carbonates category and
                                                                                                 now representing 9.2%7 of total soft drinks
   it delivered positive sales as well, resulting in overall value and                           spend, highlighting its importance to the
   volume sales increases.                                                                       category, as it now represents 7.2%7 of total
                                                                                                 grocery shopping spend.
   Because of the CO2 issue, retailers switched more promotions from
   carbonates to still category products. In some instances, when
   carbonates were promoted, they received feature space without
   any price cut offer, and generated similar levels of value.
                                                                                                                                                                 share of online sales
   Although household penetration of soft drinks is almost completely                           Retailer consolidation

                                                                                                                                                                       9.2%
   at its limit, it currently only features in one in every three
   consumption occasions and is present in only 32.7% of grocery                                continues                                                                            7
   shopping baskets6. There is additionally a significant opportunity to
   capitalise on the growing trends of reducing alcohol consumption
                                                                                                Consolidation in the retail market continued                        +
   along with the rising premiumisation of adult drinks.                                        throughout 2018, with the merger of Tesco
                                                                                                and Booker. The recent announcement of a                        of total soft drinks spend
                                                                                                new online partnership between Ocado and
                                                                                                M&S (starting in 2020) demonstrates that
                                                                                                consolidation will continue at pace.
                                                                                                A more consolidated market offers improved
                                                                                                operational efficiencies which in turn is likely
                                                                                                to benefit consumers with lower prices and
                                                                                                more choice.

                                                                           Key Grocery     2019 And                                                                 Def initions
                 2018 Market            The Year In            Channel       Sof t Drink   Beyond In       Future Drivers           Future
Welcome                                                                                                                                            Conclusion       & Glossary       Data        Sources
                  Inf luences            Numbers             Performance    Inf luences     Grocery        In Sof t Drinks          Outlook
8

   KEY GROCERY SOFT DRINK INFLUENCES
   Soft drinks industry levy impact                                                                What is the soft drinks industry levy?
   The Soft Drinks Industry Levy (SDIL) went live in April 2018, with the government’s aim
   to reduce the nation’s sugar consumption from soft drinks. Upon announcement of the                                under levy                                                                   liable
   levy, manufacturers responded in various ways: technical innovation of the category
   enabled a number of brands to navigate changes in recipes to lower sugar formulations.          sugar              low                    moderate                 medium                    high               natural high
   Ultimately the level of reformulation was such that the cola and stimulant categories           free               sugar                  sugar                    sugar                     sugar              sugar
   were left with the most exposure to the levy.                                                   no greater than    0.6g to 2.4g           2.5g to 4.9g             0.5g to 7.9g              8g+ sugar          5g+ but no
                                                                                                   0.5g of sugar      of sugar               of sugar                 of sugar                  per 100ml          added sugar
   The decisive actions by manufacturers led to a lower ‘tax take’ than expected but               per 100ml          per 100ml              per 100ml                per 100ml
   contributed to a higher level of calorie and sugar reduction. George Osbourne’s
   original assumption was that the levy would generate £520m annually, but due to the
   unprecedented level of reformulation seen from manufacturers this was revised down
   to £240m.8

   The trend towards healthy drinks and sugar free variants was already present prior to
   introduction of the levy, however its implementation saw this trend further accelerate.
   It was particularly true in categories where a price difference between full sugar and
   sugar free variants was created, such as cola.
                                                                                                   The bands equate to legal definitions of sugar free and low sugar

   Sugar free take-home cola has seen share increase from 63% to 72%1 of volume in                                                     March 2016: Soft drinks                                         April 2017: Levy passes
   grocery, with no sugar the main driver of that growth. In the wider category the levy                                               Levy appears in the 2016                                        through Parliament as part
   saw many of the healthier stills categories such as squash and flavoured water gaining                                              Budget in its first form.                                       of the 2017 Finance Act.
   volume share.                                                                                                                       Gives manufacturers two
                                                                                                                                       years notice.
   Ultimately the overall soft drinks category remained buoyant post levy introduction.
   Despite large shifts in cola, the cola category too remained in a healthy position, where
   the strong growth of low/no sugar segments compensated for full sugar declines.
                                                                                                   Nov 2015                                                                                                   April 2018
   Retailers responded to the sugar levy and adjusted their range and mix accordingly
   in 2018. Promotional support was also readjusted in favour of healthier segments,
   although retailers too recognised the importance of supporting overall choice.

   The sugar levy will undoubtedly be viewed as a success by the government, and it                              November 2015:                                    October 2016:                                        2017-2018:
   is quite possible that they will be looking to employ a similar model in other FMCG                           Health experts                                    HM Treasury releases                                 Various Manufacturers
   categories such as biscuits, cereals or yoghurts.                                                             and celebrities                                   its consultation report                              start the reformulation
                                                                                                                 recommend a levy                                  providing more detail on                             process, including LRS,
                                                                                                                 on sugar in soft                                  the specifics of the Levy.                           Coca-Cola and Britvic
                                                                                                                 drinks to Public                                                                                       with varying results.
                                                                                                                 Health England.

                2018 Market            The Year In             Channel             Key Grocery      2019 And         Future Drivers             Future                                      Def initions
Welcome                                                                              Sof t Drink    Beyond In                                                        Conclusion                                      Data               Sources
                 Inf luences            Numbers              Performance            Inf luences      Grocery         In Sof t Drinks            Outlook                                     & Glossary
9

   Sugar level share of sector,
   Volume sales and Total coverage9                                                                total soft drinks               7.7%         17.3%         2.9%           32.4%                                       38.6%

   There was a greater level of reformulation than expected and                                                cola                           28.7%                                                69.1%
   subsequently only the Cola and Stimulant sectors have been left
   with significant exposure to the levy.                                                      glucose stimulant                              25%                                    55.1%                                        18.8%

                                                                                                       juice drinks              4.6% 3.2%                        53.7%                                          26.5%                 10.2%

                                                                                                 fruit carbonates                 2.2%                         52.7%                                                 37.4%                 3.3%

                                                                                                         squashes                     13.4%      4.3%                                           81.4%

                       high sugar
                                                                                                        water plus                    13.2%                                                      77.8%

                       medium sugar                                                            traditional mixers                5.1%                 32%                                                  61.1%

                       moderate sugar                                                        non fruit carbonates                2.4%                   46.1%                                                      47.3%

                       low sugar                                                                       sport drinks                                                             92.8%                                                      4.5%

                       sugar free                                                                       lemonade                                    35.5%                  12.3%                                 51.3%

                       natural high sugar                                                                  iced tea                                                             93.7%                                                     1.6%

                       exempt                                                                                                    0%       10%         20%        30%      40%        50%        60%        70%       80%         90%      100%

   Health
   Although the levy accelerated the already established trends of sugar reduction, the             The natural energy category has already seen growth double in the past three years 10,
   increasingly important focus on health continues to present itself in different ways to          with sales also expected to treble over the next five years.20
   retailers.
                                                                                                    A key trend that is continuing to build momentum is consumers reducing alcohol
   The complexity around health is evolving, with taste the number one consumer                     consumption and consequently we’re seeing more innovation in the adult focused soft
   motivation for drinking a soft drink, meaning that delivering healthier drinks which             drinks space.
   also deliver on taste is challenging for both manufacturers and retailers.
                                                                                                    This innovation is coming from both alcohol and soft drinks manufacturers and is likely
   In July 2018, the ‘Big 4’ along with Co-op introduced the U16 voluntary ban on energy            to continue apace in 2019.
   drinks and there will be more to tell once consultation is completed and the outcome
   presents itself.                                                                                 Another important area of soft drinks innovation has been in the water arena, with
                                                                                                    manufacturers looking to address consumers’ desires for natural and artificials-free
   With traditional energy drink sales under the spotlight, people are moving towards               products that deliver on taste. Equally we have seen some more high profile launches
   healthier options and natural energy drinks are gaining favour with the newly emerged            in the sustainable water arena. Shoppers are responding positively to this innovation
   ‘natural energy’ category predicted to be worth £206m over the next five years (+26%             which is helping them to hydrate more healthily, and innovation in this area is likely to
   in 2023 versus 2018)20.                                                                          increase. Robinsons innovation in these healthier categories has also meant that the
                                                                                                    brand overtook Coca-Cola as the most consumed brand in home in 2018.11

                 2018 Market            The Year In            Channel             Key Grocery            2019 And            Future Drivers                Future                                  Def initions
Welcome                                                                              Sof t Drink          Beyond In                                                         Conclusion                                           Data             Sources
                  Inf luences            Numbers             Performance            Inf luences            Grocery            In Sof t Drinks               Outlook                                 & Glossary
10

   Premiumisation                                                                                                                                      Range rationalisation
   Premiumisation means different things to different shoppers and isn’t just about higher quality products.                                           Under ongoing pressure to reduce costs, some retailers have
   Shopper groups are willing to pay more for products with added health benefits, that are good for the                                               adopted range rationalisation strategies, aimed at improving
   environment and community, have more convenient on the go formats and for drinks that elevate their drinking                                        in-store operational efficiencies and overall supply chain
   experience.                                                                                                                                         profitability. Reducing range has also undoubtedly improved
                                                                                                                                                       clarity at soft drink fixtures and makes it easier for shoppers,
   Consumers are increasingly under time pressure and are looking to savour every moment of enjoyment. We also                                         but the challenge remains in delivering efficiencies whilst
   know that ‘experience’ is becoming more important to consumers. This has created an opportunity to deliver                                          ensuring the right choice is offered to the consumer.
   great tasting and better quality products which shoppers are willing to pay more for, adding value to both the
   consumer experience and the category.                                                                                                               The process of reviewing the range, on an ongoing basis,
                                                                                                                                                       is critical in ensuring the right choice is constantly offered,
   Squash, adult soft drinks and mixers were the categories most successful in achieving this in 2018. In squash,                                      delivering against the current and emerging needs of
   through Robinsons’ introduction of Creations and Cordials ranges, shoppers were successfully traded up into the                                     consumers. Product ranges with clear positioning and defined
   “better” and “best” tiers, resulting in strong overall value growth of the category.                                                                roles within the range will remain as critical as ever to
                                                                                                                                                       delivering a loyal shopper base.
   Mixers has almost doubled in size in grocery over the past three years10 and this
   is primarily due to the growth of the premium tier driven by Fever Tree. As the
   premium tier becomes more established, this in turn creates an opportunity for the
   emergence of a super-premium tier, similar to what has developed in other FMCG
   categories such as alcohol. Adult soft drinks has also seen a resurgence this year,
   with growth of the sub category driven both by mainstream and premium brands.10

                2018 Market            The Year In            Channel             Key Grocery          2019 And      Future Drivers    Future                       Def initions
Welcome                                                                             Sof t Drink        Beyond In                                 Conclusion                                     Data                 Sources
                 Inf luences            Numbers             Performance            Inf luences          Grocery      In Sof t Drinks   Outlook                      & Glossary
11
2019 AND BEYOND
IN GROCERY
Although the Grocery channel is predicted to grow this year,
recent forecasts from IGD13 predict this will largely be driven by
Discounters remain Supermarkets hold strong
inflation rather than by volume or consumption increases. in growth but differentiation urged
Long-term market predictions are currently very difficult Whilst the consumer switch from supermarkets to discounters Outside of the online and discounter channels it is important to
because of the uncertainty around Brexit, however consumers has slowed, discounters are still expected to be the second recognise that approximately half of the growth over the next five
are likely to see higher grocery prices and household incomes fastest growing channel, increasing through shopper penetration years in grocery is expected to come from the supermarket and
squeezed, issues already giving them cause for concern. as well as trips, with IGD forecasting their share to grow to convenience channels.13
14%+ over the next five years.13
However, consumers have also said they haven’t yet noticed or What is becoming increasingly clear is that, in order to win in this
felt the pinch of higher prices.13 With half of the UK population now visiting a discounter15, but increasingly competitive environment, grocery retailers will need
with this type of retailer reliant on relatively less loyal shoppers, to continue to establish a point of difference to their competitors,
the channel’s key opportunity is likely to be in enhancing the whether that be through price, premiumisation, community or
shopper experience to better satisfy the needs of the modern experience.
The fastest-growing channel in consumer.
grocery is expected to remain as Retailers understanding of shopper behaviour and motivations at
online, predicted to grow by Whilst discounters can compete on price, the ‘Big 4’ an ever-increasing depth will be vital in enabling success through
supermarkets have a key advantage during event periods such as connecting with and continuing to engage more fully with shoppers.
50%
Halloween, Easter and Christmas, along with a greater breadth
more than 14 of product choice, including growth areas likely to become core
areas in the future.
in the next five years to take
a share of approximately
7.5% 14
In his announcement of the M&S delivery deal with Ocado in
February, M&S CEO, Steve Rowe, describe it as “a new era in
online grocery shopping”.
As a particularly important channel for soft drinks, with online
already accounting for 11% of category sales15, the industry
needs to keep pace with future trends and technological
advances such as voice recognition to maintain its momentum.
Key Grocery     2019 And                                             Def initions
          2018 Market    The Year In     Channel       Sof t Drink   Beyond In   Future Drivers    Future
Welcome                                                                                                      Conclusion   & Glossary     Data   Sources
Inf luences Numbers Performance Inf luences Grocery In Sof t Drinks Outlook12
FUTURE DRIVERS IN SOFT DRINKS
Health & Wellness
A key pillar for the growth of soft drinks, health &
wellness encompasses many platforms:
hydration
“Natural’ drinks Adult soft drinks Energy drinks
At its core, the soft drinks category plays a pivotal
The trend of declining alcohol consumption, A number of increasingly discerning consumers
role in helping to hydrate the nation, and as
particularly amongst Millennials, presents are now prioritising products that offer
awareness and appreciation, by an increasing number
an opportunity for the category to provide functional benefits or fortification, such as
of the population, grows of the importance of staying
natural solutions in the form of adult soft drinks. natural energy. However, as much as these
hydrated, the opportunity is in ensuring soft drinks are
However, there is a need to deliver products consumers are willing to pay extra for these
positioned as a primary solution to satisfy this thirst.
that offer a level of sophistication and benefits they are unwilling to compromise on
taste which are seen as a positive choice taste, meaning that brands in this area need to
Understanding and preference for ‘naturalness’ is
instead of an alcoholic drink and not just clearly deliver on both respects.
increasing among UK consumers, with factors such
an alternative.
as the sugar levy introduction providing both an
opportunity and threat to future growth.
reducing alcohol Increasing publicity of the impact chemical
consumption ingredients such as sugar substitutes can have on the
body and the environment is driving some consumers
to seek reassurance and natural alternatives.
With increasing government focus - through the introduction of the levy - on the nation to decrease their sugar
Providing shoppers with this reassurance and product intake to help tackle the growing health issues of the population, many soft drink manufacturers responded to
choices in this area will help in unlocking further the planned introduction of the levy by reducing sugar and calories from their products.
growth.
functional However, even before the levy was introduced last April there was already a significant shopper shift towards
healthier product categories such as no and low sugar and plain and flavoured water.
benefits
Whilst it is important that retailers recognise this change and adjust range and space accordingly to remain
‘future-proof’, it also presents a clear commercial opportunity as the sugar-free shopper spends more, visits
more often and buys more volume than the full sugar shopper15. A healthy category really does make for a
healthier return.
sugar
Key Grocery 2019 And Def initions
2018 Market The Year In Channel Sof t Drink Beyond In Future Drivers Future
Welcome Conclusion & Glossary Data Sources
Inf luences Numbers Performance Inf luences Grocery In Sof t Drinks Outlook13
Value for money
Soft drinks, as a category, offers great value for money, e.g.
cost per serve for dilutes.
As shoppers and consumers become more discerning and
choiceful, they are prepared to trade up accordingly when
they perceive a product to offer added value.
This added value can stem from a number of factors,
including taste, format, ingredients (e.g. Robinsons
Cordials & Fruit Creations ranges), provenance, sourcing
and experience, and therefore offers a number of growth
platforms for the soft drinks category.
Recent examples of where added value has driven
premiumisation, include the mixers, dilutes, water and
adult soft drinks categories where high quality, better-
tasting products have successfully delivered sustainable
added value.1
As with the alcohol sector, where increasing premiumisation through
improved quality, craft-sourcing and formats have added value, this is
set to continue in soft drinks too.
Supporting added-value propositions through ranging, space and
display will also help to drive even greater value and premiumisation
into the category, which will not only deliver greater returns but
continue to enhance the image of the category as a solution-driven
one.
Importantly, added value in the form of premiumisation must be a
continuum for soft drinks.
As has been the case in categories such as washing powder, beer,
wines and spirits, today’s premium is tomorrow’s mainstream,
allowing the premiumisation cycle to continue.
As an industry it is important to work together to ensure that value
is continuously created in the category through initiatives that offer
sustainable added value, not just in the perception of the shopper and
consumer, but also in the delivery to them.
Key Grocery 2019 And Def initions
2018 Market The Year In Channel Sof t Drink Beyond In Future Drivers Future
Welcome Conclusion & Glossary Data Sources
Inf luences Numbers Performance Inf luences Grocery In Sof t Drinks Outlook14
Sustainability The UK Plastic Pact
Britvic is a founding member of the UK Plastics
Sustainability is undoubtedly a mega-trend across the world Pact, a pioneering agreement which aims to
today, and a number of initiatives are already in place which transform the plastic packaging system in the UK.
are impacting the grocery market, driven by both government Pact members have committed to a series
and industry. of ambitious targets by 2025:
Sustainability is a key issue for the soft drinks industry
and there is a clear recognition of the need to reduce
the environmental impact, be it through packaging, raw Eliminate problematic or
material sourcing, supply chain efficiencies, energy and unnecessary single-use plastic
water savings or reducing waste. Indeed, many of the major 1 packaging through redesign,
suppliers in the industry have renowned programmes to
innovation or alternative (re-use)
improve sustainability and reduce carbon footprints.
delivery models.
One of the primary opportunities to be more sustainable is
with packaging itself. Packaging plays a fundamental role
in protecting, delivering and preserving the product, and the
industry is working hard to improve levels of recyclability
and using more recycled materials in support of a more 100% of
circular economy for plastics. 2 plasticpackaging to be reusable,
recyclable or compostable.
There is also a number of initiatives and certification
schemes across Europe helping further embed sustainability
into industry supply chains, such as promoting sustainable
agricultural practices, forest stewardship and promoting
CSR.
70 % of
Programmes such as waste segregation, reusable pallets 3 plasticpackaging effectively
and packaging reduction are all helping many of the recycled or composted.
industry’s leaders to move towards the goal of becoming
‘zero waste to landfill’. Since 2015, Britvic has delivered
‘zero waste to landfill’ from its GB manufacturing sites.
Sustainability, as the word implies, is crucial to the soft
drinks category in delivering for its future.Daes dolupti
30 % average recycled
nobisi ommolut eruntur? Qui diaeriti omnihilit, utaspe
4 content across all plastic
packaging.
similiquis utatius am eatus.
Xeribus re perum fugia conseribus ma porerrum eum
quiatectem fuga. Pis quis alita quiatur? Es veliberiti si dolut
inum fugiam fugiae comnim rest imagnietur, culparchic tore
laborem. Ri aspedit, niet lam aut ommoluptam imaxime The pact aims to involve partners across the
doluptio tenis eos endesequunt enis rest quiae volore, tor full plastic value chain to play a part in creating
andae elis atem volorernam eum qui qui idunt ipitin poste a circular economy for plastics and a healthier
venimpo restem apid eos as utem auta perepernatur ratume planet.
videlles solo beaquo maximpe rectaepellat unt dolum ea
More information is available at
www.wrap.org.uk/content/the-uk-plastics-pact
Key Grocery 2019 And Def initions
2018 Market The Year In Channel Sof t Drink Beyond In Future Drivers Future
Welcome Conclusion & Glossary Data Sources
Inf luences Numbers Performance Inf luences Grocery In Sof t Drinks Outlook15
FUTURE OUTLOOK
Sustainability
Environmental issues remain at the forefront of media and consumer concerns. Carlsberg new packaging
A third of shoppers say they have switched to another brand that was more
transparent or environmentally/socially responsible.16
innovation reduces plastic
Younger shoppers are very environmentally conscious, and this will be a big
Snack-pack: reduce plastic waste by more than 1,200 tons a year.
factor for them to consider when purchasing. After the airing of the final episode Reduces the amount of plastic by
76%
of the most recent Blue Planet II series, “reusable bottles” was the most
searched item on Google Analytics and 71% of people, aged 18 to 34, now claim Other improvements include:
to use refillable water bottles every day.17 • Cradle-to-Cradle certified silver inks on bottle lables to improve recyclability.
• New coating on refiliable glass bottles to extend lifespans and reduce
Additionally, sustainability (44%) and sourcing (48%) of ingredients are growing environmental footprint
in importance for people when choosing a meal out of home.18 • New caps which remove oxygen to make beer taste fresher for longer.
Finally, almost half (42%) of consumers want manufacturers to take the lead and
make packaging easy to recycle in future.17
https://carlsberggroup.com/newsroom/carlsberg-launches-ground-breaking-innovations-to-reduce-plastic-waste/
Channel blurring
Retailers need to be conscious of the changing shopping habits of the next generation. The demand
for immediacy will undoubtedly continue to fuel the growth of the Convenience channel, and
retailers will need to cater for this behaviour, offering a broader range of soft drinks, including
bigger take-home packs as well as the usual immediate consumption single pack formats.
Key Grocery 2019 And Def initions
2018 Market The Year In Channel Sof t Drink Beyond In Future Drivers Future
Welcome Conclusion & Glossary Data Sources
Inf luences Numbers Performance Inf luences Grocery In Sof t Drinks Outlook16
Technology
By next year, 30% of web browsing will be done without a screen and by 2021
CONCLUSION
there will be 1.8 billion consumers wordwide using a voice-enabled device19. This
brings new ways of how soft drinks and brands, in particular, will make their way 2018 has undoubtedly been an unprecedented year for the soft drink category. It
into shopping baskets and the key challenge that everyone faces is how they get was an impressive year of growth, buoyed by the warmest summer since 1976.
themselves to the top of search lists to win the virtual basket battle, especially if It was also a year that demonstrated the strength of the industry’s insight and
voice technology adopts substitution techniques. The advancement offers multiple ability to respond to significant challenges such as the sugar levy and the CO2
rewards but also a host of risks. issue.
Looking further into 2019 and beyond we need to recognise the impact of
annualising against these factors, but the scope for future growth of the category
remains huge.
Hyper personalisation
56%
of US and UK consumers say they are Soft drinks appear in only 30% of
more likely to shop at a retailer in-store or grocery shopping baskets, and only feature
online that recognises them by name.20 in one in three consumption occasions15
Personalisation in retail is by no means new. Decades ago, part of the appeal There is still headroom for growth; soft drinks only feature in one in every three
of local shops was the local shopkeeper remembering your preferences and the consumption occasions and is present in only 30% of grocery shopping baskets.
butcher knowing your favourite cut of lamb or beef. The category is also perfectly placed to capitalise on the growing trends of
reducing alcohol consumption along with the rising premiumisation of adult
While the landscape of retail has changed tremendously over the years, the desire for drinks.
personalised experiences remains. What has changed is the move towards offerings,
services and experiences that are more tailored than ever before. Sustainability and the issue of single use plastic is also set to become an
increasingly key focus in the future, but the industry has clearly shown its
While personalisation lends itself very comfortably to online retailing, there is much resilience in meeting challenges such as these and we see the opportunity for
that the bricks and mortar channel could, and needs to do - to stay relevant in an manufacturers, retailers, pressure groups and government to work together for
immensely competitive environment. the rest of 2019 and beyond to continue making further changes for the good.
Hyper personalisation has, to a large extent, become possible thanks to technological And as shopping habits continue to evolve, it will become ever more important
advances. There is no doubt that, for online retailing, technology is the key to for retailers and suppliers to work together in better understanding and satisfying
personalisation. However, in-store it is often ‘just’ an enabler for it. For instance, the needs of today’s shoppers and consumers - the soft drink that they want,
a considered and tailored use of technology in-store can lead to meaningful wherever, whenever.
interaction with store staff who can deliver what online never can - the human
touch and a human brain teasing out what shoppers really want and need.
Key Grocery 2019 And Def initions
2018 Market The Year In Channel Sof t Drink Beyond In Future Drivers Future
Welcome Conclusion & Glossary Data Sources
Inf luences Numbers Performance Inf luences Grocery In Sof t Drinks Outlook17
DEFINITIONS/GLOSSARY
Big 4 Grocery Smoothies
Tesco, Sainsbury’s, Asda and Morrisons As defined by Nielsen, excludes Discounters. Generally drinks described as smoothie, either in brand name or as a de-
scriptor on the packaging. Drinks described as thickie will also be included.
Carbonates Iced Tea & Coffee
A drink made predominantly from carbonated water to which juice or Includes cold soft drinks that are tea and coffee based such as Lipton Ice Sports Drinks
flavourings have been added. Tea. Drinks that are specifically designed to replace minerals, sugars, trace
elements and fluids as a result of exercise. Can include dilutables and
Cola Juice Drinks powders.
Cola-flavoured carbonated drinks, including cola with flavours such as A non-carbonated drink which generally contains fruit juice
cherry, twist of lemon, etc. Includes all clear and coloured colas. (some may not) plus added water or other ingredients. Pure juice Squash
– A non-carbonated 100% pure juice or other juice blend with Concentrated beverage, commonly called squash, cordial or syrup. Must be
Dairy Drinks no added water or sweetener, that may be chilled or longlife. diluted prior to consumption.
Ready to drink milk or milk substitute to which flavouring or juice has been Includes all concentrated juices, with the exception of frozen juice.
added. May consist of any type of milk, regardless of fat content. Stills
Lemonade Collective term for the non-carbonated segments.
Dilutes All conventional clear and cloudy or traditional, carbonated lemonade;
Dilute-to-taste drinks. flavoured with lemon juice and additional fruit flavours to produce coloured Stimulants
lemonade. All ‘energy boosting’ drinks such as Red Bull, normally fizzy.
Energy Drinks
All ‘energy boosting’ drinks such as Red Bull and Monster, normally fizzy. Millennials Water
A term used to describe individuals born between the mid-1980s to the Still or sparkling water with nothing else added.
mid-1990s, those who are now aged between their mid-twenties and
Fruit Flavoured Carbonates
Flavours are typically orange, cherry, lime, blackcurrant, apple, pineapple
mid-thirties. This is the generation that entered adulthood during the first
decade of the millennium
Water Plus / Flavoured Water
and grapefruit, lemon, lemon and lime, tropical and other mixed fruit Sparkling or still flavoured water.
flavours. Also includes Tizer, Dr Pepper and Vimto, as these brands now
contain fruit. Mixers
All drinks intended to dilute an alcoholic beverage, as well as being
consumed as a standalone soft drink.
Gen Z
The demographic cohort after the Millennials. ... Most of Generation
Z have used the Internet since a young age and are comfortable with Non-Fruit Carbonates
technology and social media. There is no precise date for when Generation Non-fruit flavoured carbonates, excluding cola but including Irn Bru. Also
Z begins, but demographers and researchers typically use the mid-1990s to includes traditionals such as cream soda, ginger beer and shandy.
mid-2000s as starting birth years.
Key Grocery 2019 And Def initions
2018 Market The Year In Channel Sof t Drink Beyond In Future Drivers Future
Welcome Conclusion & Glossary Data Sources
Inf luences Numbers Performance Inf luences Grocery In Sof t Drinks Outlook18
DATA
TOP 10 DISTRIBUTORS IN GROCERY VALUE SALES
Volume
Value Sales Value % Value Abs Diff vs Volume % Volume Abs Diff
Sales
(£'000) Chg YA YA (000s) Chg YA vs YA (000s)
('000)
CCE 1,494,518 11.3 151,981 1,237,688 -0.9 -11,355
PRIVATE LABEL 1,342,932 3.3 43,180 2,238,618 2.8 61,218
BRITVIC 741,291 11.4 76,017 703,478 2.7 18,758
LUCZD-RBN-SNTRY 328,090 2.5 8,152 221,613 5.2 10,877
DANONE 283,290 1.6 4,372 332,063 1.3 4,348
INNOCENT 258,440 5.4 13,162 97,131 0.5 531
TROPICANA UK 222,252 2.4 5,245 113,761 -0.2 -205
NESTLE WATERS 199,130 5.2 9,769 385,505 8.9 31,595
RED BULL 145,949 10.3 13,660 37,062 7.2 2,495
BARRS 131,840 11.5 13,578 143,937 13.5 17,142
Key Grocery 2019 And Def initions
2018 Market The Year In Channel Sof t Drink Beyond In Future Drivers Future
Welcome Conclusion & Glossary Data Sources
Inf luences Numbers Performance Inf luences Grocery In Sof t Drinks Outlook19
SOFT DRINKS SEGMENTS PERFORMANCE IN GROCERY
Volume
Value Sales Value % Value Abs Diff vs Volume % Volume Abs Diff
Sales
(£'000) Chg YA YA (000s) Chg YA vs YA (000s)
('000)
COLA 1,311,151 12.6 146,912 1,248,039 -1.9 -24,347
PURE JUICE 871,520 2.5 21,490 619,529 0.6 3,631
PLAIN WATER 644,701 4.7 28,928 1,656,799 5.8 90,829
FRUIT CARBONATES 448,096 10.7 43,473 440,955 1.2 5,190
SQUASHES 438,467 7.9 32,028 382,257 6.5 23,286
DAIRY & DAIRY SUBSITUTE 414,315 5.4 21,223 177,909 3.2 5,583
JUICE DRINKS 400,088 -6.4 -27,580 293,513 -11.9 -39,647
STIMULANT 314,046 3.9 11,831 130,255 -1.5 -1,975
TRADITIONAL MIXERS 250,212 30.8 58,900 228,999 14.1 28,293
KIDS SOFT DRINKS 237,232 -3.5 -8,703 171,823 -8.7 -16,302
SMOOTHIES 235,811 6.1 13,499 67,894 4.4 2,877
WATER PLUS 211,234 12.0 22,680 323,257 8.0 24,017
GLUCOSE 178,469 5.3 8,973 131,431 9.4 11,318
ADULT SOFT DRINKS 153,922 12.0 16,533 69,809 13.1 8,086
NON FRUIT CARBONATES 137,835 9.0 11,390 158,598 3.8 5,835
LEMONADE 124,666 17.4 18,493 289,062 12.5 32,028
COLD HOT DRINKS 98,610 30.0 22,761 26,614 31.3 6,342
SPORTS DRINKS 75,216 6.2 4,366 53,387 2.6 1,361
Key Grocery 2019 And Def initions
2018 Market The Year In Channel Sof t Drink Beyond In Future Drivers Future
Welcome Conclusion & Glossary Data Sources
Inf luences Numbers Performance Inf luences Grocery In Sof t Drinks Outlook20
LEADING BRANDS IN GROCERY
Volume
Value Sales Value % Value Abs Diff vs Volume % Volume Abs Diff
Sales
(£'000) Chg YA YA (000s) Chg YA vs YA (000s)
('000)
COCA-COLA NON ALCHLC BVRGS 896,354 12.5 99,836 752,648 -3.6 -28,277
PEPSI COLA NON ALCHLC BVRGS 386,331 13.4 45,566 418,459 1.7 7,146
PRIVATE LABEL 1,342,932 3.3 43,180 2,238,618 2.8 61,218
FEVER-TREE NON ALCHLC BVRGS 113,853 53.4 39,645 34,418 49.9 11,452
SCHWEPPES NON ALCHLC BVRG 114,722 24.0 22,218 125,080 28.3 27,585
FANTA 123,532 17.4 18,300 113,218 1.1 1,199
ROBINSONS 217,989 7.6 15,466 170,875 1.6 2,693
INNOCENT 247,547 6.3 14,695 93,044 1.2 1,141
RED BULL 145,949 10.3 13,660 37,062 7.2 2,495
HIGHLAND SPG NON ALCHLC BVRGS 88,031 12.6 9,818 187,332 15.5 25,130
LUCOZADE 235,068 4.1 9,162 174,472 6.9 11,315
Key Grocery 2019 And Def initions
2018 Market The Year In Channel Sof t Drink Beyond In Future Drivers Future
Welcome Conclusion & Glossary Data Sources
Inf luences Numbers Performance Inf luences Grocery In Sof t Drinks Outlook21
LEADING BRANDS IN GROCERY [continued]
Volume
Value Sales Value % Value Abs Diff vs Volume % Volume Abs Diff
Sales
(£'000) Chg YA YA (000s) Chg YA vs YA (000s)
('000)
IRN BRU 75,217 11.6 7,826 91,422 13.7 11,034
VIMTO 62,597 13.5 7,429 58,556 17.9 8,905
DR PEPPER 60,065 13.8 7,264 50,548 -1.8 -945
MONSTER 93,902 8.3 7,182 44,531 3.7 1,588
TROPICANA 187,835 3.9 7,002 93,415 1.9 1,782
VOLVIC 81,201 8.7 6,475 129,130 13.3 15,116
PURE LIFE 66,471 7.3 4,515 193,092 11.4 19,717
SAN PELLEGRINO 55,231 6.0 3,142 39,046 6.2 2,271
NAKED 60,626 4.0 2,358 13,497 -1.8 -254
BUXTON NON ALCHLC BVRGS 75,325 3.2 2,311 152,063 6.9 9,858
EVIAN 103,438 1.1 1,124 158,246 -5.0 -8,246
ACTIMEL 93,028 -2.7 -2,583 37,419 -3.3 -1,277
RIBENA 85,803 -3.3 -2,963 43,502 -4.1 -1,855
CAPRI SUN 58,272 -12.9 -8,639 44,153 -22.2 -12,628
Key Grocery 2019 And Def initions
2018 Market The Year In Channel Sof t Drink Beyond In Future Drivers Future
Welcome Conclusion & Glossary Data Sources
Inf luences Numbers Performance Inf luences Grocery In Sof t Drinks Outlook22
GOING FOR GROWTH IN GROCERY
Volume
Value Sales Value % Value Abs Diff vs Volume % Volume Abs Diff
Sales
(£'000) Chg YA YA (000s) Chg YA vs YA (000s)
('000)
COCA-COLA NON ALCHLC BVRGS 896,354 12.5 99,836 752,648 -3.6 -28,277
PEPSI COLA NON ALCHLC BVRGS 386,331 13.4 45,566 418,459 1.7 7,146
PRIVATE LABEL 1,342,932 3.3 43,180 2,238,618 2.8 61,218
FEVER-TREE NON ALCHLC BVRGS 113,853 53.4 39,645 34,418 49.9 11,452
SCHWEPPES NON ALCHLC BVRG 114,722 24.0 22,218 125,080 28.3 27,585
FANTA 123,532 17.4 18,300 113,218 1.1 1,199
ROBINSONS 217,989 7.6 15,466 170,875 1.6 2,693
INNOCENT 247,547 6.3 14,695 93,044 1.2 1,141
RED BULL 145,949 10.3 13,660 37,062 7.2 2,495
HIGHLAND SPG NON ALCHLC BVRGS 88,031 12.6 9,818 187,332 15.5 25,130
Key Grocery 2019 And Def initions
2018 Market The Year In Channel Sof t Drink Beyond In Future Drivers Future
Welcome Conclusion & Glossary Data Sources
Inf luences Numbers Performance Inf luences Grocery In Sof t Drinks Outlook23
BRANDS SUFFERING GREATEST DECLINE
Value Sales Value % Value Abs Diff vs Volume Sales Volume % Volume Abs Diff
(£'000) Chg YA YA (000s) ('000) Chg YA vs YA (000s)
CAPRI SUN 58,272 -12.9 -8,639 44,153 -22.2 -12,628
WEETABIX 12,042 -25.3 -4,086 2,749 -32.1 -1,298
EMERGE 9,618 -28.1 -3,758 7,008 -31.5 -3,216
OCEAN SPRAY 24,504 -11.9 -3,304 17,563 -17.7 -3,770
AQUA PURA 3,639 -47.1 -3,238 12,063 -43.2 -9,172
RIBENA 85,803 -3.3 -2,963 43,502 -4.1 -1,855
ACTIMEL 93,028 -2.7 -2,583 37,419 -3.3 -1,277
RELENTLESS 17,984 -12.3 -2,525 9,893 -9.3 -1,012
JUCEE 4,554 -30.5 -1,995 8,409 -27.5 -3,191
COLDPRESS 1,808 -51.9 -1,951 454 -49.7 -448
Key Grocery 2019 And Def initions
2018 Market The Year In Channel Sof t Drink Beyond In Future Drivers Future
Welcome Conclusion & Glossary Data Sources
Inf luences Numbers Performance Inf luences Grocery In Sof t Drinks Outlook24
TOP 25 NPD LAUNCHES - BY VALUE
Weeks on Sales per week
Rank Brand Sector Value
market (up to first 52)
1 TROPICANA ESSENTIALS BERRY BOOST PURE JUICE 3,436,508 50 68,730
2 TROPICANA ESSENTIALS VITALITY PURE JUICE 2,449,324 50 48,986
3 FEVER-TREE REFRESHINGLY LIGHT LIMITED TRADITIONAL MIXERS 2,177,248 31 70,234
EDITION
4 THE COLLECTIVE GREAT DAIRY DAIRY AND DAIRY SUBSITUTE 1,990,703 34 58,550
5 ALPRO CAFFE DAIRY AND DAIRY SUBSITUTE 1,870,121 48 38,961
6 TROPICANA ESSENTIALS VITAMIN POWER PURE JUICE 1,691,253 49 34,515
7 ROBINSONS FRUIT SHOOT JUICED JUICE DRINKS 1,542,539 46 33,533
8 LARAZADE ENERGY LIMITED EDITION GLUCOSE STIMULANT DRINKS 1,418,625 15 94,575
9 FUZE TEA COLD HOT DRINKS 1,330,492 47 28,308
10 FEVER-TREE REFRESHINGLY LIGHT LEMONADE 1,119,185 41 27,297
11 COCA-COLA ZERO FESTIVE LIMITED EDITION COLA 886,652 11 80,605
12 N-GINE ENERGY GLUCOSE STIMULANT DRINKS 837,108 30 27,904
Key Grocery 2019 And Def initions
2018 Market The Year In Channel Sof t Drink Beyond In Future Drivers Future
Welcome Conclusion & Glossary Data Sources
Inf luences Numbers Performance Inf luences Grocery In Sof t Drinks Outlook25
TOP 25 NPD LAUNCHES - BY VALUE [continued]
Weeks on Sales per week
Rank Brand Sector Value
market (up to first 52)
13 FEVER-TREE REFRESHINGLY LIGHT COLA 812,472 41 19,816
14 BIOMEL DAIRY AND DAIRY SUBSITUTE 808,463 34 23,778
15 RED BULL THE TROPICAL EDITION SUGAR GLUCOSE STIMULANT 726,130 41 17,710
FREE DRINKS
16 WAO GLUCOSE STIMULANT 568,138 38 14,951
DRINKS
17 TROPICANA ESSENTIALS INNER BALANCE PURE JUICE 539,406 49 11,008
18 NO 1 KOMBUCHA COLD HOT DRINKS 509,302 30 16,977
19 NESCAFE AZERA NITRO COLD HOT DRINKS 503,280 33 15,251
20 SCHWEPPES 1783 TRADITIONAL MIXERS 501,701 42 11,945
21 LINDAHLS KVARG DAIRY AND DAIRY SUBSITUTE 491,966 41 11,999
22 WASTE NOT PURE JUICE 384,482 33 11,651
23 MONSTER ESPRESSO COLD HOT DRINKS 358,673 8 44,834
24 RUBICON DELUXE JUICE DRINKS 358,464 42 8,535
25 MONSTER MEGA ENERGY ULTRA GLUCOSE STIMULANT DRINKS 308,762 35 8,822
Key Grocery 2019 And Def initions
2018 Market The Year In Channel Sof t Drink Beyond In Future Drivers Future
Welcome Conclusion & Glossary Data Sources
Inf luences Numbers Performance Inf luences Grocery In Sof t Drinks Outlook26
SOURCES
No. Reference No. Reference
1 Nielsen Scantrack, Grocery Multiples, 52 we 29.12.18 11 Kantar Worldpanel Usage, In Home and Carried Out Consumption, 52 we 02.12.2018
2 Nielsen Scantrack Grocery Multiples Value Sales 52 we 29.12.18 12 Global Data, Premiumisation Report 2018
Nielsen Scantrack, TSR Grocery Multiples (including General Merchandise),
3 YOY Sales Growth, 52 we 29.12.2018 13 IGD 2018
4 Kantar Worldpanel, Spend £000, 52 we 29.12.18 14 IGD Online Store of the Future 2018
5 Nielsen Scantrack Grocery Multiples, 12 we 29.12.18 15 Kantar Worldpanel Take Home Sales 52 we 30th December 2018
6 Kantar Usage Panel % Servings Dat 52 wk to 02.12.18 16 HIM Consumer Poll 2018
7 Kantar Worldpanel Take Home Value Sales 52 we 30.12.2018 17 Kantar World Panel Link Q survey answered by 5,084 Worldpanel Plus panellists. Feb 2018
8 HMRC - SDIL Launch release - 05.04.2018 18 CGA BrandTrack October 2017
9 Nielsen Scantrack, Total Coverage 26 we 27.10.2018 19 Kantar Voicelabs analysis combined with research from CIRP, KPCB and Infoscout
10 Nielsen Scantrack Total Coverage Value Sales 52 we 29th December 2018 20 Britvic Channel State of the Nation
Key Grocery 2019 And Def initions
2018 Market The Year In Channel Sof t Drink Beyond In Future Drivers Future
Welcome Conclusion & Glossary Data Sources
Inf luences Numbers Performance Inf luences Grocery In Sof t Drinks OutlookKey Grocery 2019 And Def initions
2018 Market The Year In Channel Sof t Drink Beyond In Future Drivers Future
Welcome Conclusion & Glossary Data Sources
Inf luences Numbers Performance Inf luences Grocery In Sof t Drinks OutlookYou can also read