STRONG PERFORMANCE IN A TURBULENT YEAR - MERCK FY 2020 RESULTS STEFAN OSCHMANN, CEO MARCUS KUHNERT, CFO KAI BECKMANN, CEO ELECTRONICS - MERCK KGAA

Page created by Virgil Berry
 
CONTINUE READING
STRONG PERFORMANCE IN A TURBULENT YEAR - MERCK FY 2020 RESULTS STEFAN OSCHMANN, CEO MARCUS KUHNERT, CFO KAI BECKMANN, CEO ELECTRONICS - MERCK KGAA
Strong performance in
a turbulent year

Merck FY 2020 results

Stefan Oschmann, CEO
Marcus Kuhnert, CFO
Kai Beckmann, CEO Electronics

March 4, 2021
STRONG PERFORMANCE IN A TURBULENT YEAR - MERCK FY 2020 RESULTS STEFAN OSCHMANN, CEO MARCUS KUHNERT, CFO KAI BECKMANN, CEO ELECTRONICS - MERCK KGAA
Disclaimer

    Cautionary Note Regarding Forward-Looking Statements and financial indicators

    This communication may include “forward-looking statements.” Statements that include words such as “anticipate,” “expect,” “should,” “would,” “intend,” “plan,” “project,” “seek,”
    “believe,” “will,” and other words of similar meaning in connection with future events or future operating or financial performance are often used to identify forward-looking statements.
    All statements in this communication, other than those relating to historical information or current conditions, are forward-looking statements. We intend these forward-looking
    statements to be covered by the safe harbor provisions for forward-looking statements in the Private Securities Litigation Reform Act of 1995. These forward-looking statements are
    subject to a number of risks and uncertainties, many of which are beyond control of Merck KGaA, Darmstadt, Germany, which could cause actual results to differ materially from such
    statements.

    Risks and uncertainties include, but are not limited to: the risks of more restrictive regulatory requirements regarding drug pricing, reimbursement and approval; the risk of stricter
    regulations for the manufacture, testing and marketing of products; the risk of destabilization of political systems and the establishment of trade barriers; the risk of a changing
    marketing environment for multiple sclerosis products in the European Union; the risk of greater competitive pressure due to biosimilars; the risks of research and development; the
    risks of discontinuing development projects and regulatory approval of developed medicines; the risk of a temporary ban on products/production facilities or of non-registration of
    products due to non-compliance with quality standards; the risk of an import ban on products to the United States due to an FDA warning letter; the risks of dependency on suppliers;
    risks due to product-related crime and espionage; risks in relation to the use of financial instruments; liquidity risks; counterparty risks; market risks; risks of impairment on balance
    sheet items; risks from pension obligations; risks from product-related and patent law disputes; risks from antitrust law proceedings; risks from drug pricing by the divested Generics
    Group; risks in human resources; risks from e-crime and cyber attacks; risks due to failure of business-critical information technology applications or to failure of data center capacity;
    environmental and safety risks; unanticipated contract or regulatory issues; a potential downgrade in the rating of the indebtedness of Merck KGaA, Darmstadt, Germany; downward
    pressure on the common stock price of Merck KGaA, Darmstadt, Germany and its impact on goodwill impairment evaluations as well as the impact of future regulatory or legislative
    actions.

    The foregoing review of important factors should not be construed as exhaustive and should be read in conjunction with the other cautionary statements that are included elsewhere,
    including the Report on Risks and Opportunities Section of the most recent annual report and quarterly report of Merck KGaA, Darmstadt, Germany. Any forward-looking statements
    made in this communication are qualified in their entirety by these cautionary statements, and there can be no assurance that the actual results or developments anticipated by us will
    be realized or, even if substantially realized, that they will have the expected consequences to, or effects on, us or our business or operations. Except to the extent required by
    applicable law, we undertake no obligation to update publicly or revise any forward-looking statement, whether as a result of new information, future developments or otherwise.

    This presentation contains certain financial indicators such as EBITDA pre adjustments, net financial debt and earnings per share pre adjustments, which are not defined by International
    Financial Reporting Standards (IFRS). These financial indicators should not be taken into account in order to assess the performance of Merck KGaA, Darmstadt, Germany in isolation or
    used as an alternative to the financial indicators presented in the consolidated financial statements and determined in accordance with IFRS. The figures presented in this statement
    have been rounded. This may lead to individual values not adding up to the totals presented.

1            Merck Q4 20 Results Presentation | March 4, 2021
STRONG PERFORMANCE IN A TURBULENT YEAR - MERCK FY 2020 RESULTS STEFAN OSCHMANN, CEO MARCUS KUHNERT, CFO KAI BECKMANN, CEO ELECTRONICS - MERCK KGAA
Agenda

     Executive summary

     Strategic review

     Financial overview

     ESG update

     Outlook & Guidance

2   Merck Q4 20 Results Presentation | March 4, 2021
STRONG PERFORMANCE IN A TURBULENT YEAR - MERCK FY 2020 RESULTS STEFAN OSCHMANN, CEO MARCUS KUHNERT, CFO KAI BECKMANN, CEO ELECTRONICS - MERCK KGAA
Executive
     summary

01
STRONG PERFORMANCE IN A TURBULENT YEAR - MERCK FY 2020 RESULTS STEFAN OSCHMANN, CEO MARCUS KUHNERT, CFO KAI BECKMANN, CEO ELECTRONICS - MERCK KGAA
Highlights 2020

                           Operations                                         Financials

Healthcare: Mavenclad® 71% org. growth; Bavencio® 57%            FY organic sales: growth of +6.0%
org. growth post Q3 U.S. launch in UC 1L; Fertility back to
growth in Q4 post COVID-19 hit in Q2                             FY organic EBITDA pre: growing +16.8%
                                                                 (+8.4% org. excluding release of Biogen provision)
Life Science: record 12% org. growth, fueled by 22% org.
growth in Process Solutions amid COVID-19, Research (+5%         Guidance delivered:
FY; +16% in Q4) and Applied Solutions (+3% FY; +10% in           Net sales: 17.5 bn
Q4) at elevated year-end levels post COVID-19 dip in Q2          EBITDA pre: 5.2 bn (incl. Biogen €365 m)
                                                                 EPS pre: €6.70 (incl. Biogen €0.63)
Electronics1: Semi above strong market (+14% org.);
even stronger finish of +20% in Q4 marking first quarter of
                                                                 Net financial debt to EBITDA pre further down to 2.1 on
post-trough Electronics growth (+8% org.); Display and           December 31,2020 – continued focus on deleveraging
Surface decline slowing further to -5% and -3% in Q4

1
    Previously: Performance Materials

4             Merck Q4 20 Results Presentation | March 4, 2021
STRONG PERFORMANCE IN A TURBULENT YEAR - MERCK FY 2020 RESULTS STEFAN OSCHMANN, CEO MARCUS KUHNERT, CFO KAI BECKMANN, CEO ELECTRONICS - MERCK KGAA
Guidance delivered

                                                       2020 Guidance     2020 Results

     Net Sales                                         €17.1 – 17.5 bn     €17.5 bn

    EBITDA pre                                         €5.05 – 5.25 bn     €5.20 bn

        EPS pre                                        €6.50 – 6.80        €6.70

5   Merck Q4 20 Results Presentation | March 4, 2021
STRONG PERFORMANCE IN A TURBULENT YEAR - MERCK FY 2020 RESULTS STEFAN OSCHMANN, CEO MARCUS KUHNERT, CFO KAI BECKMANN, CEO ELECTRONICS - MERCK KGAA
All major regions growing amid persisting pandemic impacts

Regional breakdown of net sales [€m]                                                                        Regional organic development

                                                                        Europe     +6.8%                    ▪ APAC: Double-digit growth in Life
                                                                                    org.
                                                                                                              Science and Semiconductor Solutions
                                                            29%
                                                                                                              overcompensates declines in Display
                                                                                                              Solutions, Fertility & Surface Solutions
                                                                                                            ▪ Europe: Growth in Process Solutions
    +9.7%   North America                                  FY 2020                                            and Mavenclad® ramp-up more than
     org.
                                                       Net sales:                                             offsets negative effects of COVID-19
                                                                                       Asia-Pacific +3.0%     on Fertility and Surface Solutions
                                     27%              €17,534 m                                     org.
                                                                           36%                              ▪ North America: Strong Healthcare
                                                                                                              driven by Mavenclad® ramp-up;
                                                                                                              double-digit growth in Life Science
                                                   5%
                                                           3%                                               ▪ Strong General Medicine performance
                            Latin America                                                                     driving growth in LATAM; General
                +7.8%                                           Middle East & Africa   -3.0%
                 org.
                                                                                        org.
                                                                                                              Medicine not fully mitigating negative
                                                                                                              COVID-19 impact in ME&A

6       Merck Q4 20 Results Presentation | March 4, 2021                                                     Totals may not add up due to rounding
STRONG PERFORMANCE IN A TURBULENT YEAR - MERCK FY 2020 RESULTS STEFAN OSCHMANN, CEO MARCUS KUHNERT, CFO KAI BECKMANN, CEO ELECTRONICS - MERCK KGAA
Sustainable dividend growth

Dividend1 development 2014 -2020                                                            2020 dividend

                                                                                        ▪    Dividend of €1.40 (+8% YoY) per
                                                                                             share proposed1 for 2020
                                                                                                                                                        2
                                                                             1.40       ▪    Payout ratio of 23.1% of EPS pre in
                                                        1.25   1.25   1.30                   2020; aiming for 20-25% of EPS pre
                                       1.20                                                                             3
                      1.05                                                              ▪    Dividend yield of 1.0%
      1.00

                                                                                            1Final   decision is subject to Annual General Meeting approval

                                                                                    1       2Excluding Biogen provision release,
      2014            2015             2016             2017   2018   2019   2020            including the provision release the ratio is 20.9%

                                                                                            3Calculated   with 2020 year-end share price of € 140.35 per share.

7    Merck Q4 20 Results Presentation | March 4, 2021
STRONG PERFORMANCE IN A TURBULENT YEAR - MERCK FY 2020 RESULTS STEFAN OSCHMANN, CEO MARCUS KUHNERT, CFO KAI BECKMANN, CEO ELECTRONICS - MERCK KGAA
Strategic
     Review

02
STRONG PERFORMANCE IN A TURBULENT YEAR - MERCK FY 2020 RESULTS STEFAN OSCHMANN, CEO MARCUS KUHNERT, CFO KAI BECKMANN, CEO ELECTRONICS - MERCK KGAA
Healthcare: Delivering on both pipeline and base business commitments

Business performance                                                                                                               Sector highlights
                                                                                                                               ▪ Highly resilient base business
▪ Solid organic sales growth of 3.4%                                                                                             ▪ Fertility: Well-managed return to pre-
  despite significant COVID-19 impact on                                                                                           pandemic levels as of Q3 2020
  Fertility and launch ramp-ups                                                                                                  ▪ Rebif®: Temporary benefit from fewer
                                                                                        EBITDA       pre                 1         switches amid pandemic
                                                                        28.6%                                 28.7%              ▪ General Medicine: Growth despite first China
▪ Swift Mavenclad® recovery from COVID-                                                   Margin
  19 drives 71% organic growth FY and 7%                                                                                           VBP impact on Glucophage® and Concor®
  overall Neurology & Immunology growth                                                                                        ▪ On track for ~€2 bn pipeline sales by 2022
                                                                                      +3.4% organic                              ▪ Mavenclad®: Renewed global momentum
▪ Base business remains about stable in                                                                                            and market share growth
                                                                                           -1.1%
  2020 as General Medicine growth                                                                                                ▪ Bavencio®: U.S. launch in 1L UC in June
  overcompensates heavy COVID-19                                                                                                   driving acceleration of sales growth2
  impact on Fertility                                                                                                            ▪ Tepmetko®: First-in-class approval in Japan3
                                                                                                                               ▪ Significant growth potential beyond 2022
▪ Sales growth, stringent cost management                                    6.7             Sales             6.6               ▪ Bintrafusp alfa: Several non-correlated
  and COVID-19 cost-saving tailwinds drive                                                                                         studies across various tumor types ongoing
                                                                                             [€ bn]
  8% org. EBITDA pre growth (excl.                                                                                               ▪ Evobrutinib: Phase III RMS studies on track
  provision release of €365 m)                                                                                                   ▪ DDR: Leading portfolio with 3 DDR
                                                                                                                                   mechanisms enabling broad optionality
                                                                            2019                             2020
1
 Excluding €365 m Biogen Provision Release, the reported margin is 34.1%; followed by approval by the European Commission on January 25, 2021, and Japan on February 24, 2021;
                                                                        2                                                                                                        3   followed by US FDA
approval on February 3, 2021; Acronyms: DDR = DNA Damage Response, UC = Urothelial Cancer, RMS = Relapsing Multiple Sclerosis

9         Merck Q4 20 Results Presentation | March 4, 2021
Life Science: Leveraging strong position to support global efforts against
COVID-19 on top of underlying growth

Business performance                                                                         Sector highlights
▪ Unprecedented level of growth driven by                                                   ▪ Successful increase in capacity utilization with
  global effort to battle COVID-19 pandemic                                                   flexible shift models to address surging demand

▪ Very strong growth trajectory, albeit more                                                ▪ Major ongoing capacity expansion projects1
  volatile and differentiated across customer                        EBITDA   pre
                                                           31.0%                    32.0%
  and product segments                                               Margin                   ▪ €140 m in Darmstadt, new membrane
                                                                                                production plant for aseptic filters
▪ Acceleration of capacity expansions in                                                      ▪ €100 m in Carlsbad, more than doubling
  response to COVID-19 demand surge                                +11.8% organic               current viral & gene therapy capacity
                                                                      +9.5%                   ▪ €59 m in Madison, among largest single-digit-
▪ Continued strong organic growth, with
                                                                                                ng containment HPAPI2 and ADC3 production
  Process Solutions up 22%, Research
  Solutions up 5% and Applied up 3%                                                           ▪ €40 m in Danvers and Jaffrey, ~700 additional
                                                                                                single-use & filtration production staff
▪ Robust growth in core business despite                               Sales        7.5
                                                             6.9
  lockdowns, plus significant COVID-19                                                      ▪ Significant innovations/launches
                                                                       [€ bn]
  related business (mainly in Process)                                                                   TM
                                                                                              ▪ Bio4C ProcessPad & Orchestrator,
▪ EBITDA pre growth and exceptional margin                                                      VirusExpressTM, BlazarTM, LANEXOTM,
  expansion reflect favorable mix & leverage
                                                            2019                    2020        BrightLabTM, M LabTM Shanghai

                                                                                                 1
                                                                                                   Total committed amounts stated
10      Merck Q4 20 Results Presentation | March 4, 2021                                         2
                                                                                                   High-potent active pharmaceutical ingredients
                                                                                                 3
                                                                                                   Antibody Drug Conjugates
Electronics: Enabling the future in a data-driven world

Business performance                                                                        Sector highlights

                                                                                           ▪ One of most relevant portfolios in industry
▪ Semiconductor Solutions now accounts for
  nearly 60% of sector net sales and continues                                               ▪ Over 100 PORs1 won in Semi Materials in
                                                                                               2020 across all material categories
  to outperform a particularly strong market
                                                                   EBITDA   pre
                                                           31.2%                   30.3%
▪ Successful integration of Versum despite                          Margin                 ▪ Driving innovation to the next level

  pandemic challenge, leading to significant                                                 ▪ ~€25 m investment in next-gen Semi
  further synergy increase and acceleration                                                    Materials center in Korea & €20 m OLED
                                                                   -3.2% organic
                                                                                               production expansion in Korea and China
                                                                    +31.3%
▪ Display Solutions down 12% driven by                                                       ▪ Successful Big Data & machine learning
  COVID-19 impact & high H1 Liquid Crystals                                                    projects with key customers
  comps; stabilization visible in Q4 (-5% org.)
                                                                                           ▪ Continuous focus on customer centricity
                                                                      Sales        3.4
▪ Confirmed commitment to remain around                                                      ▪ Over 15 supplier awards from semi industry
                                                            2.6       [€ bn]
  30% EBITDA pre margin, despite pandemic                                                      leaders in 2020, some 5th consecutive time
  impact on Display and Surface Solutions                                                    ▪ Supplier awards from several leading OLED
                                                                                               customers in 2020
                                                            2019                   2020
                                                                                                1
                                                                                                    Process of Record; specifies series of
                                                                                                    operations a wafer must go through
11      Merck Q4 20 Results Presentation | March 4, 2021
Financial
     overview

03
FY 2020: Overview

Key figures                                                                  (Excl. Biogen provision release)
                                                                                                                 Comments
[€m]                           FY 2019                    FY 2020       Δ     FY 2020                    Δ      ▪ Sales up 9%, driven by accelerating
Net sales                        16,152                   17,534     8.6%                                         double-digit growth in Life Science,
                                                                                                                  Versum portfolio & Healthcare pipeline
EBITDA pre                         4,385                    5,201   18.6%       4,836            10.3%
                                  27.1%                    29.7%     2.5pp                         0.4 pp
                                                                                                                ▪ Strong Life Science performance fuels
 Margin (in % of net sales)                                                      27.6%
                                                                                                                  underlying margin expansion excluding
EPS pre                              5.56                    6.70   20.5%         6.07             9.2%           Biogen provision release

Operating cash flow                2,856                    3,477   21.7%                                       ▪ Operating cash flow up 21.7%, supporting
                                                                                                                  further net debt reduction
[€m]                 Dec. 31, 2019                  Dec. 31, 2020       Δ                                       ▪ EPS pre at € 6.70 (growing 9% excl.
Net financial debt              -12,363                   -10,758   -13.0%                                        Biogen provision release)

                                                                                                                ▪ Working capital at prior year’s level
Working capital                    3,944                    3,938    -0.2%
                                                                                                                ▪ Headcount increase far below sales
Employees                        57,071                   58,127     1.9%                                         growth and largely in emerging markets

13     Merck Q4 20 Results Presentation | March 4, 2021                                                              Totals may not add up due to rounding
6% organic growth in 2020 driven by unprecedented Life Science growth,
swift recovery from COVID-19 in Healthcare and strong Semi performance

 FY YoY Net Sales                                                                                  FY YoY EBITDA pre
                                        Organic             Currency   Portfolio   Total
                                                                                                               16.8%                            6.4%       €5,201 m
 Healthcare                                   3.4%             -3.6%       -0.9%       -1.1%      €4,385 m
                                                                                                                               -4.6%
 Life Science                                11.8%             -2.3%        0.0%           9.5%

 Electronics                                 -3.2%             -0.9%       35.4%      31.3%

 Group                                       6.0%              -2.6%       5.3%        8.6%

                                                                                                    FY 2019    Organic       Currency          Portfolio    FY 2020
▪ Mavenclad® ramp-up and Bavencio® U.S. launch in UC 1L drive
  3% organic growth in Healthcare, while base business remains                                    ▪ Organic EBITDA pre growth significantly faster than
  approximately stable despite pandemic Q2 impact on Fertility                                      sales (8.4% excl. Biogen provision release)

▪ Life Science record 12% organic growth as Process Solutions up                                  ▪ Margin expansion driven by strong Life Science
  22%; Research and Applied delivering 5% and 3%, supported by                                      performance & cost management across all sectors
  particularly strong Q4                                                                          ▪ Margin accretive Versum visibly contributing to
▪ Electronics declining 3%, with turnaround materializing in Q4                                     EBITDA pre growth (Q1-Q3 portfolio; Q4 organic)
  (+8% org.); Semi up 14% (+20% in Q4) Display & Surface                                          ▪ Increasing FX headwinds result in FY drag of 4.6%,
  declining, but stabilizing at lower rates of decline in Q4                                        mainly from USD, BRL and ARS

14       Merck Q4 20 Results Presentation | March 4, 2021                                                        Totals may not add up due to rounding
FY 2020: Reported figures

Reported results                                                             (Excl. Biogen provision release)
                                                                                                                Comments
[€m]                            FY 2019                   FY 2020      Δ      FY 2020                     Δ
EBIT                                  2,120                 2,985   40.8%          2,620          23.6%         ▪ Top line-driven EBIT increase
                                                                                                                  supported by Versum portfolio effect
Financial result                       -385                  -354   -7.9%
                                                                                                                ▪ Financial result mainly driven by
Profit before tax                     1,735                 2,630   51.6%          2,265          30.5%           deleveraging

Income tax                             -440                  -637   44.8%            -545         24.0%         ▪ Effective tax rate within guidance
                                                                                                                  range of ~24-26%
Effective tax rate (%)              25.3%                  24.2%    -1.1pp
                                                                                                                ▪ Net income and EPS reflect EBIT
Net income                            1,320                 1,987   50.5%          1,713          29.8%
                                                                                                                  growth & better financial result,
EPS (€)                                 3.04                 4.57   50.3%             3.94        29.6%           further elevated by provision release

15     Merck Q4 20 Results Presentation | March 4, 2021                                                          Totals may not add up due to rounding
Q4 Healthcare: 4% organic growth driven by Mavenclad® and Bavencio ®
while base business about stable following Fertility recovery

Healthcare P&L                                                                                         Net sales bridge
 [€m]                                 IFRS                                   Pre                        €1,800 m       4.1%                                                            €1,738 m
                           Q4 2019            Q4 2020             Q4 2019          Q4 2020                                                             -6.1%               -1.5%
 Net sales                    1,800              1,738              1,800             1,738
       *
 M&S                            -595               -449               -595              -414
                                                                                                              Q4 2019              Organic             Currency            Portfolio    Q4 2020
 Admin                            -90                -84                -81               -80
 R&D                            -462               -479               -461              -454           EBITDA pre bridge
                                                                                                         €561 m       7.7%                                                             €525 m
 EBIT                            351                 305                372               397
 EBITDA                          541                 433                 -                  -                                                         -12.7%               -1.4%
 EBITDA pre                      561                 525                561               525
 (in % of net Sales)            31.2%              30.2%              31.2%             30.2%                 Q4 2019              Organic             Currency            Portfolio    Q4 2020
Comments
▪ Mavenclad® growing 48% organically, further expanding shares in still                                ▪ General Medicine1 growing 3% despite China VBP impact
  suppressed dynamic market; Rebif® declining 12% in Q4, better than                                   ▪ Strong cost savings in M&S further supported by reduced face-to-
  the underlying trajectory                                                                              face activities and lower amortization of intangibles
                                                                                                   ®
▪ Oncology up 20%, Bavencio® +90% post U.S. launch in UC 1L; Erbitux ▪ Significant savings in R&D coming from continued prioritization; all
  at +13% supported by temporary supply agreement with Eli Lilly for U.S. projects on track despite COVID-19
▪ Fertility returns to growth (+1%) against strong Q4 2019; regional     ▪ EBITDA pre and margin burdened by FX effect of -13%
  picture remains mixed with Europe and ME&A still impacted and declining
                                                              *
                                                                  Marketing and selling expenses         1
                                                                                                             includes CardioMetabolic Care & General Medicine and others
16         Merck Q4 20 Results Presentation | March 4, 2021                                                  Totals may not add up due to rounding
Q4 Life Science: up 19% with unprecedented growth in Process Solutions
further boosted by acceleration in Research and Applied

Life Science P&L                                                                                   Net sales bridge
 [€m]                                 IFRS                                   Pre
                                                                                                                  19.3%                                 0.0%           €2,030 m
                                                                                                    €1,783 m
                           Q4 2019            Q4 2020             Q4 2019          Q4 2020                                                   -5.4%
 Net sales                    1,783              2,030              1,783             2,030
 M&S
       *
                                -490               -531               -490              -529                                                                        +0.0%
                                                                                                      Q4 2019             Organic            Currency   Portfolio       Q4 2020
 Admin                          -102                 -76                -80               -73
 R&D                              -78                -87                -78               -86      EBITDA pre bridge
 EBIT                            329                 451                344               457                    25.5%                                                 €653 m
                                                                                                     €549 m
 EBITDA                          534                 650                 -                  -                                                -6.4%      -0.1%
 EBITDA pre                      549                 653                549               653
 (in % of net Sales)            30.8%              32.2%              30.8%             32.2%         Q4 2019             Organic            Currency   Portfolio       Q4 2020
Comments
▪ 27% growth in Process Solutions driven by downstream and single use, ▪ Declining M&S in % sales, despite higher logistics cost due to pandemic
  strong underlying demand further elevated by fight against COVID-19  ▪ Flat R&D in % of sales with continued focused investments in strategic
▪ Research Solutions accelerating to 16% organic growth, driven by       projects in high growth & emerging segments
  COVID-19 diagnostics and year-end recovery                           ▪ Business performance, operational leverage and favorable mix drive
▪ Applied Solutions accelerating to 10% growth across the full portfolio                            strong EBITDA pre and margin expansion
  driven by additional COVID-19 demand and year-end recovery

                                                              *
                                                                  Marketing and selling expenses
17         Merck Q4 20 Results Presentation | March 4, 2021                                          Totals may not add up due to rounding
Q4 Electronics: Organic growth in Semi overcompensates COVID-19 impact,
underlying Display decline and FX headwinds

Electronics P&L                                                                                    Net sales bridge
 [€m]                                 IFRS                                   Pre                     €798 m        8.0%                                  0.0%           €831 m
                           Q4 2019            Q4 2020             Q4 2019          Q4 2020                                                    -3.9%
 Net sales                       798                 831                798               831
 M&S
       *
                                -136               -136               -136              -132                                                                         +0.0%
                                                                                                       Q4 2019             Organic            Currency   Portfolio       Q4 2020
 Admin                            -39                -41                -38               -34
 R&D                              -73                -68                -69               -66      EBITDA pre bridge
 EBIT                              14                  79               107               108        €243 m                7.8%                          0.0%           €246 m
 EBITDA                          149                 228                 -                  -                                                 -6.5%
 EBITDA pre                      243                 246                243               246
 (in % of net Sales)            30.5%              29.6%              30.5%             29.6%          Q4 2019             Organic            Currency   Portfolio       Q4 2020
Comments
▪ Semiconductor Solutions: 20% organic growth, now fully including   ▪ Year-end inventory management post COVID-19 impact on Display and
  Versum; strong underlying demand further supported by DS&S phasing   Surface drives lower gross margin from underabsorption of fixed costs
▪ Display Solutions: decline further tapering down to -5% with Liquid                              ▪ M&S, Admin and R&D all down amid growing sales, continuing to reflect
  Crystals closer to the underlying trajectory                                                       diligent underlying cost management as part of Bright Future
▪ Surface Solutions: stabilizing further at -3% with COVID-19 impact                               ▪ Increase in EBITDA pre driven by sales growth and stringent cost
  easing but still weighing on cosmetics end markets                                                 management while EBITDA pre margin burdened by FX headwinds

                                                              *
                                                                  Marketing and selling expenses
18         Merck Q4 20 Results Presentation | March 4, 2021                                           Totals may not add up due to rounding
Electronics: Successful transformation into a business supplying
a broad base of leading electronic players

Net Sales [ in €m ]
                                                                   Best-in-class portfolio of capabilities
Net Sales share [ in % ]
                                                           3,380
     Surface Solutions                                     11%     ▪ Transformed from focused investments and
     Semiconductor Solutions                                         acquisitions
     Display Solutions
                                                                   ▪ Now close to 90% of business in electronics
                                                                     with diversified portfolio
                                                           56%
      1,644                                                        ▪ A leading materials, services &
       24%                            ~90%                           equipment provider to semi industry
                             Electronics                           ▪ Innovation & market leader in LC and a
       76%                                                           leading materials supplier in OLED
                                                           33%
                                                                   ▪ Transformation proofpoint: return to growth
                                                                     (+8% org. in Q4) post 6 quarters of decline
      2013                                                 2020

19      Merck Q4 20 Results Presentation | March 4, 2021
Innovation in electronics industry is driven at the atomic level
enabling smaller, faster & more energy efficient solutions

 Continued                                              Proven, deep expertise warrants
 and growing                                            strong outlook
 materials
 importance                                             ▪   Technology trends merely reinforced by work-
                                                            from-home & learn-from-home
 in electronics
 industry                                               ▪   Upgraded Electronics mid-term guidance to
                                                            3-4% CAGR at September Capital Markets Day

                                                        ▪   Upgraded Versum synergy targets twice in
                                                            2020 & again today

                                                        ▪   Even stronger outlook for 2021 reflected in
                                                            today’s guidance

20   Merck Q4 20 Results Presentation | March 4, 2021
Electronics
Successful integration drives substantial synergy upgrade and acceleration

EBITDA pre impact of synergy ramp-up [€ m]                                                                     Sources of synergies

     ~50                                     ~83                                 ~95

                                                                                   10                             Business        • Transform country setup
                                               8                                   10                           Optimization      • Streamline duplicate structures

                                               35

      30                                                                           75                                             • Optimize production and
                                                                                        ~75                     Procurement         supply chain network
                                              40                                                               and Supply Chain   • Achieve savings through joint
      20
     ~20
                                                                                                                                    procurement

     2020                                  2021                                 2022

       Original cost                  Accelerated & additional             Additional from
                                                                                                                                  • Integrate corporate &
       synergy target                 cost synergies                       top-line synergies*
                                                                                                               Corporate and        administrative functions
                                                                                                               Administrative
                  Original target for 2022 is now                                                                Functions        • Cost savings due to U.S. company
                                                                                                                                    delistings
                  being addressed for 2021
           *
               Top-line synergies from cross-selling, new products introductions and overarching initiatives
21             Merck Q4 20 Results Presentation | March 4, 2021
Balance sheet

                                                 Assets [€bn]                            Liabilities [€bn]
                                      43.8                                                                  43.8
                                               0.8          41.8                 41.8
Cash & cash equivalents            3.5                                1.4
              Receivables                3.3               3.2
              Inventories                                     3.3                                           17.9           Net equity
                                                                                  17.0

       Intangible assets              26.3                   23.6
                                                                                  12.1                      13.2           Financial debt

                                                                                  2.4                        2.6           Payables/refund liabilities
         Property, plant                                                          4.0                        3.3           Provisions for employee benefits
                                         6.2                    6.4
           & equipment
                                                                                  6.2                        6.8           Other liabilities
            Other assets                 3.7                    3.9
                                    Dec. 31                Dec. 31              Dec. 31                    Dec. 31
                                     2019                   2020                 2020                       2019
 ▪ Significant decline in intangible assets, primarily driven by FX         ▪ Stable equity ratio of 41%
 ▪ Higher cash level in order to secure liquidity in the face of the        ▪ Strong operating cash flow in 2020 drives financial debt reduction of
   COVID-19 pandemic and related uncertainties, driven by strong              more than €1 bn
   operating cashflow

22      Merck Q4 20 Results Presentation | March 4, 2021                                                   Totals may not add up due to rounding
Q4 operating cash flow nearly doubling from a depressed Q4 2019 level

Q4 2020 – cash flow statement                                                           Cash flow drivers

[€m]                                                      Q4 2019   Q4 2020       Δ    ▪ Lower D&A largely driven by reduced
                                                                                                                           ®
                                                                                         amortization of intangibles (Rebif )
Profit after tax                                             321       440      119
                                                                                       ▪ Changes in provisions reflect Healthcare
D&A                                                          552       496      -57      restructuring accruals & LTIP* effects
Changes in provisions                                         19       185      166    ▪ Q4 19 other assets & liabilities elevated
                                                                                         by cash neutral tax receivables
Changes in other assets/liabilities                          -405      -48      357    ▪ Working Capital contribution mainly
                                                                                         driven by lower trade receivables across
Other operating activities                                    42       -60     -101
                                                                                         all sectors
Changes in working capital                                   161       275      114    ▪ Q4 2019 elevated investing cash flow
                                                                                         reflects Versum acquisition while Q4
Operating cash flow                                          690     1.288      598      2020 is reduced due to reversal of Q3
                                                                                         temporary investment of excess cash
Investing cash flow                                        -4.744      -98    4.646
                                                                                       ▪ Financing cash flow reflects strong
 thereof Capex on PPE                                        -221     -609     -388      deleveraging in reduced bank loans and
                                                                                         commercial papers
Financing cash flow                                          -273   -1.381    -1.108
                                                                                           *Long Term Incentive Plan
23     Merck Q4 20 Results Presentation | March 4, 2021                                     Totals may not add up due to rounding
Outlook &
     Guidance

04
Underlying COVID-19 assumptions for 2021 guidance

Merck Group
▪ Increasing penetration of vaccination across large populations in all major regions as of summer
▪ Global gradual easing of lockdowns; virus mutations not to significantly invalidate vaccination efforts
▪ Overall improvement in the course of 2021; however, higher degree of forecast uncertainty
                                                         Healthcare assumptions
                                                         ▪   Confirm ~ stable (org.) base business and pipeline sales target, despite
                                                             higher uncertainty
                                                         ▪   Pandemic impact on ramp-ups (particularly in suppressed MS high efficacy
                                                             market) expected to ease significantly, but remains a watch out
                                                         ▪   Fertility expected to continue recovery

                                                         Life Science assumptions
                                                         ▪   Continued additional demand in Process Solutions
                                                         ▪   Research and Applied Solutions more volatile and differentiated across
                                                             customer and product segments, but overall neutral to positive

                                                         Electronics assumptions
                                                         ▪   Neutral to positive impact on Semiconductor Solutions end markets
                                                         ▪   Display and Surface Solutions to return to underlying trajectories

25    Merck Q4 20 Results Presentation | March 4, 2021
Merck Group
Qualitative full-year 2021 guidance

                                                                                       Net sales:
                                                                           Strong organic growth
                                                                       Adverse FX of -2% to -5% YoY

                                                                                     EBITDA pre:

                                             Organic: high single-digit to low teens growth (excl. Biogen1)
                                                             Adverse FX of -2% to -5% YoY

                                     1
                                      Q3 20 Reversal of the provisions for the patent dispute proceedings for Rebif in the amount of ~€365m;
                                     Guidance incl. Biogen: slight to moderate organic growth

26   Merck Q4 20 Results Presentation | March 4, 2021
Merck Group
Key earnings drivers to remember for 2021

            EBITDA pre - supporting factors                           EBITDA pre - reducing factors

▪    Increasing Mavenclad® & Bavencio® contribution         • Glucophage® impacted by VBP in China

▪    Ongoing strength in Life Science with robust base      • Continued decline of liquid crystals and Rebif®
     business and additional COVID-19 demand

▪    Continued strong outlook in Semiconductor Solutions
     with above-market organic sales growth

▪    High level of cost consciousness across all sectors

▪    Milestone payments (e.g. Bavencio®)

              Discipline and prioritization will be key

27       Merck Q4 20 Results Presentation | March 4, 2021
Merck Group
 2021 business sector guidance1

                                                         Net sales                                           EBITDA pre

Healthcare
                                 ▪ Strong organic growth                             ▪ Strong organic growth (excl. Biogen2)
                                 ▪ Mainly driven by                                  ▪ Mainly driven by Mavenclad and Bavencio
                                              ®
                                   Mavenclad and Bavencio®                             sales and continued cost discipline
                                 ▪ Base business organically around stable           ▪ Strong adverse FX

                                                                Net sales                                               EBITDA pre
          Life Science
                                                     ▪ Organic growth in the low teens                         ▪ Organic growth in the low teens
                                                     ▪ Process Solutions as main growth                        ▪ Slight adverse FX
                                                       driver

                               Electronics                              Net sales                                                    EBITDA pre

                                                               ▪ Solid organic growth                                     ▪ Solid to strong organic growth
                                                               ▪ Strong contribution from                                 ▪ Significant to strong adverse FX
                                                                 Semiconductor Solutions
                                                               ▪ OLED with high growth

                                                                               1
                                                                                Divisional guidances are only support to the group guidance and do not have to
 28   Merck Q4 20 Results Presentation | March 4, 2021
                                                                                        2
                                                                               add up; Q3 20 reversal of the provisions for the patent dispute proceedings for
28                                                                             Rebif in the amount of ~€365m; Guidance incl. Biogen: strong organic decline
ESG
     update

05
Sustainability strategy enhanced, leveraging strengths with clear
commitment to new targets

                 Who we are                                                          Targets                                      Integration

Innovation Power                                              Goal #1: Dedicated to human progress                       Integrated
▪   Merck is a leading science and                            In 2030, we will advance human progress for more than      ▪   Part of the overall strategy
    technology company with curious                            1 bn people through sustainable science & technology.     ▪   Linked to steering and operations
    minds dedicated to human progress
                                                              ▪ Sustainable innovations ▪ Impact of our technologies     ▪   Currently built into part of Executive
▪   Long track-record in offering innovative                    and technology for our    and products on health             Board compensation system
    products in attractive markets and                          customers                 and well-being
    serving important megatrends
Pioneering Products                                           Goal #2: Creating sustainable value chains                 Steered & Reviewed
▪    Well-equipped for developing new                           By 2030, we will integrate sustainability into all our   ▪   Executive Board
     product classes: Portfolio of life-                                           value chains.
                                                                                                                         ▪   Supervisory Board
     improving products in all businesses                     ▪ Sustainability ▪ Sustainable   ▪ Securing our social
                                                                                                                         ▪   Corporate Sustainability Committee
▪    Enabling customers incl. scientists and                    culture & values and transparent license to operate
     developers to design next-gen products                                      supply chain    in all regions
Responsible Governance                                                                                                   Communicated
                                                              Goal #3: Reducing our ecological footprint
▪   Resilient operations; sustainable                                                                                    ▪ Development and reporting of
    leadership and risk-mitigation approach                    By 2040, we will achieve climate neutrality and reduce        meaningful KPIs
                                                                           our resource consumption.
▪   Responsibility is in our DNA: reflected by                                                                           ▪   Annual Report, Sustainability Report
    legal form, corporate governance and                      ▪ Climate change &             ▪ Water & resource
                                                                emissions                      intensity
                                                                                                                         ▪   Investor events
    long history of more than 350 years

30         Merck Q4 20 Results Presentation | March 4, 2021                ESG: Environmental, Social, Governance
Reduce our environmental footprint:
Environmental targets 2020 have been achieved, new targets set

                                         Achievements 2020                                                              New targets from 2021
                                                                                                                ▪ Aiming for climate neutrality
Reduce scope 1+2 emissions                            Emissions target 2020 achieved!                             (scope 1 to 3 emissions) by 2040
                                                      ✓ 25% overall reduction for                               ▪ Lower scope 1 and 2 GHG5
                 2020               2020                Scope 1 and 2 emissions in 2020                           emissions by 50% and to source
                 target1:        result1:                                                                         80% of purchased electricity from
                 -20%              -25%                 relative to 2006 (planned: 20%)
                                                                                                                  renewable sources until 2030 vs.
                                                                                                                  2020 baseline
                                                                                                                ▪ Absolute reduction of 1,500 kt6
Reduce water in stressed areas                        Water target 2020 achieved!
                                                                                                                  scope 3 CO2 equivalents by 2030
                                                      ✓ Water use in stressed areas reduced by
                 2020               2020                27% in 2020 vs. 2014 (planned: 10%)                     ▪ Enhancing water efficiency and
                 target2:        result2:
                                                      ✓ By 2020, all production sites4                            improve the new Merck water
                 -10%              -27%
                                                                                                                  intensity score by 10% by 2025
                                                        successfully implemented sustainable
                                                                                                                  vs. 2019 baseline
                                                        water management system
                                                                                                                ▪ Minimize negative environmental
                                                                                                                  impacts, harmful emission
Reduce Merck Waste Score                              Waste target ongoing & on track!
                                                                                                                  residues should be lowered below
                                                      ✓ Based on Merck Waste Score, reduced                       a scientifically defined threshold by
                 2025              2020                 environmental impact by 4.6% vs. 2016                     2030
                 target3:        result3:               (planned: 5% by 2025)
                 -5%              -4.6%
                                                           1versus 2006 baseline, excluding Versum Materials
                                                           2versus                                             5GHG  = Greenhouse Gas
                                                                   2014 baseline
                                                           3versus 2016 baseline                               6corresponds  to ~30% of 2019 scope 3 emissions
31      Merck Q4 20 Results Presentation | March 4, 2021
                                                           4Sites > 70.000 m³/a                                (current estimation incl. Versum Materials)
Next steps towards achieving ESG targets

AGENDA 2020-2022
                                                                                                                                                  2030
Analysis of requirements: Strategy,
business, regulation, stakeholders
                                                                                                                                            targets
                                                                                                                                                                      01

                                                                                                                                                               Goal
Develop SBV tool2 to measure
product sustainability value                                                                                                                       Dedicated
                                                                                                                                                   to human
Link ESG1 to                                                                                                                                       progress
board compensation
                                                                                                                                                                  02

                                                                                                                                                               Goal
Build effective data platform
for internal steering                                                                                                                             Creating
                                                                                                                                                sustainable
Develop ESG KPIs                                                                                                                                value chains
for reporting
                                                                                                                                                                  03

                                                                                                                                                               Goal
Further incorporate ESG in R&D,                                                                                                                  Reducing
controlling, M&A and supply chain                                                                                                              our ecological
                                                                                                                                                 footprint
Decide on dedicated investments
and initiatives to achieve targets
                                                         1ESG:   Environmental, Social, Governance
                                                         2Sustainable   Business Value: Dive in deeper and read the research article on the SBV method
32    Merck Q4 20 Results Presentation | March 4, 2021
Appendix
Additional financial guidance 2021

Further financial details

Corporate & Other EBITDA pre                                    ~ -400 to -470 €m

Interest result                                                 ~ -220 to -245 €m

Effective tax rate                                                  ~24% to 26%

Capex on PPE                                                       ~1.4 to 1.5 €bn

                                                         FY 2021 hedge ratio ~70%
Hedging/USD assumption
                                                                 at EUR/USD ~1.17

2021 Ø EUR/USD assumption                                           ~1.17 to 1.22

34    Merck Q4 20 Results Presentation | March 4, 2021
Financial Update
Balanced maturity profile: Lower refinancing risks & higher flexibility

Maturity profile as of December 31, 2020

 Coupon
                                                                   3.250%
[€ m/US $]                                                         0.125%

                     2.950%
                     1.375%

                                                                   1,600
                                                       1.625%
                                                       3.375%                1.625%                                2.875%
                     1,000                                                                             0.500%
                                                                                                                                   0.875%

                                      0.005%            500                               0.375%

     2.625%
                                                                             1 000                                 1,000
                                                                    750                                 750                         800
                      550              600              500                                600
     317

     2021            2022             2023             2024        2025      2026         2027         2028        2029     2030   2031

                                                       EUR bonds       USD bonds      Hybrids (first call dates)

35        Merck Q4 20 Results Presentation | March 4, 2021
Q4: 11% organic sales growth driven by “BIG 3” (HC pipeline, Process &
Semi Solutions) including strong turnaround in Electronics

 Q4 YoY Net Sales                                                                       Q4 YoY EBITDA pre
                                     Organic        Currency    Portfolio   Total
                                                                                                    12.1%
 Healthcare                               4.1%          -6.1%      -1.5%       -3.5%    €1,206 m                                                €1,245 m
                                                                                                                    -8.0%            -0.9%
 Life Science                           19.3%           -5.4%       0.0%      13.9%

 Electronics                              8.0%          -3.9%       0.0%        4.1%

 Group                                 11.0%           -5.4%      -0.6%        5.0%

                                                                                         Q4 2019    Organic        Currency         Portfolio   Q4 2020
▪ Healthcare continuous organic growth with Mavenclad® up 48%,
  Bavencio® growing 90% org., General Medicine & Endocrinology                         ▪ At 12% EBITDA pre growing faster than sales
  slightly positive; Fertility back in organic growth territory                          despite lower non-recurring income
▪ Process Solutions underlying strength again amplified by COVID-19                    ▪ Cost discipline in all sectors further supported by
  business with 27% organic growth; Research elevated to +16%;                           reduced face-to-face activities amid pandemic
  Applied Solutions growing by exceptionally high 10%                                  ▪ FX burden of -8% across various currencies with
▪ Semiconductor Solutions growing 20% organically, outperforming                         largest impact from USD, BRL and ARS; partially
  strong market (supported by DS&S order patterns); Display (-5%)                        mitigated by hedging
  and Surface Solutions (-3%) decline slowing down further

36       Merck Q4 20 Results Presentation | March 4, 2021                                             Totals may not add up due to rounding
Q4 2020: Overview

Key figures                                                                           Comments
[€m]                                       Q4 2019             Q4 2020         Δ    ▪ 11% organic sales growth driven by all
Net sales                                        4,381           4,599      5.0%      three sectors muted by -5% FX headwinds

EBITDA pre                                       1,206           1,245      3.3%    ▪ EBITDA pre growing 3% despite significant
 Margin (in % of net sales)                     27.5%           27.1%      -0.4pp     FX burden of -8% which is also slightly
                                                                                      impacting group margin
EPS pre                                            1.54            1.57     1.9%
                                                                                    ▪ EPS pre growing slower than EBITDA pre
Operating cash flow                                  690         1,288     86.6%      driven by less favorable financial result and
                                                                                      ~€45 m non-adj. Healthcare impairments
[€m]                              Dec. 31, 2019            Dec. 31, 2020       Δ
                                                                                    ▪ Operating cash flow nearly doubling driven
Net financial debt                            -12,363          -10,758     -13.0%
                                                                                      by other assets & liabilities, changes in
Working capital                                  3,944           3,938      -0.2%     provisions and favorable working capital

Employees                                      57,071           58,127      1.9%    ▪ Net financial debt significantly reduced in
                                                                                      line with deleveraging commitments

37     Merck Q4 20 Results Presentation | March 4, 2021                                    Totals may not add up due to rounding
Q4 2020: Reported figures

Reported results                                                                       Comments
[€m]                                                      Q4 2019   Q4 2020       Δ
                                                                                       ▪ Strong performance across all sectors
EBIT                                                          515      611    18.7%
                                                                                         particularly in Life Science drive
Financial result                                              -76       -52   -31.6%     18.7% EBIT growth

Profit before tax                                             439      559    27.5%    ▪ Reduced interest expense drives
                                                                                         improved financial result
Income tax                                                   -103      -119   15.7%
                                                                                       ▪ Effective tax rate temporarily lower
Effective tax rate                                          23.4%    21.2%    -2.2pp     driven by phasing effects

Net income                                                    318      436    37.0%    ▪ Robust EBIT and financial result
                                                                                         improvement drive higher net income
EPS (€)                                                      0.73      1.00   37.0%
                                                                                         and EPS

38     Merck Q4 20 Results Presentation | March 4, 2021                                 Totals may not add up due to rounding
FY Healthcare: Organic growth based on a strong Q1 and a swift recovery
post Q2 dip; EBITDA pre further elevated by €365 m provision release

Healthcare P&L                                                                                     Net sales bridge
 [€m]                                 IFRS                                   Pre                    €6,714 m       3.4%                                                 €6,639 m
                            FY 2019            FY 2020            FY 2019           FY 2020                                                   -3.6%      -0.9%
 Net sales                     6,714               6,639            6,714             6,639
 M&S
       *
                              -2,305             -1,664            -2,303           -1,617                                                                           +0.0%
                                                                                                       FY 2019             Organic            Currency   Portfolio           FY 2020
 Admin                           -344                -320             -329              -313
 R&D                          -1,666             -1,640            -1,663           -1,616         EBITDA pre bridge
 EBIT                          1,149               1,804            1,176             1,889                      26.6%                                                  €2,267 m
                                                                                                    €1,922 m
 EBITDA                        1,896               2,184               -                  -                                                   -8.5%      -0.1%
 EBITDA pre                    1,922               2,267            1,922             2,267
 (in % of net Sales)             28.6%              34.1%             28.6%             34.1%          FY 2019             Organic            Currency   Portfolio           FY 2020
Comments
▪ Mavenclad® swiftly recovered from COVID-19 dip in Q2, back to                                    ▪ M&S decrease through rigorous cost management, supported by
  expanding dynamic shares, however dynamic market remains                                           reduced face-to-face activities amid COVID-19 while expanding
                                                                                                                                                       ®
  suppressed; Rebif® above underlying trajectory towards year-end                                    digital activities; expired amortization of Rebif
▪ Fertility back to pre COVID-19 levels as of Q3 and growing again in Q4                           ▪ Lower R&D reflects ongoing stringent cost control while maintaining
  but picture remains mixed across regions                                                           focus on priority programs
▪ Erbitux® showing organic growth despite pandemic; Bavencio® ramping ▪ Underlying EBITDA pre margin of 28.7% further elevated by €365 m
  up, post U.S. launch in UC 1L and growing 57%                         Biogen provision release to 34.1%
                                                              *
                                                                  Marketing and selling expenses
39         Merck Q4 20 Results Presentation | March 4, 2021                                           Totals may not add up due to rounding
Healthcare organic growth by franchise/product

Q4 2020 organic sales growth [%]                                     FY 2020 organic sales growth [%]
by key product [reported €m]                                         by key product [reported €m]

                                                 268                                                      1.131
                                                              -12%                                                   -9%
                                                        326                                                  1.273

                                           218                                                      903
                                                              +4%                                                    +8%
                                           224                                                      877

                                              255             +13%
                                                                                                    891
                                                                                                                     +6%
                                             237                                                    871

                                    158                       -6%
                                                                                             630
                                                                                                                     -13%
                                     178                                                       743

                               121                            -10%
                                                                                            529                      +4%
                                 146                                                        530

                             111                              +13%
                                                                                           455                       +19%
                             105                                                          402

                                      177                     +48%                          531                      +71%
                                127                                                   321

                      51                                      +90%                  156                              +57%
                    29                                                             103
                             Q4 2020               Q4 2019                                FY 2020         FY 2019

40   Merck Q4 20 Results Presentation | March 4, 2021
Neurology & Immunology: Organic sales growth of 4.5% in Q4 as Mavenclad®
recovery continues
                                                                                                                                       ▪ Highest quarterly sales
                                                                     Mavenclad® TRx1,                                                    since launch
Sales development NDI,                        [€m]
                                                                     [IQVIA, NPA, Weekly View]
                                                                                                                                       ▪ Rx data continues to
                                                                                                                                         trend positively with
          org.        org.       org.        org.        org.
[€m]      17.2%      20.3%       -5.1%       8.9%        4.5%
                                                                                                                                         renewed momentum
                                                                                                                                       ▪ Dynamic volumes still
 500
         453                                            445                                                                              suppressed by ongoing
 450
                     418                    427                                                                                          COVID-19 impact
 400
         127                     372
                     123                    148         177

                                                                 2019-05
                                                                           2019-06
                                                                           2019-07
                                                                           2019-08
                                                                                     2019-09
                                                                                     2019-10
                                                                                     2019-11
                                                                                               2019-12
                                                                                               2020-01
                                                                                                         2020-02
                                                                                                         2020-03
                                                                                                         2020-04
                                                                                                         2020-05
                                                                                                                   2020-06
                                                                                                                   2020-07
                                                                                                                             2020-08
                                                                                                                             2020-09
                                                                                                                             2020-10
                                                                                                                             2020-11
                                                                                                                             2020-12
 350
                                  82
 300

 250
                                                                                     ®
 200                                                                 Rebif               net sales,                [€m]

 150                                                                 350         326
                                                                                               295          290
 100
                                                                     300                                                 279     268   ▪ Rebif® €268 m in
                                                                     250                                                                 Q4 returns to underlying
  50                                                                 200
                                                                                                                                         trajectory with -12% decline
                                                                     150
     0
         Q4 2019    Q1 2020     Q2 2020    Q3 2020     Q4 2020       100                                                               ▪ FX burden of -5% in Q4
                                                                           50
                    ®                           ®                           0
             Rebif                Mavenclad                                     Q4 2019 Q1 2020 Q2 2020 Q3 2020 Q4 2020

41        Merck Q4 20 Results Presentation | March 4, 2021                               1: IQVIA
Mavenclad® launch update: Showing renewed global share momentum,
in a dynamic market that remains suppressed

                                                   ▪    Real world data presented at 2020 ACTRIMS-ECTRIMS reaffirmed confidence in safety profile,
     Increasing confidence in                           demonstrating that Mavenclad patients with COVID-19 are not at an increased risk of severe outcomes
       safety profile during
                                                   ▪    New data presented at ACTRIMS Forum 2021 show Mavenclad-treated patients mount protective
             pandemic
                                                        antibody response to common vaccines (seasonal influenza and varicella zoster)

                                                                                                                                                                       EU4: 17,0%
                                                                                                             US: 6,0%
                                                                                              COVID-19                                                   COVID-19

         Market share gains
         both in US and ex-US

                                                                                                                                                                                      Dynamic High Efficacy
                                                                                                                                                                                      market share (%)1
                                                                  Q3’19    Q4’19    Q1’20     Q2’20      Q3’20   Nov’20         Q3’19   Q4’19    Q1’20     Q2’20    Q3’20    Q4’20
                                                                                                                  -3MR

                                                                                      COVID-19 driven decline of
                                                                                      20-30% in 2020 vs. 2019
        Suppressed dynamic
         market across globe,
        mirroring fluctuations in                                                                                                                                                    2019

            country mobility                                                                                                                                                         2020

                                                                                                                                                                                       US dynamic market
                                                            Jan      Feb      Mar           Apr       May        Jun      Jul    Aug       Sep       Oct       Nov          Dec        volume (R3W)2

1 Non-weighted average used for EU4 as dynamic market sizes/volume not available for all markets, German data only available until Oct’20 and included in Q4’20 average; 2: IQVIA Projected Dynamic
National Claims weekly data through 12/31/2020; Acronyms: 3MR = 3 Months Rolling, R3W = Rolling 3 Weeks
42
,           Merck Q4 20 Results Presentation | March 4, 2021
Oncology: Bavencio® showing strong YoY and sequential growth post U.S.
launch in UC 1L; EU and JP approvals expected to accelerate growth further

                                                                           ®
Sales development Oncology,                              [€m]    Erbitux       net sales,      [€m]              ▪ 13% growth in Q4,
                                                                                                                   supported by temporary
                                                                 300                                               supply agreement with Eli
           org.       org.       org.          org.       org.                                            255
[€m]      8.8%       14.3%       6.3%          7.2%      19.7%   250     237
                                                                                                  217
                                                                                                                   Lilly for U.S.
                                                                                 211     207
                                                                 200
 350
                                                         322     150
                                                                                                                 ▪ FY growth at 6% driven by
                                                                 100
                                                                                                                   solid performance in China
 300      283                                  275                50                                               and emerging markets
                     260         258
 250                                                               0
                                                                       Q4 2019 Q1 2020 Q2 2020 Q3 2020 Q4 2020   ▪ Overall limited negative
 200
                                                                                                                   impact from COVID-19

                                                                               ®
 150
                                                                  Bavencio         net sales, [€m]
 100
                                                                  60                                               ▪ Bavencio® >30% QoQ
                                                                                                         51
  50                                                              50                             42                  growth for last 2
                                                                  40
                                                                         29
                                                                                 33      30                          Quarters driven by 1L UC
     0                                                            30
                                                                                                                     launch in the U.S.
         Q4 2019 Q1 2020 Q2 2020 Q3 2020 Q4 2020                  20
                                                                  10                                               ▪ Launches in EU/Japan to
                                                                   0
            Erbitux
                     ®
                              Bavencio
                                           ®
                                                      Others           Q4 2019 Q1 2020 Q2 2020 Q3 2020 Q4 2020       contribute further

43        Merck Q4 20 Results Presentation | March 4, 2021
Xevinapant
Potential to become standard of care in core area for Merck

   Chart originally presented in 2020 R&D update call; selected, non-exhaustive examples

                                                                                                                                                                                         Worldwide
                                Selected DDR assets
                                                                                                                                          M9831                                          xevinapant in-licensing
            External

                              (incl. M6620/Berzosertib)
                                                                                                                                         (formerly
                                                                         Xevinapant                                                       VX984)3                                        builds on leadership
                                                                           5
                                                                       (IAP antagonist)                                                                                                  in head and neck
                               Adenosine
            Co-Discovery

                               A2aR/A2bR                                                                                                                                                           1. Strategic fit
Discovery

                                inhibitor1

                                  M1231                                       Sonelokinab/M1095
                                                                                                                                                                                                   2. Exploitability
                                (Anti-MUC1/                                       (Anti IL-17
                                EGFR ADC)2                                       Nanobody®)4                                                                                                       3. Clinical &
                                                                                                                                                                                                      commercial
                                      Selected DDR assets                        Bintrafusp alfa                                       PI3K delta
                                     (incl. M3814/Peposertib)                 (anti-PD-L1/TGFβ Trap)                                    inhibitor
                                                                                                                                                                                                      competencies
            Internal

                             Tepotinib (MET                M6223                     Bavencio®                                          Neuro-
                             kinase inhibitor)           (anti-TIGIT)                (Avelumab)                                      degenerative
                                                                                                                                      discovery
                              M5049 (TLR7/8             Evobrutinib
                                                                                                                                       projects
                               antagonist)             (BTK-inhibitor)

                                          Internal                                      Co-Development                                                External                                                         Oncology
                                                                                         Development                                                                                                                Immuno-Oncology
1: In 2017, Domain Therapeutics and Merck entered into a collaboration and licensing agreement for the development of adenosine receptor antagonist drugs specifically designed for oncology and immuno-
oncology; 2: In 2014, Sutro and Merck initiated a collaboration to discover and develop ADCs utilizing Sutro’s cell-free protein synthesis platform, Xpress CF+™. Merck is responsible for drug product, clinical     Immunology
development and commercialization of any resulting products; 3: In 2019, an exclusive license was granted to Vertex for the use of M9831 in gene-editing applications; 4: Avillion conducted Ph II of M1095 in
Psoriasis, Merck decided to out license sonelokinab to a new partner to initiate Phase III development in 2021 5: Inhibitor of Apoptosis Proteins

44                         Merck Q4 20 Results Presentation | March 4, 2021
Xevinapant
Blockbuster potential & meaningful clinical benefit in curative setting

                         Mode of Action1                                                                    Phase 2 Clinical Study Results2

                                                                   ▪    Improvement in OS statistically significant and clinically meaningful:
                                                                        HR 0.49 (0.26–0.92); p=0.0261
                                                                   ▪    mOS not yet reached in xevinapant arm; 5-year extended OS follow-up ongoing
                                                                   ▪    Clinically compelling PFS improvement: HR 0.34 (0.17–0.68); p=0.0023
                                                                   ▪    Addition of xevinapant results in good safety profile, not comprising CRT
                                                                        administration
                                                                                  PFS at 3 years                                OS at 3 years
                                                                                                                                                                                               1
                                                                                                                                                                                                               2               3               4
                                                               1.0                   1              2               3               4                                      1.0              year

                                                                                                                                                   Kaplan-Meier estimate
                                                                                  year          years           years           years                                                                      years           years           years

                                                                                                                        72%
                                                               0.8                                                                                                         0.8                                                     66%

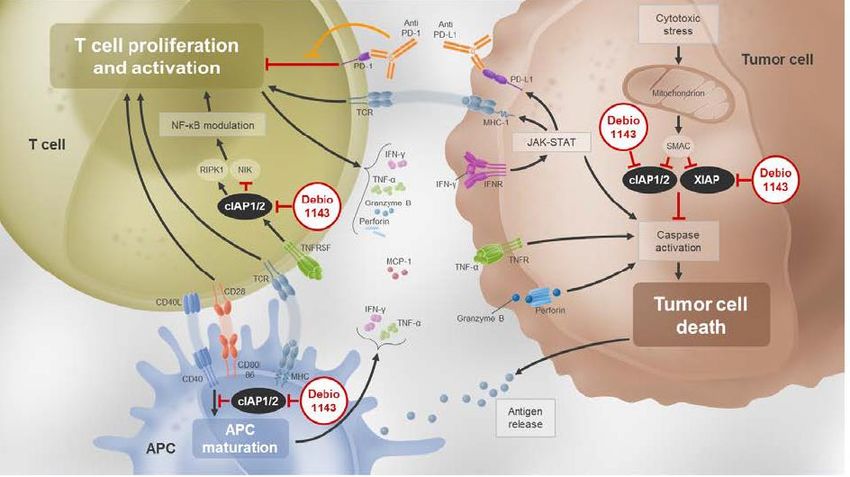
    ▪ Oral Inhibitor of Apoptosis Proteins (IAP)               0.6                                                                                                         0.6
      antagonist: radio- chemo-sensitizer &                                                                             36%
      enhancer of anti-tumor immunity                          0.4                                                                                                         0.4
                                                                                                                                                                                                                                   51%
                                                               0.2                                                                                                         0.2
    ▪ IAP antagonists tackling two cancer hallmarks:
                                                                   0                                                                                                        0
           ▪ Enhancing anti-tumor immunity                             0 2 4 6 8 10 12 14 1618 20 2224 26 28 30 323436 38 40 42 44 46
                                                                                                                                        48 50 52                                 0 2 4 6 8 10 12 14 1618 20 2224 26 28 30 323436 38 40 42 44 46 48 50 52

           ▪ Lowering threshold for tumor cell death                                     PFS duration (months)                                                Xevinapant
                                                                                                                                                                                        Overall survival duration (months)
                                                                                                                                                              Placebo

                                                               2
1                                                               Source: ESMO 2020 - Late Breaking Abstract 39 - 3-years follow-up of double-blind randomized phase II comparing
    Source: Debiopharm
                                                               concurrent high-dose cisplatin chemo-radiation plus xevinapant or placebo in high-risk patients with locally advanced squamous
                                                               cell carcinoma of the head and neck
45          Merck Q4 20 Results Presentation | March 4, 2021
Xevinapant
In-licensing with a total deal-volume of up to ~ €900 m
and industry-typical sales royalties

         Payment type                         Amount (in €)                                                      Accounting treatment2

Upfront payment                                   ~ €190 m      Largest part to be capitalized as an intangible asset

Approval                                                        To be paid and capitalized as an intangible asset upon approval and to be
                                            Up to ~ €380 m1
milestones                                                      amortized once asset is ready for use
Commercial                                                      To be paid and capitalized as an intangible asset, based on sales
                                             Up to ~ €330 m
milestones                                                      thresholds and to be amortized over remaining useful life
Sales                                                  n/a      Merck to recognize sales globally
                                                                For ongoing TrilynX study
                                                                ▪ Cash view: 50/50 cost sharing
R&D Costs                                              n/a
                                                                ▪ P&L view: fully shown in Merck P&L
                                                                2nd study for cisplatin-ineligible patients: Merck incurs 100% of cost
Royalties                                              n/a      Merck to pay industry-typical sales royalty to Debiopharm

1                                                                2
    thereof up to ~€300 m for focus H&N indications                  final accounting treatment is still subject to alignment with auditors

46           Merck Q4 20 Results Presentation | March 4, 2021
Bavencio® UC 1L launch update: Continued inflection in the U.S, recent
EU and Japan approvals expected to further accelerate growth

  ▪     Strong US launch performance:                                                                                Increasing breadth:
                                                                                                            Number of accounts ordering Bavencio®1
        ‒ Increasing breadth & depth of accounts/
           prescriber base
        ‒ Leading share of voice amongst all IOs indicated
           across bladder cancer
                                                                                                                          1L UC approval

  ▪    Recent EMA and Japan approvals:
       − Received on January 22, 2021 and February 24, 2021
          respectively                                                                         Apr-20   May-20   Jun-20   Jul-20    Aug-20   Sep-20   Oct-20   Nov-20    Dec-20

       − Strong base of platinum chemo treatment providing
                                                                                                                     Increasing depth:
          opportunity for Bavencio regimen                                                              Number of Bavencio® vials ordered per account1

  ▪    Significance of transformative OS advantage :
       ‒ Validated by positive reception in community
       ‒ Bavencio® on track to change standard of care within                                                             1L UC approval
          the indicated segment

                                                                                               Apr-20   May-20   Jun-20   Jul-20    Aug-20   Sep-20   Oct-20   Nov-20   Dec-20
1: Source: Bavencio shipment data; Acronyms: IO = immuno-oncology, UC = urothelial carcinoma

47         Merck Q4 20 Results Presentation | March 4, 2021
Bavencio®: Holistic UC 1L treatment sustaining disease control;
maintenance following induction chemo achieving transformative OS benefit

                                    Durable responses to standard of care (1L chemotherapy) are rare
                                with most patients experiencing progression within 9 months of treatment1

                                                                                              Carboplatin or                                                  Complete or partial response, or
                                                                                               Cisplatin 1L                                                     stable disease; eligble for
                                                                    US: ~50%                   treatment:                                                        maintenance therapy:
                                                                                                                                      ~70%                                US: ~6k
                                                                   EU5: ~85%                      US: ~8.5k
                                                                                                  EU5: ~21k                                                             EU5: ~15k
                                            Platinum                                                                                                                      JP: ~5k
                                             eligble:               JP: ~95%                       JP: ~7k

                                            US: ~17k
         Newly
                               85%          EU5: ~25k                                                                                 ~30%
       diagnosed
                                             JP: ~8k                                                                                                                 Show disease progression
        metastatic                                                                                 Other
        UC cases/                                                                                                                                                      during chemotherapy:
                                                                                              chemotherapy or                                                       IO (incl. Bavencio in the US)
       year in the                                                                           Immuno-Oncology
        US: ~20k                                                                                                                                                     approved as 2L treatment
                               15%                                                            (IO) montherapy
       EU5: ~29k
       Japan: ~9k                            Platinum
                                             ineligble
                                                                                                                      •   2 checkpoint inhibitors approved for 1L UC
                                                                                                                          treatment as monotherapy given the high unmet
                                                                                                                          need in 1L UC - labels currently restricted to
                                                                                                                          cis-ineligible, PD-L1 positive patients.

1: Kantar Health Patient Metrics & Kantar Health Treatment Architecture for epidemiological data; IMS Claims, Kantar and IPSOS for triangulation of market shares

48         Merck Q4 20 Results Presentation | March 4, 2021
Fertility: Return to organic growth post Q2 dip, while picture across
geographies remains mixed

                                                                          ®
Sales development Fertility, [€m]                               Gonal-f       net sales,      [€m]

                                                                                                192
           org.       org.       org.        org.        org.
                                                                200
                                                                        178
                                                                                167
                                                                                                                ▪ Fertility portfolio growing
[€m]                                                                                                     158
          3.3%       -3.5%      -38.9%       -1.3%       0.8%
                                                                150
                                                                                                                  again organically vs. strong
 400                                                                                    112                       Q4 2019
                                                                100

 350
          312                               314                  50                                             ▪ FX burden of -5% mutes
                                                        298                                                       absolute numbers
 300                 278                                          0
                                                                      Q4 2019 Q1 2020 Q2 2020 Q3 2020 Q4 2020
 250                                                                                                            ▪ FY still 11% below 2019 as
 200                             190                                                                              lost Q2 sales could not be
                                                                                                                  recovered due to mixed
 150
                                                                 Other Fertility net sales,            [€m]
                                                                                                                  picture across regions
 100
                                                                150    135                             139      ▪ Americas and APAC
                                                                                               122
  50                                                                           111                                growing again in Q4,
                                                                100
                                                                                        78                        majority of Europe
     0
         Q4 2019 Q1 2020 Q2 2020 Q3 2020 Q4 2020                 50
                                                                                                                  recovered as well

                       ®                                          0
             Gonal-f              Other Fertility Products            Q4 2019 Q1 2020 Q2 2020 Q3 2020 Q4 2020

49        Merck Q4 20 Results Presentation | March 4, 2021
General Medicine growing despite VBP impact in China; Endocrinology
impacted by COVID-19 particularly in U.S.

Sales evolution                                                                                          Q4 2020 organic drivers

[€m]      Endocrinology                                                                               ▪ COVID-19 impact in U.S. continues due
                                                                                      Organic           to decline in HIV patient visits and
              99                95
 100
                                                   83          87        84            -8.1%            treatment initiations
     80
     60                                                                                               ▪ Ex-U.S. growth driven by increasing
     40
                                                                                                        diagnosis & treatment of growth hormone
     20
      0                                                                                                 disorders mainly in emerging markets
           Q4 2019            Q1 2020           Q2 2020      Q3 2020   Q4 2020

[€m]      General Medicine*
                                                                                                        ▪ Concor® continues to see anticipated
 600
             588               593                572         574       569                               impact from VBP1 in China, declining
                                                                                      Organic             10% globally
 500
                                                                                       +3.1%
 400                                                                                                    ▪ Glucophage® not fully impacted by VBP
 300                                                                                                      wave 3 yet in Q4; impact anticipated
 200
                                                                                 Glucophage®
                                                                                                          from Q1 2021 onwards
 100         224               234                226         226       218      sales contribution     ▪ Double-digit growth of Thyroid products,
      0
           Q4 2019            Q1 2020           Q2 2020      Q3 2020   Q4 2020                            strengthening leadership in this field

                                                                                           1
                                                                                            Volume Based Procurement
50        Merck Q4 20 Results Presentation | March 4, 2021                                 *includes CardioMetabolic Care & General Medicine and Others
Healthcare Pipeline                                                                                                                                                                                                                                        December 31, 2020

       Phase I                                                                                                                     Phase II                                                                                                                                   Phase III
     berzosertib (M6620)                                      bintrafusp alfa                                                    peposertib (M3814)                                            bintrafusp alfa                                                              avelumab
     ATR inhibitor                                            TGFbeta trap/anti-PD-L1                                            DNA-PK inhibitor                                              TGFbeta trap/anti-PD-L1                                                      anti-PD-L1 mAb
     Solid tumors1                                            Solid tumors                                                       Rectal cancer                                                 Biliary tract cancer 1L                                                      Non-small cell lung cancer 1L
     peposertib (M3814)                                       bintrafusp alfa                                                    tepotinib                                                     bintrafusp alfa                                                              bintrafusp alfa
     DNA-PK inhibitor                                         TGFbeta trap/anti-PD-L1                                            MET kinase inhibitor                                          TGFbeta trap/anti-PD-L1                                                      TGFbeta trap/anti-PD-L1
     Solid tumors2                                            Cervical cancer 1L                                                 Non-small cell lung cancer,                                   Biliary tract cancer 2L                                                      Non-small cell lung cancer 1L8
     M1774                                                    M6223                                                              METex14 skipping                                              bintrafusp alfa                                                              evobrutinib
     ATR inhibitor                                            anti-TIGIT mAb                                                     tepotinib                                                     TGFbeta trap/anti-PD-L1                                                      BTK inhibitor
     Solid tumors                                             Solid tumors3                                                      MET kinase inhibitor                                          Cervical cancer 2L                                                           Multiple sclerosis
     M3258                                                                                                                       Non-small cell lung cancer,                                   bintrafusp alfa
                                                                                                                                 EGFR mutant, MET amplified4                                   TGFbeta trap/anti-PD-L1
     LMP7 inhibitor                                           M5049
     Multiple myeloma                                                                                                            berzosertib (M6620)                                           Triple negative breast cancer
                                                              TLR7/8 antagonist                                                                                                                                                                                               Registration
     M4344                                                    Immunology                                                         ATR inhibitor
     ATR inhibitor                                                                                                               SCLC                                                          M5049
                                                                                                                                                                                               TLR7/8 antagonist                                                             tepotinib
     Solid tumors
                                                              M5717                                                              avelumab                                                      Covid-19 pneumonia                                                            MET kinase inhibitor
     M8891                                                    PeEF2 inhibitor                                                    anti-PD-L1 mAb                                                                                                                              Non-small cell lung cancer, METex14
     MetAP2 inhibitor                                         Malaria                                                            Solid tumors5
                                                                                                                                                                                               sonelokimab (M1095)6                                                          skipping9,10
     Solid tumors                                                                                                                                                                              anti-IL-17 A/F nanobody
                                                                                                                                 avelumab                                                      Psoriasis                                                                     avelumab
                                                                                                                                 anti-PD-L1 mAb                                                                                                                              anti-PD-L1 mAb
                                                                                                                                 Non-small cell lung cancer5
                                                                                                                                                                                               sprifermin
                                                                                                                                                                                                                                                                             Urothelial cancer 1L-M11
            Oncology                                     Changes made post-                                                                                                                    fibroblast growth factor 18
                                                         December 31 cut-off                                                     avelumab                                                      Osteoarthritis
            Immuno-Oncology                                                                                                      anti-PD-L1 mAb
                                                                                                                                 Urothelial cancer5
                                                                                                                                                                                               atacicept7
            Immunology                                                                                                                                                                         anti-BlyS/APRIL fusion protein
                                                                                                                                 bintrafusp alfa                                               Systemic lupus erythematosus
            Neurology                                                                                                            TGFbeta trap/anti-PD-L1
                                                                                                                                                                                               atacicept7
                                                                                                                                 Non-small cell lung cancer 1L/2L
            Global Health                                                                                                                                                                      anti-BlyS/APRIL fusion protein
                                                                                                                                 bintrafusp alfa                                               IgA nephropathy
            Program under out-licensing agreement                                                                                TGFbeta trap/anti-PD-L1
                                                                                                                                 Locally advanced non-small cell
                                                                                                                                 lung cancer
1L, first-line treatment; 1L-M, first-line maintenance treatment; 2L, second-line treatment;
1Includes studies (phase I/II) in collaboration with NCI. 2 Includes studies in combination with avelumab. 3 Includes study in combination with bintrafusp alfa. 4 In combination with osimertinib. 5 Avelumab combination studies with talazoparib, axitinib, ALK inhibitors, cetuximab, or chemotherapy. 6 On September 10, Merck
communicated the out-licensing of sonelokimab to a new partner to initiate Phase III development in 2021. 7 As announced on November 09, 2020, Merck has entered into an out-licensing agreement with Vera Therapeutics. 8 On January 20, 2021, Merck announced the discontinuation of the INTR@PID Lung 037 clinical trial upon review
of the totality of the clinical data and recommendation by the independent Data Monitoring Committee. 9 As announced on August 25, 2020, the US Food and Drug Administration (FDA) has accepted and granted Priority Review to the new drug application in non-small cell lung cancer. 10 As announced on November 26, 2020, the
European Medicines Agency (EMA) has validated for review the application for tepotinib for the treatment of adult patients with advanced non-small cell lung cancer. 11 As announced on December 11, 2020, the Committee for Medicinal Products for Humans Use of the European Medicines Agency adopted a positive opinion recommending
approval of avelumab as monotherapy for the first-line maintenance treatment of adult patients with locally advanced or metastatic urothelial carcinoma.
Unless noted otherwise, clinical programs conducted in collaboration with external partners are not shown unless Merck is the sponsor of that respective trial.

51                 Merck Q4 20 Results Presentation | March 4, 2021                                           Pipeline products are under clinical investigation and have not been proven to be safe and effective.
                                                                                                              There is no guarantee any product will be approved in the sought-after indication.
Bintrafusp alfa
INTR@PID Program: Upcoming Readouts
                                                                                                                                                                                                    Registrational potential

                                                                                                             2021                                2022                            2023                         2024
                                                                   BTC 047 - 2L
  Mono/CT

                   Ph II                                                                            Q1
   combo

                                                                        Monotherapy
                                                                      BTC 055 - 1L
                   Ph II/III                                                                                                                                    Q4
                                     CT combo (Gemcitabine Plus Cisplatin)

                                                                     Lung 024 - 1L
                   Ph I/II
  CT/CRT

                                                                                                                                       Q1
  combo

                                                                               CT combo

                                                     Lung 005 – Stage* III
                   Ph II                     cCRT + IO combo followed by IO
                                                                                                                                                                                                       Q1

                                                              Cervical 046 - 1L
                   Ph I                                                                                                                         Q2
  HPV driven/
  Precision IO

                                                   CT, +/- bevacizumab combo

                                                              Cervical 017 - 2L                                                                 Recently
                   Ph II                                                                                                     Q4
                                                                                                                                                moved up
                                                                          Monotherapy

                   Ph II                                           TNBC 020 - 2L                                                                                         Q1
                                                                          Monotherapy

                                                            Urothelial 152 –2L                                                                            Q3
                   Ph Ib                                                  Monotherapy

                                                   Solid tumors - (M6223)
                   Ph I                                                                                                                                   Q3
                                                                    Anti-TIGIT combo
Acronyms: BTC = Biliary Tract Cancer; CT = Chemotherapy; EMT = Epithelial-mesenchymal transition; HPV = Human papillomavirus; NSCLC = Non-small Cell Lung Cancer; RT = Radiation therapy; TNBC = Triple-Negative Breast Cancer; *
unresectable; All clinical timelines are event-driven and may be subject to change

52               Merck Q4 20 Results Presentation | March 4, 2021
Healthcare catalysts – Significant developmental progress across Oncology
and Immuno-Oncology portfolio expected in 2021         Oncology
                                                                                                                                                 Immuno-Oncology                  Immunology

                      Q1                                                Q2                                                 Q3                                                Q4
                 Tepotinib
             (c-Met–inhibitor)

        METex14: FDA approval

                                       Bavencio®
                                 (Avelumab/Anti-PD-L1)
                 1L UC: Approved by EMA and Japanese MHLW

                                 Berzosertib/M6620                                                                                         Bavencio®
                          (ATR-inhibitor, formerly VX-970)                                                                           (Avelumab/Anti-PD-L1)
     ▪ Publication of Ph II data (SCLC) in a leading scientific journal                                                      1L NSCLC: Expected data read-out1
       ▪ Initiation of potentially registrational Ph II study (SCLC)
                                                                                                                  M5049
                                                                                                            (TLR 7/8 antagonist)
            Bintrafusp alfa
                                                                                                        Covid-19 pneumonia: Results
       (Anti-PD-L1/TGF-ß-Trap)
                                                                                                        dependent on recruitment and
  2L BTC: Expected data read-out                                                                          COVID-19 infection rates

Acronyms: BTC = Biliary Tract Cancer, EMA = European Medicines Agency, FDA = U.S. Food and Drug Administration, MHLW = Ministry of Health, Labour and Welfare, NSCLC = Non-Small Cell Lung Cancer,
SCLC = Small Cell Lung Cancer, TLR = Toll-like receptor, UC = Urothelial Cancer; 1 clinical timelines are event-driven and may be subject to change

53         Merck Q4 20 Results Presentation | March 4, 2021
FY Life Science: 12% increase mainly driven by 22% growth in Process
Solutions as strong underlying growth is boosted by COVID-19 demand

Life Science P&L                                                                                   Net sales bridge
 [€m]                                 IFRS                          Pre adjustments
                                                                                                    €6,864 m              11.8%                          0.0%           €7,515 m
                            FY 2019            FY 2020            FY 2019           FY 2020                                                   -2.3%
 Net sales                     6,864               7,515            6,864             7,515
 M&S
       *
                              -1,924             -1,995            -1,922           -1,992                                                                           +0.0%
                                                                                                       FY 2019             Organic            Currency   Portfolio           FY 2020
 Admin                           -341                -354             -307              -322
 R&D                             -276                -313             -276              -312       EBITDA pre bridge
 EBIT                          1,280               1,599            1,340             1,619                               17.2%                                         €2,405 m
                                                                                                    €2,129 m
 EBITDA                        2,070               2,387               -                  -                                                   -3.8%      -0.5%
 EBITDA pre                    2,129               2,405            2,129             2,405
 (in % of net Sales)             31.0%              32.0%             31.0%             32.0%
                                                                                                       FY 2019             Organic            Currency   Portfolio           FY 2020
Comments
▪ 22% organic growth of Process Solutions mainly driven by downstream ▪ M&S flat in absolute terms as cost-consciousness and lower travel
  and single use, elevated by additional COVID-19 demand                expenses offset increased freight cost in M&S
▪ Research Solutions growing 5% as Q3 recovery is further supported by a ▪ Admin increase driven largely by pandemic-related cost for additional
  particularly strong Q4 (diagnostics exposure & COVID-19 recovery)        safety precautions, however below sales growth
▪ Applied Solutions growing 3% slightly below our mid-term guidance as                             ▪ Investments in strategic projects in R&D
  negatives outweigh positives in the context of COVID-19                                          ▪ Outstanding operational leverage and favorable mix from additional
                                                                                                     COVID-19 demand boost EBITDA pre margin to 32%
                                                              *
                                                                  Marketing and selling expenses
54         Merck Q4 20 Results Presentation | March 4, 2021                                           Totals may not add up due to rounding
You can also read