Hyperspectral Image Super-Resolution with Spectral Mixup and Heterogeneous Datasets
←
→
Page content transcription
If your browser does not render page correctly, please read the page content below

Hyperspectral Image Super-Resolution with Spectral Mixup and Heterogeneous
                                                                         Datasets

                                                             Ke Li1        Dengxin Dai1   Ender Konukoglu1    Luc Van Gool1,2
                                                                              1                 2
                                                                                CVL, ETH Zurich, PSI, KU Leuven
                                                                    {ke.li,dai,ender.konukoglu,vangool}@vision.ee.ethz.ch
arXiv:2101.07589v2 [cs.CV] 3 Apr 2021

                                                                 Abstract                                     now, though still expensive. As a result, increasing efforts
                                                                                                              have been made to advance HSI super-resolution (SR).
                                           This work studies Hyperspectral image (HSI) super-                     While numerous deep learning methods have been devel-
                                        resolution (SR). HSI SR is characterized by high-                     oped for improving the resolution of RGB images (RGBIs),
                                        dimensional data and a limited amount of training exam-               the topic of HSI SR has received little attention. One of the
                                        ples. This exacerbates the undesirable behaviors of neu-              main reasons is the lack of large-scale HSI datasets for high-
                                        ral networks such as memorization and sensitivity to out-of-          resolution (HR) HSIs. As known, supervised deep learning
                                        distribution samples. This work addresses these issues with           methods need an enormous amount of training data. This
                                        three contributions. First, we observe that HSI SR and RGB            situation, unfortunately, will not be improved in the fore-
                                        image SR are correlated and develop a novel multi-tasking             seeable future due to the challenges hyperspectral imaging
                                        network to train them jointly so that the auxiliary task RGB          faces. In this work, we choose a different route and propose
                                        image SR can provide additional supervision. Second, we               to learn from multiple heterogeneous datasets and also from
                                        propose a simple, yet effective data augmentation routine,            virtual examples. We find that while it is difficult to collect
                                        termed Spectral Mixup, to construct effective virtual train-          HR HSIs, it is relatively easy to collect only LR HSIs and it
                                        ing samples to enlarge the training set. Finally, we extend           is very easy to collect HR RGB images. It is thus appealing
                                        the network to a semi-supervised setting so that it can learn         to have a HSI SR method which can learn from these het-
                                        from datasets containing only low-resolution HSIs. With               erogeneous sources. Our method is designed for this aim.
                                        these contributions, our method is able to learn from het-                Although the data distribution is not the same between
                                        erogeneous datasets and lift the requirement for having a             RGBIs and HSIs, the two SR tasks do share some common
                                        large amount of HD HSI training samples. Extensive ex-                goals in integrating information from neighboring spatial
                                        periments on four standard datasets show that our method              regions and neighboring spectral bands during the learning.
                                        outperforms existing methods significantly and underpin the           We embrace this observation and formulate both tasks into
                                        relevance of our contributions. Code has been made avail-             the same learning framework such that the parameter dis-
                                        able at https://github.com/kli8996/HSISR.                             tribution induced by the RGBI SR task can serve as an ef-
                                                                                                              fective regularization for our HSI SR task. The challenge
                                                                                                              lies in the difference in spectral band numbers, e.g. three in
                                        1. Introduction                                                       RGBIs vs. e.g. 31 or 128 in HSIs. To tackle this and to re-
                                                                                                              duce the computational complexity, we propose a universal
                                            Hyperspectral imaging acquires images across many in-             group convolutional neural network that can accommodate
                                        tervals of the electromagnetic spectrum. It has been applied          different spectral groups.
                                        to numerous areas such as medical diagnosis [37], food                    We further propose a data augmentation routine, termed
                                        quality and safety control [22], remote sensing [21] and ob-          Spectral Mixup, to create effective ‘virtual’ training exam-
                                        ject detection [39]. All these applications benefit from an-          ples. Data augmentation is a strategy to create virtual sam-
                                        alyzing the spectral information coming with HSIs. One                ples by modifying the original samples. Data augmentation
                                        obstacle in the way of further unleashing this potential is           is known to increase the generalizability of learning meth-
                                        data acquisition. Acquiring HSIs of high spatial and high             ods. Common methods for classification tasks include re-
                                        spectral resolution at a high frame rate is still a grand chal-       flections, rotations, cropping, and color jittering. They as-
                                        lenge. There is still no camera to achieve these three goals          sume that examples obtained by those operations share the
                                        at the same time. Cameras for a compromise setting – high             same class with the original example and that can hardly
                                        spectral but low spatial resolution – are quite common by             be applied to our regression task. In this work, we propose

                                                                                                          1
Spectral Mixup to create virtual samples using convex com-        pyramids [30], employing GAN losses [33], and modeling
binations of spectral bands of the same image for our task        real-world degradation effects [23]. As to single HSI SR,
HSI SR. Spectral Mixup favors functions that preserve sim-        there has been great early work [3, 60] as well. However,
ple linear behavior in-between spectral bands and greatly         that is also surpassed by deep learning methods. For in-
avoids data over-fitting.                                         stance, Yuan et al. [54] trained a single-band SR method
    While the aforementioned contributions can yield state-       on natural image datasets, and applied it to HSIs in a band-
of-the-art performance already, we extend the method fur-         wise manner to explore spatial information. The spectral
ther to learn from unlabeled datasets as well. Semi-              information is explored via matrix factorization afterwards.
supervised learning (SSL) exploits unlabeled data to reduce       In order to explore both spatial and spectral correlation at
over-fitting to the limited amount of labeled data [15, 31, 45,   the same time, methods based on 3D Convolutional Net-
48, 24]. While good progress has been achieved, the strate-       works [38, 34] have been developed. Although 3D CNNs
gies are mainly designed for recognition tasks. Their ap-         sound like a perfect solution, the computational complexity
plicability to a low-level dense regression task such as HSI      is very high. To alleviate this, Grouped Convolutions (GCs)
SR has yet to be verified. In this work, we again leverage        with shared parameters have been recently used in [35, 26].
the success of RGBI SR and propose a cross-model con-             The backbone network of our method is also based on GCs.
sistency that favors functions giving consistent outputs be-
tween super-resolved RGBIs and super-resolved HSIs. Ba-
sically, we convert LR HSIs into LR RGB images and pass              Fusion-based methods use HR RGBIs of the same scene
those through the RGBI SR network. In the meanwhile,              as references to improve the spatial resolution of the LR
we pass the LR HSIs through our HSI SR network to get             HSIs [11, 51]. This stream of methods have received
the super-resolved HSIs and convert them to RGBIs with a          more research attention than the former two. Many learn-
standard camera response function. We enforce the consis-         ing techniques have been applied to this data fusion task
tency between the two versions of super-resolved RGBIs.           including Bayesian inference [5, 6, 58], matrix factoriza-
This way, supervision is transferred from the better-trained      tion [32, 16], sparse representation [4, 18], and deep neural
RGB SR network to our HSI SR network via a second route.          networks [41, 49]. The common goal of these methods is to
    To summarize, this work makes three contributions: 1)         learn to propagate the detailed information in the HR RG-
a multi-tasking HSI SR method to learn together with an           BIs to the target HSIs and fuse them with the fundamental
auxiliary RGBI SR task; 2) a simple, yet effective data aug-      spectral information from LR HSIs. Despite the plethora
mentation method Spectral Mixup; and 3) A SSL method to           of fusion algorithms developed, they all assume that the LR
learn also from ‘unlabeled’ LR HSIs. With these contribu-         HSIs and the HR RGBIs are very well co-registered [26].
tions, our method sets the new state of the art.                  This data registration is a challenge on its own and registra-
                                                                  tion errors will lead to degraded SR results [13, 61].
2. Related Work
Hyperspectral Image Super-Resolution. HSI SR can be               Learning with Auxiliary Tasks. It is quite a common prac-
grouped into three categories according to their settings: 1)     tice to borrow additional supervision from related auxiliary
HSI SR from only RGBIs; 2) Single HSI SR from LR HSIs;            tasks, when there is insufficient data to learn a task. The
and 3) HSI SR from both HR RGBIs and LR HSIs of the               common strategy is to learn all the tasks together so that
same scene. Our method belongs to the second group.               the auxiliary tasks can regularize the optimization. There
    HSR SR from only RGBIs is a highly ill-posed prob-            are normally two assumptions: (1) we only care about
lem. However, it has gained great traction in recent years        the performance of the main task and (2) the supervision
due to its simple setup and the well-organized workshop           for the auxiliary tasks is easier to obtain than that of the
challenges [8]. Similar to other computer vision topics, the      main task. Previous work has employed various kinds of
trend has shifted from ‘conventional’ methods such as ra-         self-supervised methods as auxiliary tasks for the main su-
dial basis functions [40] and sparse coding [7] to deep neu-      pervised task in a semi-supervised setting [29, 10, 42].
ral networks [20, 44, 8]. This trend highlights the need for      For instance, generative approaches have been explored
bigger training datasets.                                         in [29] and predicting the orientation of image patches is
    Single image SR aims to model the relationship between        used in [10]. Another related setting is multi-task learning
the LR images and HR ones by learning from a collection of        (MTL) [46]. In MTL, the goal is to reach high performance
examples consisting of pairs of HR images and LR images.          on multiple tasks simultaneously, so all tasks are main tasks
Single RGBI SR has achieved remarkable results in the last        and all tasks are auxiliary tasks. While the goal is differ-
years. Since the first work of using neural networks for          ent, many strategies in MTL such as parameter sharing [9],
the task [17], progress has been made in making networks          task consistency [56], and loss balance [14] are useful for
deeper and the connections denser [27, 59], using feature         learning with auxiliary tasks.
Convolutional         Spatial-Spectral
                  Layer                 Block (SSB)
                    HS         RGB        Shared

                                                                               C                         +      +

                                                                                       SSB

                                                                                                   SSB
                                                                                             SSB
                                         +                             +

                                                 SSB

                                                           SSB

                                                                 SSB
                 SSB

                         SSB

                                SSB

                                                                                                         +      +

                                                                                       SSB

                                                                                             SSB

                                                                                                   SSB
            Bicubic Interpolation   +   Element-wise Sum
        C   Concatenation               Upsampling Layer

 Figure 1: The architecture of our network consisting of a shared encoder and two specific decoders for the two SR tasks.

3. Approach                                                                here), and the size of the images by h, w, H and W . Given
                                                                           a scaling factor τ , we have Hi = τ hi and Wi = τ wi for
    HSIs provide tens of narrow bands, so processing all the               both tasks.
bands together is time-consuming and requires very large
                                                                              The goal is to train a neural network ΦHS to predict the
datasets in order to avoid over-fitting. In this work, we fol-
                                                                           HR HSI for a given LR HSI: XHS = ΦHS (xHS ). Differ-
low [26] and use a grouping strategy to divide input HSIs
                                                                           ent from previous methods, which have a single network
into overlapping groups of bands. This way, the spectral
                                                                           for the whole task, our method consists of three blocks: an
correlation among neighboring bands can be effectively ex-
                                                                           encoder which is shared by the two SR tasks, and two task-
ploited without increasing the parameters of the model. An-
                                                                           specific decoders to output the final outputs. More specif-
other major advantage of using a grouping strategy is that
                                                                           ically, ΦHS = (ΦEn , ΦDe                      En    De
                                                                                                   HS ) and ΦRGB = (Φ , ΦRGB ). The
it offers the possibility to train our auxiliary task RGBI SR
                                                                           general architecture is shown in Fig 1.
along with our main task HSI SR within the same network.
                                                                              In order to share the same encoder between the two SR
Without using the grouping strategy, the difference in the
                                                                           tasks, we divide the C input channels of xHS into groups of
number of bands is very large between the two tasks. In this
                                                                           M bands. For HSI SR, the encoder network ΦEn takes M
work, we assume that the relationships between low/high-
                                                                           channels as input and generates M channels as output. The
resolution HSIs and low/high-resolution RGBIs are cor-
                                                                           outputs of all the groups of xHS are then concatenated ac-
related, so they should be trained together so that RGBI
                                                                           cording to their original spectral band position to assemble
SR can provide additional supervision for HSI SR. This
                                                                           a new HSI X̄HS ∈ RH1 ×W1 ×C . The neighboring groups
way, the HSI SR method can enjoy training samples of a
                                                                           of xHS can have overlaps and we average the results of the
much more diverse set of scenes especially those that cannot
                                                                           overlapping areas when assembling X̄HS . There are two up-
be captured well by current hyperspectral imaging devices
                                                                           sampling layers to upscale the size of the input to the desired
such as moving objects.
                                                                           size in a progressive manner. This progressive upsampling
3.1. HSI SR with an Auxiliary RGBI SR Task                                 has proven useful for both RGBI SR [30] and HSI SR [26].
                                                                           The reconstructed X̄HS is then fed into the decoder network
   Given two SR tasks THS and TRGB , we aim to help                        ΦDe
                                                                             HS as a whole to generate the final output X̂HS , which is
improve the learning of a model for THS by using the                       then compared to the ground truth XHS to compute the loss.
knowledge contained in TRGB . In the supervised setting,                   ΦDe
                                                                             HS takes all the bands directly to learn long-range spectral
each task is accompanied by a training dataset consisting                  correlations beyond individual groups to refine the results.
of N training samples, i.e., DHS = {xiHS , XiHS }N HS
                                                 i=1 and                      For RGBI SR, we first increase the number of bands of
              i    i    NRGB                   h1 ×w1 ×C
DRGB = {xRGB , XRGB }i=1 , where xHS ∈ R                 ,                 xRGB from Z to M via a simple spectral interpolation which
XHS ∈ RH1 ×W1 ×C , xRGB ∈ Rh2 ×w2 ×Z , and XRGB ∈                          will be explained in Sec. 3.1.1. The interpolated M -band
RH2 ×W2 ×Z . We denote low-resolution (LR) images by x,                    image is then passed through the encoder ΦEn to obtain
high-resolution (HR) images by X, the number of bands of                   a new M -band RGB image X̄RGB ∈ RH2 ×W2 ×M of the
HSIs by C, the number of bands in RGB images by Z (3                       desired resolution. Because the decoder is shared by two
tasks, X̄RGB is also needed to be fed to its own task-specific
decoder network ΦDe  RGB for further refinement. The final out-
put X̂RGB from ΦDe  RGB is then compared to the ground-truth           F

                                                                                                                          =
image XRGB .
                                                                                                                  F
   In order to have a modular design, the three sub-
networks have the same basic architecture. They are all
composed of a sequence of Spatial-Spectral Block (SSB)
modules. The SBB module was proposed in [26] as a basic             Figure 2: The pipeline of our semi-supervised learning.
building block for their HSI SR network. Each SBB has a
Spatial Residual Module and a Spectral Attention Residual
Module. Two Convolutional layers (the first one followed          3.2. Spectral Mixup
by a ReLu layer) with 3x3 filters are used in the Spatial
                                                                      Data augmentation is a strategy to create virtual sam-
Residual Module to capture spatial correlations. Two Con-
                                                                  ples by alternating the original samples. The recent mixup
volutional layers (the first one again followed by a Relu
                                                                  method [57] creates virtual examples by using convex com-
layer) with 1x1 filters are used in the Spectral Attention
                                                                  binations of pairs of examples and their labels. While it
Residual Module to capture spectral correlations. Please re-
                                                                  is very effective for high-level classification tasks, it does
fer to Fig.2 in [26] for more details of the SBB module. We
                                                                  not offer help for low-level SR tasks [53] because the de-
construct the whole network with standard Convolutional
                                                                  tailed image structures can be destroyed by the mixing-up of
Layers, SBBs, Upsampling Layers and Concatenation Op-
                                                                  two images. These detailed structures are important for SR
erations. There are also skip connections at multiple scales
                                                                  tasks. Taking into account of this observation, we propose
to facilitate the information flow. The input LR images are
                                                                  a data augmentation routine Spectral Mixup specifically for
also scaled to the desired size via Bicubic Interpolation and
                                                                  HSI SR. It creates virtual samples and their ground truths
fused with the network output for residual learning. The
                                                                  by using convex combinations of spectral bands within self-
complete network is shown in Fig. 1. We employ the Pix-
                                                                  image and within its ground-truth image, respectively.
elShuffle [43] operator for the upsampling layer. Given a
                                                                      More specifically, given xHS and it ground truth XHS ,
scaling factor τ , the first upsampling layer upscales the fea-
                                                                  both with C channels, we generate a mixing matrix B ∈
tures τ /2 times and the second one handles the remaining
                                                                  RC×C filled with random numbers sampled from a uniform
×2 factor. The internal features of all SBB modules are lim-
                                                                  distribution on the interval [0, 1). B is then row-wise nor-
ited to 256 in this work. The filter size of all Convolutional
                                                                  malized to make sure that the values in the projected image
Layers, except for those in the Spectral Attention Residual
                                                                  have the same magnitude as that of the original image. The
Module of SBBs, are set to 3 × 3.
                                                                  new example and its ground truth are then created as:

3.1.1   Spectral Interpolation of RGB Images                                    x̊(i,j)  (i,j)         (i,j)
                                                                                  HS = αxHS + (1 − α)BxHS ,                  (2)

The task is to increase the number of band from Z to M for                     X̊(i,j)  (i,j)         (i,j)
                                                                                 HS = αXHS + (1 − α)BXHS ,                   (3)
RGB images. For instance, we have Z = 3 and M = 8                 where (i,j) index over all positions to get the values of pix-
in this work. Because the generated M -band images will           els. The randomly projected images are fused with the orig-
be used to train the SR network for supervision transfer to       inal images to strike a balance between increasing variations
HSI SR, we posit that these new images need to have certain       and preserving the fidelity of real HSIs. For instance, the re-
properties. First, they should not contain artifacts. Second,     lationships between the bands of real HSIs should be largely
the correlation between the bands of the new images should        kept. In this work, α is set to 0.5 and we study the influence
follow a distance rule in that the correlation between neigh-     of this parameter in Sec. 4. The implementation of Spectral
boring HSI bands should be higher than that between distant       Mixup training is very straightforward and can be done with
bands. For this, we propose a simple interpolation method.        a few lines of code. Spectral Mixup also introduces very lit-
Given Z bands, we interpolate K = (M − Z)/(Z − 1) new             tle computation overhead. By applying it, more examples
bands to each of the Z − 1 intervals between consecutive          from the vicinity of the original example can be sampled.
bands. For the ith band ẋ(i) between the original bands z        Learning with those new examples encourages the network
and z + 1, we have:                                               to have simple linear behavior in-between spectral bands
                         i            i                           which is found very useful for HSI SR.
        ẋ(i) = (1 −        )x(z) +      x(z + 1).         (1)
                       K +1         K +1                          3.3. Semi-Supervised HSI SR
Note that if K is not an integer, we use dKe for the first          While training with auxiliary RGB SR task and Spectral
interval and bKc for the second one.                              Mixup can greatly improve the performance, there is still a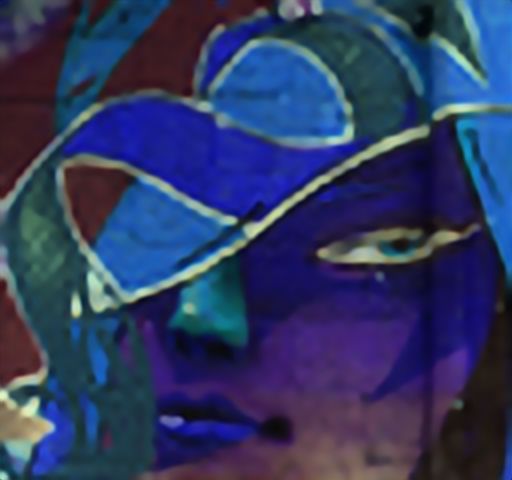
strong need to also learn with unlabeled HSIs, i.e. LR HSIs            The main loss is augmented by the three auxiliary losses
without HR HSIs as ground truth. This is especially true               which are optional but highly beneficial. A joint training
as modern snapshot HS cameras that captures LR HSIs at                 with all losses together works well in principle by stacking
high frame rate are becoming more and more accessible. In              multiple types of data samples in a single mini-batch. How-
the literature, there has been a diverse sets of methods de-           ever, that will heavily limits the size of the training data for
veloped for semi-supervised learning (SSL) based on tech-              each loss. In this work, we adopt an alternating training
niques such as entropy minimization and pseudo-labels gen-             strategy; that is to train with each of the four losses in turn
eration. However, they are mostly designed for high-level              in every iteration. In our implementation, the weights for
recognition tasks and can not be applied to HSI SR directly.           all losses are set to 1. The contributions of different terms
   In this work, we propose a new SSL method specifically              are balanced or controlled by altering the number of mini-
for HSI SR. For this purpose, we again leverage the fact that          batches for that loss in each iteration. The influence of these
RGBI SR is a better-addressed problem, given that it has a             numbers are studied in Sec. 4.2.
large amount of training data and it predicts only three chan-
nels. The method works as follows: given an image xHS , we             4. Experiments
convert it to an RGB image x̃RGB with the camera response
                                            (i,j)
function of a standard RGB camera f : x̃RGB = f ∗ xHS ,
                                                          (i,j)        4.1. Experimental Setup
where ∗ is a convolution operation. The operation is to inte-             Datasets. We evaluate our method on four public
grate the spectra signatures into R, G, and B channels and is          datasets. The datasets considered are three nature HSI
widely used in the literature [19]. The response function of           datasets: CAVE dataset [50], Harvard dataest [12], and
Canon 1D Mark 3 [25] is used in this work but other camera             NTIRE 2020 dataset [8], and one remote sensing HSI
response functions can also be used.                                   dataset Chikusei [52]. Images in CAVE and NTIRE 2020
   The original HSI xHS and the converted RGB image                    dataset have 31 bands ranging from 400 nm to 700 nm at a
x̃RGB are then fed into the HSI SR network ΦHS and                     step of 10 nm. Images in Harvard dataset contain 31 bands
the RGBI SR network ΦRGB , respectively, to generate the               as well but range from 420 nm to 720 nm. The Chikusei
super-resolved results: X̂      = Φ (x ) and X̃      ˆ        =
                              HS         HS   HS           RGB         dataset has 128 bands spanning from 363 nm to 1018 nm.
ΦRGB (x̃RGB ); X̂HS is then converted to an RGB image                     The CAVE dataset contains 32 images of 512 x 512 pix-
                                                 ˜ (i,j)               els. We use 20 images for training and 10 images for testing.
by using the same camera response function: X̂RGB =
      (i,j)                                  ˆ       ˜                 We evaluated in a supervised setting and a semi-supervised
f ∗ X̂HS . Finally, a consistency loss Lssl (X̃RGB , X̂RGB )
                                                                       setting. For our semi-supervised setting, 5 images are used
is computed between the two HR RGB results. This consis-
                                                                       as labeled images (with HR HSIs) and the remaining 15
tency check makes a good use of ‘unlabeled’ HSIs and ‘la-
                                                                       used as unlabeled. For the Harvard dataset, there are 50 im-
beled’ RGB images. It transfers supervision from the RGB
                                                                       ages in total. We use 40 for training and 10 for test. For the
side to the HSI side. The diagram of this SSL method is
                                                                       semi-supervised setting, 6 images are taken as the labeled
shown in Fig. 2.
                                                                       images while the remaining 34 are taken as unlabeled im-
3.4. Loss Function                                                     ages. For NTIRE 2020, there are 480 images. We use 400
                                                                       images for training and 80 images for test. For the semi-
   In order to capture both spatial and spectral correlation of        supervised case, we further split the 400 images into 100 as
the SR results, we follow [26] and combine the L1 loss and             labeled images and 300 as unlabeled images. For Chiku-
the spatial-spectral total variation (SSTV) loss [1]. SSTV             sei, there is only one big image of 2517 × 2335 pixels. We
is used to encourage smooth results in both spatial domain             cropped 4 image crops of 256 × 256 pixels for test and use
and spectral domain and it is defined as:                              the rest for training. For the auxiliary RGBI SR task, we
               1 X
                  N                                                    adopt the DIV2K Dataset [2]. Because the resolution of
  LSSTV =            (||Oh X̂n ||1 +||Ow X̂n ||1 +||Oc X̂n ||1 ),      DIV2K is much higher than our HSIs, we first downsample
              N n=1
                                                                       them by a factor of ×2 and take these downsampled images
                                                                 (4)   as our HR RGB images. After cropping, it leads to 137, 430
where Oh , Ow , and Oc compute gradient along the horizon-             image patches of 64×64 pixels. This is about 34, 10, 6, and
tal, vertical and spectral directions, resp. The loss is:              40 times larger than CAVE, Harvard NTIRE, and Chikusei
                       L = L1 + LSSTV .                          (5)   datasets, respectively.
                                                                          Methods. We compare the proposed method to four
The overall loss for our SR tasks is:                                  state-of-the-art HSI SR methods: GDRRN [35], 3DFCNN
                                                                       [38], SSPSR [26], and MCNet [34]. We use the same train-
LTotal = LHS (XHS , X̂HS ) + LRGB (XRGB , X̂RGB )
                                                             (6)       ing data for all methods and use the default training settings
                           ˆ               ˆ       ˜
         + LSMixup (X̊HS , X̊HS ) + LSSL (X̃ RGB , X̂ RGB ).           given by the authors of these methods. Bicubic interpola-
#(Mini-Batches)          0             1            2          3            4          5          6          8         10
             RMSE ↓           0.01451       0.01357       0.01329    0.01309     0.01308    0.01305    0.01315   0.01315    0.01317

                      Table 1: Performance as a function of the number of mini-batches for RGBI SR loss.

   Methods                RMSE ↓           MPSNR ↑        ERGAS ↓              reduced by a factor of 0.3 after every 3 epoches. As to the
                                                                               batch size, 16 is used for all experiments except for the case
   Spatial Mixup [57]        0.01308       41.47317        3.77823
   Cutblur Mixup [53]        0.01309       41.63031        3.69937             when the SSL loss is added. For that 8 is used due to the
   Spectral Mixup            0.01281       41.81709        3.64961             limit of GPU memory.

        Table 2: Ablation study for Spectral Mixup                             4.2. Ablation Study
                                                                                  We analyze the parameter choices of our method in this
 M                       3             5              8         12
                                                                               section. Experiments are conducted on the CAVE dataset in
 RMSE ↓               0.01321     0.01326       0.01315      0.01332           the semi-supervised setting.
 Training time (h)    2:14:40     1:49:11       1:24:14      1:15:04              Number of mini-batches. The number of mini-batches
                                                                               for labeled HSIs in each iteration is fixed to 1. The number
 Table 3: Influence of group size M on the performance.                        of mini-batches for unlabeled HSIs for the SSL is fixed to 3.
                                                                               This is decided by the ratio of the size of unlabeled data to
tion is also introduced as a baseline.                                         the size of labeled data. We have studied the influence of the
    Evaluation Metrics. We follow the literature and evalu-                    other two parameters. First, for RGB data, we evaluate over
ate the performance of all methods under six standard met-                     a large range of values. The results are shown in Table 1.
rics. They are cross correlation (CC) [36], spectral angle                     The performance increases first with the number of mini-
mapper (SAM) [55], root mean squared error (RMSE), er-                         batches and then decreases with it. We fix the number of
reur relative globale adimensionnelle de synthese (ERGAS)                      batches for RGB data to 3 as it is a good trade-off between
[47], peak signal-to-noise ratio (PSNR), and structure sim-                    performance and computational time. We have also tested
ilarity (SSIM) [62]. For PSNR and SSIM of the recon-                           the number of mini-batches for the virtual samples created
structed HSIs, their mean values of all spectral bands are                     by Spectral Mixup and find that 2 is better than 1 and values
reported. CC, SAM, and ERGAS are widely used in HSI                            larger than 2 add marginal improvement. We use 2 for all
fusion task, while the other three are standard metrics for                    our experiments.
image restoration and RGBI SR. Due to space limit, for                            Influence of α. We tested five values for it: 0, 0.25,
some experiments, we only report numbers of three metrics                      0.5, 0.75 and 1 and obtained the following RMSE results:
and include the rest into the supplementary material.                          0.01175 0.01178, 0.01173, 0.01187, and 0.01189. Results
    Parameters. In this work, we focus on scaling factor ×4                    show that α should not be too big or too small. We choose
and ×8. We report the results of ×4 in the main paper, and                     α = 0.5 to keep a balance between increasing data variation
report the results of ×8 in the supplementary material. For                    and preserving the fidelity of real HSIs.
the case of ×4, we crop the images into patches of 64 × 64                        Mixup Methods. We compare our Spectral Mixup to
pixels without overlapping to collect the training data. For                   two recent data augmentation methods mixup [57] and Cut-
×8, we use patches of 128 × 128 pixels. Those patches                          blurMixup [53]. These methods also rely on the data mixing
are then downsampled via Bicubic interpolation to obtain                       idea. Note that the results for this experiment are generated
the corresponding LR HSI patches. The choice of value for                      under a joint training with the auxiliary RGBI SR module as
other parameters are studied in Sec. 4.2.                                      this is a stronger method than our base model. The results
    Training Details. We use ADAM optimizer [28] and                           in Table 2 show that Spectral Mixup outperforms both of the
train all variants of our method for 10 epoches. This is a                     methods. The spatial mixing method [57] blends data from
small number compared to the ones used by comparison                           two images. It may break detailed structures that are impor-
methods. For instance, GDRRN [35] trains for 30 epoches,                       tant for SR tasks. The CutblurMixup method learns where
3DFCNN [38] trains for 200 epoches, SSPSR [26] for 40                          to perform the SR and is found helpful for RGB SR [53].
epoches, and MCNet [34] for 200 epoches. We choose a                           Spectral Mixup creates virtual examples by using convex
small number in order to thoroughly evaluate all the vari-                     combinations of spectral bands of the same image which
ants of our method. We find that 10 epoches are sufficient                     avoids breaking image structures and preserves simple lin-
to give good results for our method, and believe a larger                      ear behavior in-between spectral bands. This makes it more
number probably can further push the numbers up. The ini-                      suitable for HSI tasks.
tial learning rate of all our methods is set to 10−4 and is                       Group Size. We evaluated four values for M . The re-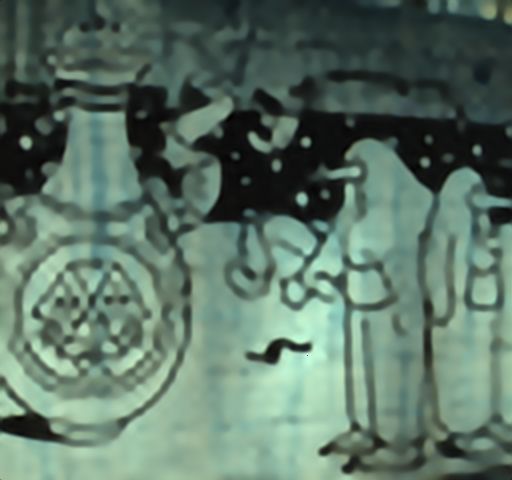
Components            CAVE                   Harvard               NTIRE
 Methods        RGBSR SMixup SSL RMSE ↓ MPSNR ↑ ERGAS ↓ RMSE ↓ MPSNR↑ ERGAS ↓ RMSE ↓ MPSNR↑ ERGAS ↓
 Ours                                    0.01451    40.83762   4.03386    0.01406   40.46614   3.17093   0.01602   38.31542   2.20746
 Ours              3                     0.01309    41.64471   3.70784    0.01372   40.70069   3.09505   0.01519   38.78698   2.10917
 Ours                          3         0.01353    41.51967   3.78138    0.01392   40.54614   3.13421   0.01563   38.58965   2.14927
 Ours              3           3         0.01281    41.81709   3.64961    0.01359   40.75872   3.07788   0.01526   38.72326   2.11944
 Ours              3                 3   0.01254    42.01961   3.58921    0.01345   40.80595   3.06239   0.01509   38.83281   2.09676
 Ours (final)      3           3     3   0.01191    42.35848   3.44471    0.01331   40.93154   3.01392   0.01486   38.96572   2.06742
 Bicubic               -         -   -   0.01856    38.73800   5.27190 0.01678      38.89758   3.80698   0.02353   34.74012   3.19014
 GDRRN [35]            -         -   -   0.02463    36.27752   7.00438 0.01609      38.69532   4.30316   0.01974   36.07933   2.81752
 3DFCNN [38]           -         -   -   0.01738    38.39284   6.70559 0.01578      39.34414   3.61725   0.02083   35.66309   2.82461
 SSPSR [26]            -         -   -   0.01448    40.91316   4.04064 0.01427      40.32095   3.22745   0.01636   38.07401   2.25393
 MCNet [34]            -         -   -   0.01461    40.73858   4.16596 0.014682     40.18739   3.26059   0.01680   38.02486   2.28342

Table 4: Results of all methods on the CAVE, Harvard, and NTIRE datasets in the semi-supervised setting for the ×4 case.

                                 Components                                          Metrics
        Methods            RGBI SR S. Mixup        SSL   RMSE ↓      CC ↑       MPSNR ↑ MSSIM ↑           ERGAS ↓       SAM ↓
        Ours                                             0.01230    0.94992      39.71319      0.93529     5.32514     2.58381
        Ours                 3                           0.01211    0.95161      39.86037      0.93691     5.22631     2.53569
        Ours                             3               0.01216    0.95097      39.82008      0.93649     5.26244     2.56245
        Ours                 3           3               0.01215    0.95096       39.8338      0.93675     5.24407     2.59671
        Ours                 3                     3     0.01219    0.95109      39.81107      0.93617     5.25279     2.56749
        Ours (final)         3           3         3     0.01181    0.95375      40.09431      0.94035     5.08513     2.49154

           Table 5: Results of all methods on the Chikusei dataset in the semi-supervised setting for the ×4 case.

sults in Table 3 show that the performance of the method is              their method does not give top results. When compared to
robust to different values of M . It can also be found that              the very recent method MCNet [34], our base model also
M = 8 gives the best result in terms of RMSE and compu-                  performs better in almost all cases. This is especially inter-
tational time. We thus use 8 for all our experiments. This               esting because MCNet is trained for 200 epoches while our
finding is in line with [26].                                            method is trained only for 10 epoches.
                                                                            The proposed contributions, namely training with the
4.3. Main Results                                                        auxiliary task RGBI SR, data augmentation via Spectral
   We first present the results in the semi-supervised set-              Mixup and the semi-supervised learning method based on
ting. The results of all competing methods and all variants              cross-model consistency, all contribute significantly to the
of our method on the CAVE, Harvard, and NTRIE dataset                    final results. Out of the three, learning with the auxiliary
are shown in Table 4. The results in this table and other                task RGBI SR and Spectral Mixup can work on its own. The
results in supplemental material show that our method out-               SSL component needs to be used together with the auxiliary
performs all other state-of-the-art methods significantly and            task RGBI SR. The results show that our SSL method can
consistently over all datasets and under all evaluation met-             provide further improvement on top of the auxiliary RGBI
rics. We would like to point out that our baseline model –               SR method, and when the three components are combined
our method without any of the three proposed contributions               together, we get the best performance – better than using
– is already a top-performing method and performs better                 any subsets of the proposed contributions. These observa-
than other comparing methods.                                            tions are also well supported by our results on Chikusei with
   The good performance of our base model is mainly due                  128 bands in Table 5.
to the use of deep group convolutional networks for this                    When more supervision is given such as in the fully-
task. Our results reinforce the findings made in [26] that               supervised setting, all conclusions we drawn in the semi-
group convolutional networks are good at extracting the                  supervised setting hold as shown in Table 6. The results
correlation between spectral bands without increasing the                show that the proposed components are very effective and
model size. The network of [38] is quite shallow, probably               can be applied to situations with varying amount of HR
because 3D convolution based methods are computation-                    HSIs. We show visual results of our method and two com-
ally heavy in general. We believe that this is the reason why            peting methods in Fig. 3. The figure shows that our method
Methods RMSE     MPNSR    ERGAS

 Bicubic 0.03568 29.89529 4.86576

 3DFCNN 0.03129 30.92947 4.26353

  SSPSR   0.02712 32.18152 3.69979

  Ours    0.01993 34.42891 2.71569

 (a) Ground Truth & Metrics            (b) Bicubic Interpolation         (c) 3DFCNN [38]             (d) SSPSR [26]               (e) Ours

Figure 3: Exemplar results of our method and two competing methods trained in the semi-supervised setting on the CAVE
dataset: top row for the super-resolved results and bottom row for the error maps.

                                        Components                            CAVE                                     Harvard
           Methods                   RGBI SR S. Mixup              RMSE ↓    MPSNR ↑       ERGAS ↓     RMSE ↓         MPSNR ↑    ERGAS ↓
           Ours                                                    0.01196   42.38359      3.45903      0.01344       40.91014   3.01039
           Ours                         3                          0.01109   42.73668      3.35884      0.01325       41.03709   2.96643
           Ours                                       3            0.01134   42.88402      3.28051      0.01317       41.08568   2.95718
           Ours                         3             3            0.01068   43.32421      3.11799      0.01321       41.05925   2.96496
           GDRRN [35]                   -             -            0.01629   39.74705      4.52683      0.01484       39.62759   3.67932
           3DFCNN [38]                  -             -            0.01583   39.21786      5.41798      0.01519       39.66271   3.47738
           SSPSR [26]                   -             -            0.01245   42.13787      3.55146      0.01352       40.81499   3.05007
           MCNet [34]                   -             -            0.01245   42.25978      3.56246      0.01405       40.59229   3.10529

      Table 6: Results of all methods on the CAVE and Harvard datasets in the fully-supervised setting for the ×4 case.

generate few errors. More results can be found in the sup-                         iary tasks yield no improvement or even degrade the perfor-
plementary material.                                                               mance of the main task [42]. -

4.4. Discussion                                                                    5. Conclusion
   The superior performance shows that our method is able                             In this paper, we have proposed a new method for
to learn from heterogeneous datasets and virtual examples                          hypserspectral image (HSI) super-resolution (SR). We build
rather than from purely HR HSIs. This greatly increases the                        a deep group convolutional network which yields the state-
amount of training data that can be used for HSI SR and                            of-the-art results. To further improve it, we have proposed
can also include training samples for scenes such as mov-                          three contributions. First, we extend the network such that
ing objects that cannot be captured easily with the current                        the HSI SR task can be trained together with an auxiliary
hyperspectal imaging devices. We would like to point out                           RGB image SR task to gain more supervision. Second,
that while the general concepts of learning with auxiliary                         a simple, yet effective data augmentation method Spectral
tasks, data augmentation, and semi-supervised learning are                         Mixup is proposed to create virtual training samples for HSI
well known, the challenge and novelty lie in defining proper                       SR to increase the robustness of the network to new exam-
auxiliary tasks for a new main task, proposing suitable aug-                       ples. Finally, the network is extended to also learn from
mentation technique and developing effective SSL methods                           datasets with LR HSIs only. The contributions greatly in-
for a new task. For instance, many seemingly-related auxil-                        crease the amount of training data that HSI SR methods can
use. Extensive experiments show that all the three contribu-         [15] Dengxin Dai and Luc Van Gool. Ensemble projection for
tions are important and they help our method set a new state              semi-supervised image classification. In ICCV, 2013. 2
of the art on four public datasets.                                  [16] R. Dian, L. Fang, and S. Li. Hyperspectral image super-
                                                                          resolution via non-local sparse tensor factorization. In
References                                                                CVPR, pages 3862–3871, 2017. 2
                                                                     [17] C. Dong, C. C. Loy, K. He, and X. Tang.                  Image
 [1] H. K. Aggarwal and A. Majumdar. Hyperspectral image                  super-resolution using deep convolutional networks. IEEE
     denoising using spatio-spectral total variation. IEEE Geo-           Transactions on Pattern Analysis and Machine Intelligence,
     science and Remote Sensing Letters, 13(3):442–446, 2016.             38(2):295–307, 2016. 2
     5                                                               [18] W. Dong, F. Fu, G. Shi, X. Cao, J. Wu, G. Li, and X. Li. Hy-
 [2] E. Agustsson and R. Timofte. Ntire 2017 challenge on sin-            perspectral image super-resolution via non-negative struc-
     gle image super-resolution: Dataset and study. In IEEE Con-          tured sparse representation. IEEE Transactions on Image
     ference on Computer Vision and Pattern Recognition Work-             Processing, 25(5):2337–2352, 2016. 2
     shops (CVPRW), 2017. 5                                          [19] Y. Fu, T. Zhang, Y. Zheng, D. Zhang, and H. Huang. Hyper-
 [3] T. Akgun, Y. Altunbasak, and R. M. Mersereau. Super-                 spectral image super-resolution with optimized rgb guidance.
     resolution reconstruction of hyperspectral images. IEEE              In CVPR, 2019. 5
     Transactions on Image Processing, 14(11):1860–1875,
                                                                     [20] S. Galliani, Charis Lanaras, D. Marmanis, E. Baltsavias,
     2005. 2
                                                                          and K. Schindler. Learned spectral super-resolution. ArXiv,
 [4] Naveed Akhtar, Faisal Shafait, and Ajmal Mian. Sparse                abs/1703.09470, 2017. 2
     spatio-spectral representation for hyperspectral image super-
                                                                     [21] Alexander F.H. Goetz. Three decades of hyperspectral re-
     resolution. In ECCV, 2014. 2
                                                                          mote sensing of the earth: A personal view. Remote Sensing
 [5] N. Akhtar, F. Shafait, and A. Mian. Bayesian sparse repre-
                                                                          of Environment, 113:S5 – S16, 2009. 1
     sentation for hyperspectral image super resolution. In CVPR,
                                                                     [22] A.A. Gowen, C.P. O’Donnell, P.J. Cullen, G. Downey, and
     2015. 2
                                                                          J.M. Frias. Hyperspectral imaging – an emerging process
 [6] Naveed Akhtar, Faisal Shafait, and Ajmal Mian. Hierarchical
                                                                          analytical tool for food quality and safety control. Trends in
     beta process with gaussian process prior for hyperspectral
                                                                          Food Science & Technology, 18(12):590 – 598, 2007. 1
     image super resolution. In Bastian Leibe, Jiri Matas, Nicu
                                                                     [23] Yong Guo, Jian Chen, Jingdong Wang, Qi Chen, Jiezhang
     Sebe, and Max Welling, editors, ECCV, 2016. 2
                                                                          Cao, Zeshuai Deng, Yanwu Xu, and Mingkui Tan. Closed-
 [7] Boaz Arad and Ohad Ben-Shahar. Sparse recovery of hy-
                                                                          loop matters: Dual regression networks for single image
     perspectral signal from natural rgb images. In ECCV, 2016.
                                                                          super-resolution. In CVPR, 2020. 2
     2
                                                                     [24] Lukas Hoyer, Dengxin Dai, Yuhua Chen, Adrian Köring,
 [8] Boaz Arad, Radu Timofte, Ohad Ben-Shahar, Yi-Tun Lin,
                                                                          Suman Saha, and Luc Van Gool. Three ways to improve se-
     and Graham D. Finlayson. Ntire 2020 challenge on spec-
                                                                          mantic segmentation with self-supervised depth estimation.
     tral reconstruction from an rgb image. In Proceedings of
                                                                          arXiv preprint arXiv:2012.10782, 2020. 2
     the IEEE/CVF Conference on Computer Vision and Pattern
     Recognition (CVPR) Workshops, June 2020. 2, 5                   [25] J. Jiang, D. Liu, J. Gu, and S. Süsstrunk. What is the space
 [9] Arun Balajee Vasudevan, Dengxin Dai, and Luc Van Gool.               of spectral sensitivity functions for digital color cameras? In
     Semantic object prediction and spatial sound prediction with         2013 IEEE Workshop on Applications of Computer Vision
     binaural sounds. In European Conference on Computer Vi-              (WACV), 2013. 5
     sion (ECCV), 2020. 2                                            [26] J. Jiang, H. Sun, X. Liu, and J. Ma. Learning spatial-
[10] Lucas Beyer, Xiaohua Zhai, Avital Oliver, and Alexander              spectral prior for super-resolution of hyperspectral imagery.
     Kolesnikov. S4L: self-supervised semi-supervised learning.           IEEE Transactions on Computational Imaging, 6:1082–
     In ICCV, 2019. 2                                                     1096, 2020. 2, 3, 4, 5, 6, 7, 8, 12, 13, 14, 15, 16
[11] J. M. Bioucas-Dias, A. Plaza, N. Dobigeon, M. Parente, Q.       [27] J. Kim, J. K. Lee, and K. M. Lee. Accurate image super-
     Du, P. Gader, and J. Chanussot. Hyperspectral unmixing               resolution using very deep convolutional networks. In CVPR,
     overview: Geometrical, statistical, and sparse regression-           2016. 2
     based approaches. IEEE Journal of Selected Topics in Ap-        [28] Diederik P. Kingma and Jimmy Ba. Adam: A method for
     plied Earth Observations and Remote Sensing, 5(2):354–               stochastic optimization. In ICLR, 2015. 6
     379, 2012. 2                                                    [29] Durk P Kingma, Shakir Mohamed, Danilo Jimenez Rezende,
[12] A. Chakrabarti and T. Zickler. Statistics of Real-World Hy-          and Max Welling. Semi-supervised learning with deep gen-
     perspectral Images. In CVPR, 2011. 5                                 erative models. In NeurIPS. 2014. 2
[13] C. Chen, Y. Li, W. Liu, and J. Huang. Sirf: Simul-              [30] W. Lai, J. Huang, N. Ahuja, and M. Yang. Deep laplacian
     taneous satellite image registration and fusion in a uni-            pyramid networks for fast and accurate super-resolution. In
     fied framework. IEEE Transactions on Image Processing,               CVPR, 2017. 2, 3
     24(11):4213–4224, 2015. 2                                       [31] Samuli Laine and Timo Aila. Temporal ensembling for semi-
[14] R. Cipolla, Y. Gal, and A. Kendall. Multi-task learning using        supervised learning. In ICLR, 2017. 2
     uncertainty to weigh losses for scene geometry and seman-       [32] C. Lanaras, E. Baltsavias, and K. Schindler. Hyperspec-
     tics. In CVPR, 2018. 2                                               tral super-resolution by coupled spectral unmixing. In 2015
IEEE International Conference on Computer Vision (ICCV),         [48] Qizhe Xie, Minh-Thang Luong, Eduard Hovy, and Quoc V.
       2015. 2                                                               Le. Self-training with noisy student improves imagenet clas-
[33]   Christian Ledig, Lucas Theis, Ferenc Huszar, Jose Caballero,          sification. In CVPR, 2020. 2
       Andrew Cunningham, Alejandro Acosta, Andrew Aitken,              [49] Qi Xie, Minghao Zhou, Qian Zhao, Deyu Meng, Wangmeng
       Alykhan Tejani, Johannes Totz, Zehan Wang, and Wenzhe                 Zuo, and Zongben Xu. Multispectral and hyperspectral im-
       Shi. Photo-realistic single image super-resolution using a            age fusion by MS/HS fusion net. In CVPR, 2019. 2
       generative adversarial network. In CVPR, 2017. 2                 [50] F. Yasuma, T. Mitsunaga, D. Iso, and S. K. Nayar. General-
[34]   Qiang Li, Qi Wang, and Xuelong Li. Mixed 2d/3d convolu-               ized assorted pixel camera: Postcapture control of resolution,
       tional network for hyperspectral image super-resolution. Re-          dynamic range, and spectrum. IEEE Transactions on Image
       mote Sensing, 12(10), 2020. 2, 5, 6, 7, 8, 12, 13, 14, 15,            Processing, 19(9):2241–2253, 2010. 5
       16                                                               [51] N. Yokoya, C. Grohnfeldt, and J. Chanussot. Hyperspec-
[35]   Y. Li, Lei Zhang, C. Ding, Wei Wei, and Y. Zhang. Single              tral and multispectral data fusion: A comparative review of
       hyperspectral image super-resolution with grouped deep re-            the recent literature. IEEE Geoscience and Remote Sensing
       cursive residual network. 2018 IEEE Fourth International              Magazine, 5(2):29–56, 2017. 2
       Conference on Multimedia Big Data (BigMM), 2018. 2, 5, 6,        [52] N. Yokoya and A. Iwasaki. Airborne hyperspectral data over
       7, 8, 12, 13, 14, 15, 16                                              chikusei. Space Application Laboratory, University of Tokyo,
[36]   L. Loncan, L. B. de Almeida, J. M. Bioucas-Dias, X. Briot-            Japan, Tech. Rep. SAL-2016-05-27, May 2016. 5
       tet, J. Chanussot, N. Dobigeon, S. Fabre, W. Liao, G. A.         [53] Jaejun Yoo, Namhyuk Ahn, and Kyung-Ah Sohn. Rethink-
       Licciardi, M. Simões, J. Tourneret, M. A. Veganzones, G.             ing data augmentation for image super-resolution: A com-
       Vivone, Q. Wei, and N. Yokoya. Hyperspectral pansharpen-              prehensive analysis and a new strategy. In CVPR, 2020. 4,
       ing: A review. IEEE Geoscience and Remote Sensing Mag-                6
       azine, 3(3):27–46, 2015. 6                                       [54] Y. Yuan, X. Zheng, and X. Lu. Hyperspectral image super-
[37]   Guolan Lua and Baowei Fei. Medical hyperspectral imaging:             resolution by transfer learning. IEEE Journal of Selected
       a review. Journal of Biomedical Optics, 2014. 1                       Topics in Applied Earth Observations and Remote Sensing,
[38]   Shaohui Mei, Xin Yuan, Jingyu Ji, Yifan Zhang, Shuai Wan,             10(5):1963–1974, 2017. 2
       and Qian Du. Hyperspectral image spatial super-resolution        [55] R. H. Yuhas, A. F. Goetz, and booktitle=JPL, Summaries of
       via 3d full convolutional neural network. Remote Sensing,             the Third Annual JPL Airborne Geoscience Workshop year
       9(11), 2017. 2, 5, 6, 7, 8, 12, 13, 14, 15, 16                        = 1992 J. W. Boardman, title=Discrimination among semi-
[39]   N. M. Nasrabadi. Hyperspectral target detection : An                  arid landscape endmembers using the spectral angle mapper
       overview of current and future challenges. IEEE Signal Pro-           (sam) algorithm. 6
       cessing Magazine, 31(1):34–44, 2014. 1                           [56] Amir Zamir, Alexander Sax, Teresa Yeo, Oğuzhan Kar,
[40]   Rang M. H. Nguyen, Dilip K. Prasad, and Michael S. Brown.             Nikhil Cheerla, Rohan Suri, Zhangjie Cao, Jitendra Malik,
       Training-based spectral reconstruction from a single rgb im-          and Leonidas Guibas. Robust learning through cross-task
       age. In ECCV, 2014. 2                                                 consistency. In CVPR. 2020. 2
[41]   Ying Qu, Hairong Qi, and Chiman Kwan. Unsupervised               [57] Hongyi Zhang, Moustapha Cisse, Yann N. Dauphin, and
       sparse dirichlet-net for hyperspectral image super-resolution.        David Lopez-Paz. mixup: Beyond empirical risk minimiza-
       In CVPR, 2018. 2                                                      tion. In International Conference on Learning Representa-
[42]   Baifeng Shi, Judy Hoffman, Kate Saenko, Trevor Darrell,               tions, 2018. 4, 6
       and Huijuan Xu. Auxiliary task reweighting for minimum-          [58] Lei Zhang, Jiangtao Nie, Wei Wei, Yanning Zhang, Shengcai
       data learning. In NeurIPS, 2020. 2, 8                                 Liao, and Ling Shao. Unsupervised adaptation learning for
[43]   W. Shi, J. Caballero, F. Huszár, J. Totz, A. P. Aitken, R.           hyperspectral imagery super-resolution. In CVPR, 2020. 2
       Bishop, D. Rueckert, and Z. Wang. Real-time single im-           [59] Yulun Zhang, Yapeng Tian, Yu Kong, Bineng Zhong, and
       age and video super-resolution using an efficient sub-pixel           Yun Fu. Residual dense network for image super-resolution.
       convolutional neural network. In CVPR, 2016. 4                        2
[44]   Z. Shi, C. Chen, Z. Xiong, D. Liu, and F. Wu. Hscnn+: Ad-        [60] Y. Zhao, Jinxiang Yang, Qingyong Zhang, L. Song,
       vanced cnn-based hyperspectral recovery from rgb images.              Y. Cheng, and Q. Pan. Hyperspectral imagery super-
       In IEEE/CVF Conference on Computer Vision and Pattern                 resolution by sparse representation and spectral regulariza-
       Recognition Workshops (CVPRW), 2018. 2                                tion. EURASIP Journal on Advances in Signal Processing,
[45]   Antti Tarvainen and Harri Valpola. Mean teachers are better           2011:1–10, 2011. 2
       role models: Weight-averaged consistency targets improve         [61] Y. Zhou, A. Rangarajan, and P. D. Gader. An integrated ap-
       semi-supervised deep learning results. 2017. 2                        proach to registration and fusion of hyperspectral and multi-
[46]   Simon Vandenhende, Stamatios Georgoulis, Marc Proes-                  spectral images. IEEE Transactions on Geoscience and Re-
       mans, Dengxin Dai, , and Luc Van Gool. Multi-task learning            mote Sensing, 58(5):3020–3033, 2020. 2
       for dense prediction tasks: A survey, 2020. 2                    [62] Zhou Wang, A. C. Bovik, H. R. Sheikh, and E. P. Simon-
[47]   L. Wald. Data fusion: definitions and architectures: fusion           celli. Image quality assessment: from error visibility to struc-
       of images of different spatial resolutions. In Presses des            tural similarity. IEEE Transactions on Image Processing,
       MINES, 2002. 6                                                        13(4):600–612, 2004. 6
6. Supplementary Material
6.1. Further results for scaling factor ×4
Due to space limitation, only results under three metrics,
i.e., RMSE, MPSNR, and ERGAS, are reported in the main
paper. Here, we report the results under all six considered
metrics, i.e., RMSE, CC, MPSNR, MSSIM, ERGAS, and
SAM. For the case of scaling factor ×4 and in the semi-
supervised setting, the results on the CAVE dataset, the Har-
vard dataset, the NTIRE2020 dataset are shown in Table 7,
Table 8 and Table 9, respectively. The results under the full-
supervision setting on the CAVE dataset and on the Harvard
dataset are reported in Table 10 and Table 11 1 .
These tables show that our method outperforms other
comparison methods by a large margin under all six metrics.
All our three contributions are useful and their combination
yields the best results. The conclusions we have in the main
paper hold for all the six metrics.
6.2. Results for scaling factor ×8
We also provide results for scaling factor ×8. The results
on the CAVE, the Harvard, and the NTIRE2020 datasets in
the semi-supervised setting are shown in Table 12, Table
13, and Table 14, respectively. It is evident from these ta-
bles that our method also outperforms other methods sig-
nificantly and consistently for scaling factor ×8. The same
trend is observed for both ×x4 and ×x8 that all our three
contributions are useful and their combination yields the
best results. This demonstrates the applicability of our
method across different scaling factors.
6.3. More visual results
We also provide more visual results on the NTIRE2020
datasets. For visualization, we use the same method as in
the main paper. More specifically, we sample the 5th band,
the 15th band and the 25th band of the hyperspectral image
and assemble them together as an RGB image for visual-
ization. The results of all methods on two different images
for scaling factor ×8 are provided in Fig. 4 and Fig. 5.
To facilitate the comparison, we also show the error maps
of all methods. The values in the error maps are the L2
distance between the predicted pixel values and the ground-
truth pixel values, averaged over the three bands. It is clear
from the visual results that our method generates better re-
sults than other methods. For instance, it produces sharper
boundaries and less artefact.
1 The results on the NTIRE2020 dataset have not completed before the
deadline unfortunately, but the obtained results show that the variants of
our method with only a subset of our contributions already outperform all
the competing methods.Components Metrics
Methods RGB SR Spec Mixup SSL RMSE ↓ CC ↑ MPSNR ↑ MSSIM ↑ ERGAS ↓ SAM ↓
Ours 0.01451 0.99158 40.83762 0.95924 4.03386 4.16312
Ours 3 0.01309 0.99282 41.64471 0.96379 3.70783 4.04210
Ours 3 0.01353 0.99237 41.51967 0.96175 3.78138 3.75827
Ours 3 3 0.01253 0.99309 42.01961 0.96479 3.58920 3.73269
Ours 3 3 0.01281 0.99296 41.81709 0.96483 3.64962 3.88154
Ours (final) 3 3 3 0.011909 0.99354 42.35848 0.96679 3.44471 3.78471
BicubicInt. - - - 0.01856 0.98682 38.73800 0.94197 5.27190 4.17591
GDRRN [35] - - - 0.02462 0.97819 36.27752 0.90681 7.00437 8.77122
3DFCNN [38] - - - 0.01738 0.98182 38.39284 0.94719 6.70559 6.93475
SSPSR [26] - - - 0.01448 0.99152 40.91316 0.95769 4.04064 4.07571
MCNet [34] - - - 0.01461 0.99046 40.73858 0.95691 4.16595 4.59995
Table 7: Results of our method and other comparison methods on the CAVE dataset in the semi-sueprvised setting for the
×4 case.
Components Metrics
Methods RGB SR Spec Mixup SSL RMSE ↓ CC ↑ MPSNR ↑ MSSIM ↑ ERGAS ↓ SAM ↓
Ours 0.014064 0.95902 40.46614 0.92537 3.17093 2.55144
Ours 3 0.01371 0.95985 40.70068 0.92700 3.09505 2.54837
Ours 3 0.01375 0.95951 40.63699 0.92726 3.12395 2.54555
Ours 3 3 0.01345 0.96077 40.80595 0.92896 3.06239 2.53140
Ours 3 3 0.01359 0.96003 40.75872 0.92855 3.07786 2.54378
Ours (final) 3 3 3 0.01331 0.96111 40.93154 0.93004 3.01392 2.52215
BicubicInt. - - - 0.01678 0.94994 38.89758 0.90925 3.80698 2.61754
GDRRN [35] - - - 0.01609 0.94356 38.69531 0.91265 4.30316 3.05361
3DFCNN [38] - - - 0.01578 0.95213 39.34413 0.91655 3.61724 2.72764
SSPSR [26] - - - 0.01427 0.95818 40.32095 0.92356 3.22745 2.55649
MCNet [34] - - - 0.01468 0.95779 40.18739 0.92140 3.26059 2.67236
Table 8: Results of our method and other comparison methods on the Harvard dataset in the semi-supervised setting for the
×4 case.
Components Metrics
Methods RGB SR Spec Mixup SSL RMSE ↓ CC ↑ MPSNR ↑ MSSIM ↑ ERGAS ↓ SAM ↓
Ours 0.01602 0.99114 38.31541 0.93878 2.20746 1.14009
Ours 3 0.01518 0.99198 38.78697 0.94278 2.10917 1.14217
Ours 3 0.01563 0.99156 38.58965 0.94044 2.14927 1.14638
Ours 3 3 0.01509 0.99202 38.83281 0.94287 2.09676 1.13495
Ours 3 3 0.01526 0.99194 38.72326 0.94269 2.11944 1.13183
Ours (final) 3 3 3 0.01485 0.99226 38.96572 0.94413 2.06742 1.12279
BicubicInt. - - - 0.02353 0.98297 34.74012 0.90050 3.19014 3.89655
GDRRN [35] - - - 0.01973 0.98578 36.07932 0.91738 2.81751 2.19765
3DFCNN [38] - - - 0.02083 0.98732 35.66309 0.91799 2.82460 1.69877
SSPSR [26] - - - 0.01635 0.99078 38.07401 0.93691 2.25392 1.43442
MCNet [34] - - - 0.01680 0.99051 38.02486 0.93599 2.28342 1.45320
Table 9: Results of our method and other comparison methods on the NTIRE2020 dataset in the semi-supervised setting for
the ×4 case.Components Metrics
Methods RGB SR Spec Mixup RMSE ↓ CC ↑ MPSNR ↑ MSSIM ↑ ERGAS ↓ SAM ↓
Ours 0.01196 0.99350 42.38359 0.96631 3.45903 4.00592
Ours 3 0.01109 0.99422 42.73668 0.96869 3.35884 4.17068
Ours 3 0.01134 0.99397 42.88402 0.96798 3.28051 3.47102
Ours (final) 3 3 0.01068 0.99447 43.32421 0.96980 3.11799 3.68885
GDRRN [35] - - 0.01629 0.98975 39.74705 0.94418 4.52683 5.39660
3DFCNN [38] - - 0.01583 0.98538 39.21786 0.95165 5.41798 6.49516
SSPSR [26] - - 0.01245 0.99317 42.13787 0.96457 3.55146 3.83398
MCNet [34] - - 0.01245 0.99283 42.25978 0.96465 3.56246 3.84976
Table 10: Results of our method and other comparison methods on the CAVE dataest in the fully supervised case for the ×4
case.
Components Metrics
Methods RGB SR Spec Mixup RMSE ↓ CC ↑ MPSNR ↑ MSSIM ↑ ERGAS ↓ SAM ↓
Ours 0.01344 0.96101 40.91014 0.92836 3.01039 2.50704
Ours 3 0.01325 0.96165 41.03709 0.92949 2.96643 2.49562
Ours 3 0.01317 0.96200 41.08568 0.93056 2.95718 2.49771
Ours (final) 3 3 0.01321 0.96178 41.05925 0.93016 2.96496 2.49897
GDRRN [35] - - 0.01484 0.95102 39.62759 0.92013 3.67932 2.78624
3DFCNN [38] - - 0.01519 0.95411 39.66271 0.91944 3.47738 2.63534
SSPSR [26] - - 0.01352 0.96059 40.81499 0.92806 3.05007 2.51185
MCNet [34] - - 0.01405 0.96009 40.59229 0.92658 3.10529 2.59147
Table 11: Results of our method and other comparison methods on the Harvard dataset in the fully supervised case for the
×4 case.
Components Metrics
Methods RGB SR Spec Mixup SSL RMSE ↓ CC ↑ MPSNR ↑ MSSIM ↑ ERGAS ↓ SAM ↓
Ours 0.02459 0.97233 35.89888 0.90591 7.11644 7.50539
Ours 3 0.02300 0.97545 36.50494 0.91358 6.62181 6.89221
Ours 3 0.02339 0.97705 36.64775 0.91078 6.45075 6.40468
Ours 3 3 0.02209 0.97923 37.14066 0.91748 6.14668 6.24141
Ours 3 3 0.02237 0.97732 36.87625 0.91685 6.34934 6.31945
Ours (final) 3 3 3 0.02154 0.97963 37.35599 0.92070 6.00466 5.62054
BicubicInt. - - - 0.03042 0.96665 34.22211 0.87386 8.43509 5.89620
GDRRN [35] - - - 0.03473 0.95693 32.93635 0.83473 9.85545 11.05589
3DFCNN [38] - - - 0.02920 0.90523 32.90242 0.87942 16.72651 10.43919
SSPSR [26] - - - 0.02485 0.97260 35.88966 0.89926 7.03941 7.33639
MCNet [34] - - - 0.02802 0.95804 34.31165 0.88028 10.29851 7.68969
Table 12: Results of our method and other comparison methods on the CAVE dataset in the semi-sueprvised setting for the
×8 case.Components Metrics
Methods RGB SR Spec Mixup SSL RMSE ↓ CC ↑ MPSNR ↑ MSSIM ↑ ERGAS ↓ SAM ↓
Ours 0.02263 0.92668 36.65405 0.86476 4.85976 2.91037
Ours 3 0.02127 0.93172 37.14154 0.87229 4.58089 2.88299
Ours 3 0.02219 0.92789 36.85938 0.86725 4.76278 2.89283
Ours 3 3 0.02117 0.93241 37.18768 0.87294 4.55818 2.85549
Ours 3 3 0.02116 0.93218 37.21642 0.87269 4.55045 2.88124
Ours (final) 3 3 3 0.02100 0.93450 37.35231 0.87345 4.54990 2.88230
BicubicInt. - - - 0.02495 0.91446 35.74092 0.84966 5.47721 3.00931
GDRRN [35] - - - 0.02389 0.91131 35.64417 0.85316 5.72871 3.41440
3DFCNN [38] - - - 0.02379 0.91813 36.05515 0.85651 5.21924 3.09288
SSPSR [26] - - - 0.02282 0.92266 36.45639 0.86174 4.99781 3.07039
MCNet [34] - - - 0.02348 0.92343 36.39212 0.85940 5.05722 3.14259
Table 13: Results of our method and other comparison methods on the Harvard dataset in the semi-supervised setting for the
×8 case.
Components Metrics
Methods RGB SR Spec Mixup SSL RMSE ↓ CC ↑ MPSNR ↑ MSSIM ↑ ERGAS ↓ SAM ↓
Ours 0.02969 0.97146 32.83078 0.84733 4.04429 1.88851
Ours 3 0.02839 0.97343 33.23283 0.85401 3.89444 1.83394
Ours 3 0.03004 0.97055 32.75617 0.84575 4.08821 1.90378
Ours 3 3 0.02800 0.97355 33.23400 0.85870 3.88999 1.83009
Ours 3 3 0.02809 0.97385 33.33009 0.85599 3.85485 1.79814
Ours (final) 3 3 3 0.02799 0.97560 33.45620 0.86001 3.84456 1.76943
BicubicInt. - - - 0.03961 0.95195 29.95891 0.78926 5.45947 5.24567
GDRRN [35] - - - 0.03596 0.95545 30.67236 0.80217 5.12654 3.21549
3DFCNN [38] - - - 0.38575 -0.57977 9.17534 -0.47680 61.62476 163.56878
SSPSR [26] - - - 0.03268 0.96529 31.78969 0.82646 4.49521 2.25976
MCNet [34] - - - 0.03276 0.96623 31.96291 0.82932 4.41695 2.38619
Table 14: Results of our method and other comparison methods on the NTIRE2020 dataset in the semi-supervised setting for
the ×8 case.You can also read