Neural Networks for Dengue Prediction: A Systematic Review
←
→
Page content transcription
If your browser does not render page correctly, please read the page content below
Neural Networks for Dengue Prediction:
                                                                    A Systematic Review
                                                                  Kirstin Roster1 and Francisco A. Rodrigues1
arXiv:2106.12905v1 [cs.LG] 22 Jun 2021

                                         1
                                             Instituto de Ciências Matemáticas e de Computação, Universidade de São Paulo,
                                                                         São Carlos, SP, Brazil.

                                                                                          Abstract
                                                    Objectives: Due to a lack of treatments and universal vaccine, early forecasts of Dengue
                                                are an important tool for disease control. Neural networks are powerful predictive models
                                                that have made contributions to many areas of public health. In this systematic review, we
                                                provide an introduction to the neural networks relevant to Dengue forecasting and review their
                                                applications in the literature. The objective is to help inform model design for future work.
                                                Methods: Following the PRISMA guidelines, we conduct a systematic search of studies
                                                that use neural networks to forecast Dengue in human populations. We summarize the rela-
                                                tive performance of neural networks and comparator models, model architectures and hyper-
                                                parameters, as well as choices of input features.
                                                Results: Nineteen papers were included. Most studies implement shallow neural networks
                                                using historical Dengue incidence and meteorological input features. Prediction horizons tend
                                                to be short. Building on the strengths of neural networks, most studies use granular observa-
                                                tions at the city or sub-national level. Performance of neural networks relative to comparators
                                                such as Support Vector Machines varies across study contexts.
                                                Conclusions: The studies suggest that neural networks can provide good predictions of
                                                Dengue and should be included in the set of candidate models. The use of convolutional,
                                                recurrent, or deep networks is relatively unexplored but offers promising avenues for further
                                                research, as does the use of a broader set of input features such as social media or mobile
                                                phone data.

                                         1      Introduction
                                         Dengue Fever is a mosquito-borne disease with a significant global burden. Half of the world’s
                                         population and 129 countries are at risk of infection [1]. Between 100 and 400 million infections
                                         are registered each year globally [2]. Dengue presents as a flu-like illness with symptoms ranging
                                         from mild to severe. There are four serotypes, meaning up to four infections are possible for
                                         each person over their lifetime, with potentially life-threatening complications arising from severe
                                         Dengue. There is no specific treatment or universal vaccine, and the primary preventative measure
                                         is vector control. This underscores the importance of disease surveillance. Predictive models can
                                         help efficiently allocate public health resources to combat Dengue, with the goal of reducing the
                                         overall disease burden [3]. Dengue incidence is associated with many different risk factors. These
                                         include climate conditions such as rainfall, extreme weather events, and temperature [4, 5, 6], land
                                         use [7], and poverty [8]. These factors may have nonlinear, context-specific, and time-variant effects
                                         on disease incidence, which poses a challenge to disease modeling.

                                                                                              1
The literature on Dengue forecasting is multi-disciplinary, uniting expertise from areas such as
epidemiology, environmental science, computer science, and mathematics. Modeling frameworks
include both theoretical and data-driven approaches. Compartmental models, for example, esti-
mate the dynamics of Dengue infections in a population over time, and are based on extensive
knowledge of the host, vector, and transmission process. Another simulation technique, agent
based modeling is useful for estimating impacts of interventions, such as the release of sterile males
to control the mosquito population [9]. Statistical time series forecasting takes a more data-centric
approach and is effective at modeling the highly auto-correlated nature of Dengue Fever [10, 11].
Machine learning models leverage the increasing data availability on risk factors of disease spread-
ing and offer non-parametric approaches that require less detailed knowledge of the disease and
context [12].
Neural networks are a subset of machine learning algorithms, which have made significant
contributions to medicine and public health, including applications such as medical image analysis
for disease diagnosis [13], identifying abnormalities in signals such as electrocardiographs (ECG)
[14], and optimizing decisions of health care providers, hospitals, and policy-makers [15]. Neural
networks are also used to forecast diseases, including Malaria [16], Influenza. [17], and Covid-19
[18].
This review examines the use of neural networks for Dengue Fever prediction. The objective is
to summarize the existing literature and also provide an introduction to this still somewhat novel
modeling technique. Our contributions are as follows:
• We summarize the technical decisions made in the literature, including architecture selection
and hyper-parameter tuning.
• We examine the data inputs (such as climate or population demographics) and best predictors
of Dengue fever identified in specific contexts.
• We review the relative performance of different neural network architectures and comparator
models, such as other machine learning techniques.
To the knowledge of the authors, no systematic review of the literature on neural networks
applied to Dengue Fever prediction has yet been conducted. Siriyasatien et al (2018) [19] provide a
broader review of data science models applied for Dengue Fever prediction. Racloz et al (2012) [20]
review the literature on surveillance systems for Dengue Fever. The study finds that most papers
use logistic or multiple regression to analyze Dengue risk factors. (Seasonal) Auto-Regressive
Integrated Moving Average (S/ARIMA) models have become a popular choice to incorporate auto-
regressions but are not suitable for all data types. Though also apt at analyzing auto-regressive
behavior, the study does not review any literature on neural networks or machine learning for
Dengue surveillance. We aim to fill this knowledge gap in the present review.
2 A Primer on Neural Networks
This section gives an overview of some of the neural network models that are relevant to Dengue
prediction. We explain the model first intuitively, then mathematically, and focus on feed-forward
neural networks, which are used most often for Dengue prediction. Many high-quality textbooks
and open source tutorials offer a deeper introduction to neural networks (for example [21, 22]).
Several Python libraries include easy-to-use implementations of neural network models (for example
TensorFlow [23], scikit-learn [24], or Keras [25]). We also provide sample code for Dengue prediction
in a Github repository1 .
1 https://github.com/KRoster/NN4Dengue
2Like other machine learning models, neural networks learn to execute specific supervised tasks,
such as predicting the number of Dengue infections, based on a large set of labeled examples. Given
a set of inputs, such as climate conditions, the model learns to estimate the output, such as next
month’s Dengue incidence. After making a first guess, the model looks at the correct answer and
updates its parameters to reduce its error on the next iteration until its predictions are optimized.
Computationally, neural networks are represented as a network of processing units (”neurons” or
”hidden units”) that transform and pass information from one layer to the next. During training,
we distinguish between forward- and backward-propagation, depending on the direction of the
information flow. During the forward-propagation step, input information passes between units,
each time being transformed according to a set of weights and a non-linear activation function.
The prediction error of the output relative to the true label is computed. Back-propagation is
then used to reduce this error on the next iteration: The weights of each unit, the parameters that
define how information is combined, are updated according to their influence on the prediction
error. This combination of forward- and backward-propagation is repeated several times until the
predictions are increasingly accurate.
After this training phase, model performance is tested on a hold-out test set. Since the test set
is not used to train the model, it can give a good indication of how well the model will generalize
to new data, once applied in the real world.
Figure 1: Sample feed-forward neural network architecture
The figure shows a sample neural network architecture with 4 input features, 2 hidden layers with 5 and
2 nodes respectively and a single node in the output layer.
There are many different neural network architectures that are designed for different kinds of
inputs and tasks. The architecture determines how the units are connected, how information flows
through the network, and how many weights need to be optimized. An example of a feed-forward
network is illustrated in figure 1. It shows the forward propagation of information through the
individual neurons of the network, which was described above. The information that is passed
[l]
through a given neuron j in layer l, called its activation aj , is computed as the linear combination
[l] [l] [l−1]
of weights wij , biases bj , and inputs from the previous layer ai , which is passed through a
3nonlinear activation function g [l] :
nl
[l] [l] [l−1] [l]
X
aj = g [l] ( wij ai + bj ) (1)
i=1
[0]
with: aj = Xj (2)
[k]
ŷ = a (3)
where nl is the number of neurons in layer l, k is the number of layers (the input layer is counted
as layer 0), and ŷ is the prediction that is generated in the final layer.
[l] [l]
The gradient of the loss with respect to a given weight wij or bias bj tells the model how
the given parameter needs to be adjusted, with the learning rate α determining the size of the
adjustment:
dL
θ =θ−α (4)
dθ
where θ is a given set of weights or biases to be updated and L is the loss.
A benefit of neural networks is that parameters are updated by the model itself, not predefined
by the researcher. They do not rely on strong assumptions and knowledge of the disease. Yet some
hyper-parameters of neural network models must still be set by the researcher and are generally
determined through a combination of domain knowledge and iterative experimentation. These
hyper-parameters are tuned using a validation set or through cross-validation. Hyper-parameters
may include the learning rate (by how much the weights are updated at each backward propagation
step), the number of epochs (how often the forward and backward propagation steps are repeated),
the mini-batch size (how many training examples are processed at each step), how weights are
initialized (for example all zeros or random values), the number of hidden units in each layer, and
the number of layers. Other important decisions include the choice of activation function in each
layer, the choice of loss function, and the relative size of training, validation, and test sets. The
optimal choices and ranges tested for these hyper-parameters depend, among other aspects, on the
size and type of data available and the nature of the predictive task. One aim of this review is
to summarize the choice of parameters deemed optimal by researchers in the existing literature to
assist future researchers in the hyper-parameter tuning process.
Besides feed-forward neural networks, this review includes two other categories of models used
for Dengue forecasting. Recurrent neural networks (RNN) were developed for the analysis of
sequence data, such as time series (sequences of observations in time) or text (sequences of words).
They are cyclical (they contain loops) and process sequences of inputs together, giving the network
a ”memory” to remember historical feature states. RNNs are used in contexts where the evolution
of input features matters for the target feature, where the prediction relies on information at
multiple time steps. An example is machine translation, where the meaning of a word is influenced
by its context, by the other words in the sentence. The number of Dengue cases may also depend on
the sequence of risk factors or the sequence of previous Dengue incidence. Using time series data,
RNNs may help capture the auto-correlation of the disease and lagged influence of risk factors, such
as rainfall or travel patterns. Within the family of RNNs we distinguish different architectures,
such as Long Short-Term Memory (LSTM) and Gated Recurrent Units (GRU) [26, 27, 28].
Convolutional neural networks (CNN) are another subclass of deep neural network models with
applications in computer vision [29], such as image segmentation and classification. Inputs into
CNNs are three-dimensional - such as a two dimensional image with three color channels, which
form a 3-D matrix of pixel values. The architectures of CNNs include different kinds of operations,
4such as convolution and pooling, which help identify key regions in the image that help make the
final prediction. For example, the model may learn that the presence of a body of water (shiny
pixels in a satellite image) influence the number of Dengue cases we should expect. Crucial in
this example is that the type of relevant landscape feature is not defined by the researcher but
learned by the model. However, CNNs may also be used for data processing prior to prediction,
for example to classify land use (such as vegetation or urban areas) from satellite images, which
are known to influence Dengue spread and which can then be fed into Dengue a separate predictive
model.
The tasks executed by machine learning models in general, and neural networks in particular,
fall into two different categories: classification and prediction. Classification is the process of
assigning a categorical label to an example based on its inputs, such as determining whether a
patient has Dengue fever or a different disease. Prediction is the process of forecasting a future
state based on historical or current inputs, for example predicting next month’s Dengue incidence
from this month’s rainfall.
This review is focused on predictive models of Dengue Fever at the population level. In addition
to classic regression models, we include papers using classification for prediction approaches, which
produce categorical instead of continuous outputs. For example, a model may predict whether a
city will experience an outbreak (binary classification) or which risk category will prevail (multi-
label classification).
3 Methodology
This review follows the Preferred Reporting Items for Systematic Reviews and Meta-Analyses
(PRISMA) statement guidelines [30]. The PRISMA flow chart is represented in figure 2. A
systematic search was conducted using Web of Science/ Knowledge, Scopus (abstract, title, key-
words), PubMed, and Science Direct (abstract, title) databases. References of papers appearing
in the search results were also examined for relevant works. The searches were conducted between
21 July and 17 August 2020 and used the following search string:
”( deep learning OR neural network ) AND dengue”
The papers were examined for inclusion in the review in three stages: by title, by abstract,
and finally by full text. In each phase, the following inclusion and exclusion criteria were applied
liberally to determine which papers would be considered in the next phase. If the information in
the title and/or abstract was inconclusive, the paper was included in the full-text review. Inclusion
and exclusion criteria are as follows:
• Studies must implement a neural network or deep learning technique, either as the main
method or as a comparator model. Reviews of the literature on neural networks for Dengue
forecasting would also be considered.
• Studies must predict Dengue fever incidence or risk. There are no restrictions on the type of
target variable used. For example, the number of Dengue cases, Dengue incidence rate, or a
binary Dengue risk variable are all accepted as target features.
• Studies must examine Dengue in a human population. Models for disease diagnosis of indi-
viduals are excluded. Studies modeling the location of vectors without relation to Dengue
incidence are excluded. Studies examining animal hosts are excluded.
• As the search query is in English, only English language articles were identified and included
in the review.
5Records identified through data- Additional records identified
base searching through references
(n = 149) (n = 31)
Identification
Records after duplicates removed
(n = 143)
Title screened Records excluded
(n = 143) (n = 54)
Screening
Abstract screened Records excluded
(n = 89) (n = 35)
Eligibility
Full-text articles assessed Full-text articles excluded ac-
for eligibility cording to eligibility criteria
(n = 54) (n = 35)
Studies included in quali-
Included
tative & quantitative syn-
thesis
(n = 19)
Figure 2: PRISMA Flow Chart
4 Results
This section summarizes the findings of the review. The full list of papers and their properties are
provided in table 1 at the end of this section.
4.1 Prediction Target
Within the criteria of study selection, there was significant variation in the study specifications,
including the formulation of the target feature. Most studies predict the future number of Dengue
cases based on historical time series. However, there are some notable exceptions. Andersson et
al (2019) [31] predict a static incidence rate at the neighborhood level in Rio de Janeiro, Brazil.
Two studies predict the risk of a Dengue outbreak: Abeyrathna et al (2019) [32] formulate their
task as a binary classification of ’outbreak’ or ’no outbreak’, while Anno et al (2019) [33] classify
cities according to five risk categories.
Early forecasts provide more time for public health response but may have lower confidence. In
most of the selected studies, researchers predict one period ahead corresponding to the measure-
ment frequency of the data used. A single study predicted the present: Livelo and Cheng (2018)
[34] use social media activity in the Philippines to predict the present situation of Dengue infection.
They use a neural network model to classify tweets according to a set of different categories of
Dengue-related topics. Their weekly Dengue index based on this Twitter data is correlated with
6actual Dengue case counts. Koh et al. (2018) [35] compare one and two-week forecast horizons.
Soemsap et al. (2014) [36] use a two-week horizon with weekly data inputs. Dharmawardhana
et al (2017) [37] predict Dengue cases in Sri Lankan districts four weeks ahead using weekly data
on cases, climate, human mobility, and vegetation indices. Chakraborty et al. (2019) [38] use the
longest forecasting horizon. They use three different datasets of Dengue cases, two of which are
weekly (Peru and Puerto Rico), and one which is measured monthly (Philippines). For the weekly
data, they compare three and six month horizons. For the monthly data, they compare a horizon
of six months with one year forecasts. For Peru and the Philippines, the best model changes with
the prediction horizon.
4.2 Data Sources
Figure 3: Variable types used in the selected studies
The figure illustrates how frequently studies included individual data types as well as combinations
thereof. Each row represents a data type and the horizontal bars measure their frequency of inclusion in
the selected papers. The columns represent the combinations of variables, and the vertical bars measure
how often the given combinations occurred.
Besides epidemiological data on the history of Dengue Fever, which is used in all studies, the
most common predictors are meteorological variables (used in 14 studies) (see figure 3). Additional
data sources include: vegetation indices and other landscape features extracted from satellite
images (in two studies), human mobility, specifically mobile phone data (used in one study),
aerial and street view images (in one study), social media data, specifically from Twitter (one
study), vector information (one study), and demography (one study). Three papers use only
epidemiological data.
Most studies examine granular geographic regions, such as cities (nine studies) or districts (six
studies). Two studies even modeled Dengue at the sub-city (neighborhood) level (see figure 4).
7Figure 4: Geographic granularity used in the selected studies
Granular scales can be beneficial in two ways: they allow for local predictions and accordingly
targeted public health response. They also generally result in larger training datasets with more
observations than national or state-level aggregations, which plays to the strength of neural net-
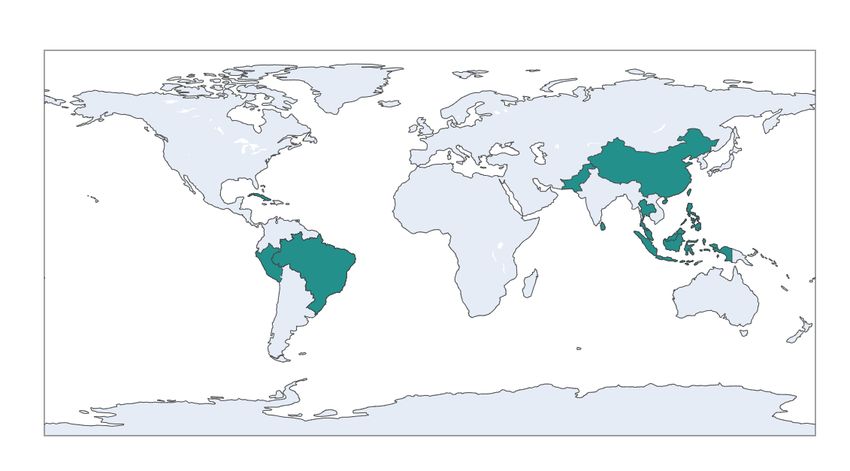
works. The studies cover countries in both Asia and Latin America, which are considered the
primary Dengue endemic regions [3]. A total of 13 countries are included (see figure 5), with the
Philippines and Brazil appearing most often.
Figure 5: Countries covered by the selected studies
4.3 Model Selection
Most studies implement a shallow neural network with just one hidden layer. Four studies use
deeper feed-forward architectures. Three studies employ recurrent neural networks, two of which
used LSTM units and one used a GRU. Three studies implemented CNNs.
The neural network models were compared to a range of other models. Support Vector Machine
8Figure 6: Models used in the selected studies
The figure illustrates how frequently studies used different forecasting models as well as combinations
thereof. Each row represents an algorithm and the horizontal bars measure their frequency of inclusion in
the selected papers. Green rows refer to neural network models, while blue bars show comparator
models, such as machine learning algorithms. The columns illustrate which combinations of models were
used, the frequency of which is measured by the vertical bars.
(SVM) models were most common (six studies). Generalized Additive Models (GAMs), (S)ARIMA
and linear autoregressive (AR) models occurred twice each. The remaining comparators were
used in just one paper each: Gradient Boosting Machine (GBM), XGBoost, Linear regression,
Poisson regression, Tsetlin Machine (TM), Cellular automata, a compartmental model, and a
naive baseline. Figure 6 shows how frequently different model types and combinations thereof
were used in the selected literature.
The most common comparator model used is SVM. Evidence suggests that both SVM and
neural networks perform well, and which is better depends on the context. In Xu et al (2020) [39],
an LSTM neural network outperforms an SVM model in predicting the number of Dengue fever
cases in 20 Chinese cities. Transfer learning further increased the performance gains in cities with
few overall Dengue cases. Abeyrathna et al (2019) [32] use a classification for prediction approach
to identify whether districts in the Philippines are likely to experience a Dengue Fever outbreak.
Whether SVM or the neural network model is better in the context of this study depends on the
evaluation metric used: SVM has a higher precision, while ANN has a higher F1-score. Yusof and
Mustaffa (2011) [40] and Kesorn et al (2015) [41] both find SVM to have a higher performance
than the neural network.
Four studies use a feed-forward network with at least two hidden layers. They provide varying
evidence to the performance relative to shallow neural networks or other machine learning models.
In [37], a model with two hidden layers performs better than an XGBoost model in forecasting
Dengue in Sri Lankan districts. In two studies ([32] and [42]), the deep neural network provides
9better predictions than alternative neural network models, but is not the best model overall: In
[42], the MLP with two hidden layers performs better than the LSTM-RNN to forecast Dengue in
a Brazilian city, but a GAM is best overall. In [32], a model with three hidden layers has lower
errors than models with a single or five hidden layers. However, the best F1 score in classifying
binary outbreak risk is achieved by a Tsetlin Machine. The final study [43] uses a model with
three hidden layers but does not employ any comparator models.
Performance of the RNN models is also mixed. The two studies using LSTM-RNNs produce
contradicting results despite having similar study designs. Baquero et al. (2018) [42] and Xu et
al. (2020) [39] both use LSTM-RNNs to forecast Dengue at the city level, compare their model to
a feed-forward neural network and a GAM, use meteorological and epidemiological input features,
and evaluate performance using RMSE. Xu et al. (2020) [39] find the LSTM to have the best
performance relative to all comparator models, whereas in the study by Baquero et al. (2018) [42],
the LSTM-ANN performs worse than the simple neural network and the best model overall is the
GAM.
The three studies using CNNs do not provide comparisons to other types of models, though
one study compares different CNN architectures. However, the key advantage of the examined
CNN studies is the granular geographic resolution in predictions. The models take satellite and
other images as inputs and can therefore generate forecasts at the sub-city level. Andersson et
al. (2019) [31] compare different kinds of CNN architectures (based on DenseNet-161) for each
of three input types, specifically satellite imagery, street view images, and the combination of the
two. Their model predicts Dengue incidence rates at the neighborhood level in Rio de Janeiro,
Brazil. Best performance is achieved when combining street and aerial images. Rehman et al.
(2019) [44] implement a pre-trained CNN (based on U-Net architecture) to extract landscape
features from satellite imagery, which they use in a compartmental SIR model to forecast Dengue
in neighborhoods of two Pakistani cities. Anno et al. (2019) [33] use a CNN (based on AlexNet
architecture) to classify five levels of outbreak risk in cities in Taiwan, based on images capturing
sea surface temperatures.
4.4 Architecture
Architectures vary across the different models. The studies implementing shallow models with one
hidden layer cumulatively tested 1-30 hidden units. Three studies ([45, 46, 36]) tested a broad
number of values across this range, and their optimal number of hidden units were related to
the number of input features. Two studies [45, 46] identified four hidden units as the optimum.
Both used meteorological and epidemiological variables and both measured four different pieces of
information. Wijekoon et al (2014) [45] used temperature, rainfall, humidity and Dengue cases.
Aburas et al (2010) [46] included a total of seven features that measured the same information but
with additional lags. The third study [36] identified 25 nodes as the optimum, which matches the
larger input size of 32 features. Instead of trying different values, Datoc et al (2016) [47] fixed the
number of hidden units to the number of input features, and selected the best-performing model
among eight models with three to five nodes. The best model used three nodes (corresponding to
three input features).
Abeyrathna et al (2019) [32] compared shallow and deep architectures. Their best neural
network model had three layers with (20, 150, 100) units respectively. This model performed
better than the two shallow models with five or 20 neurons in a single hidden layer. It also
outperformed a five-hidden layer model of (20, 200, 150, 100, 50) topology.
Baquero et al (2018) [42] also used deep architectures with 2 layers with combinations of (10 or
20) neurons in the first layer, and (5 or 10) neurons in the second. They implemented both MLP
and LSTM models. The best neural network model was an MLP with (20,10) neurons, though
a Generalized Additive Model (GAM) and an ensemble both performed better than the neural
10networks.
The other LSTM model was implemented by Xu et al (2020) [39] with a different architecture.
They used a single hidden layer with 64 neurons. Unlike Baquero et al (2018) [42], their model
outperformed GAM as well as SVR and GBM.
4.5 Model Evaluation
The studies utilize a range of metrics to assess model performance, in part due to different predic-
tion targets. The most common measures are Root Mean Squared Error (RMSE) and Pearson’s
correlation, which are each used in seven studies each. Mean Average Error (MAE), Mean Squared
Error (MSE), and accuracy are also commonly used.
5 Discussion
The literature on neural networks applied to Dengue forecasting is still somewhat scarce, but
the reviewed studies include some promising examples, where neural networks outperform other
machine learning or statistical approaches. The literature therefore suggests that neural networks
may be appropriate for inclusion in a set of candidate models when forecasting Dengue incidence.
However there is variation as to whether neural network models or other approaches perform best.
Future research may compare different model types and architectures on multiple datasets, to
better understand how the ideal model varies by context, such as geography or data availability.
Though many risk factors of Dengue have been identified, most neural network models limit
inputs to meteorological and epidemiological data. Future studies may evaluate the value of al-
ternative predictors, especially as NNs tend to deal well with high-dimensional problems. Along
the same lines, there is space for more incorporation of non-causal predictors of Dengue fever from
sources such as social media. Some papers in this review have leveraged these new predictors,
specifically from Twitter [34], Street view and satellite images [31], mobile phone records [37], and
features derived from satellite imagery [37, 44]. These data sources have also been effective with
other machine learning models, for example Baidu search data to predict Dengue in a Chinese
province [12].
Transfer learning was implemented in [39], where it provided promising results. The authors
trained a model on a city with high Dengue incidence and used it to predict disease in lower-
incidence geographies. This was the only study in this review that used transfer learning outside
the context of pre-trained CNNs. This may present another avenue for further research, especially
in locations where data is scarce.
Acknowledgments
Kirstin Roster gratefully acknowledges support from the São Paulo Research Foundation (FAPESP)
(grant number 2019/26595-7). Francisco Rodrigues acknowledges partial support from CNPq
(grant number 309266/2019-0) and FAPESP (grant number 2019/23293-0).
11Reference Country Geospatial scale Target Prediction horizon Input data Variables details (incl. lags) Data aggregation Train/ validation/ test split NN Model Comparator models Evaluation Best model
dengue incidence in the previous-month and
binary outbreak previous-year-same-month of the same region, Feed-forward NN (four Tsetlin Machine (TM), SVM, F1 score, accuracy, best overall: Tsetlin Machine (TM);
Abeyrathna et al. (2019) Philippines district 1 month epidemiological monthly Train: 2008-2015 (89%); Test: 2016 (11%). 30-fold CV
variable historical dengue incidence from the neighboring different architectures) Decision Trees (DT) precision, recall best NN: ANN-3
regions; total dengue incidences
- epidemiological, - mean temperature, mean relative humidity, total
Aburas et al. (2010) Malaysia country cases weekly Train: 104 weeks (32%), Test: 226 weeks (68%) Feed-forward NN RMSE, correlation
meteorological rainfall; Dengue cases with 1 lag
Dengue incidence - epidemiological, - Google street view and aerial images; Dengue incidence rate over Train: 75%, Test: 25%; Val: 10,000 location points StreetSat (both aerial and street
Andersson et al. (2019) Brazil sub-city CNN MAE, correlation
rate satellite/Google street view incidence rates entire period from test set images)
multi-label outbreak - epidemiological; - Train: 588/672 (87.5%) images; Test: 84/672 (12.5%).
Anno et al. (2019) Taiwan city (township) dengue cases, Sea surface temperature (SST) monthly CNN accuracy longitude-time
variable (5 classes) meteorological; - environment 8-fold CV
3 lags of: Dengue cases and temperature (minimum,
- epidemiological, - Train: 2000-2014 (92%), Test: 2015-April 2016 (8%); SARIMA, GAM, naive baseline, best overall: GAM; best NN model:
Baquero et al. (2018) Brazil city cases 1 month mean and maximum), precipitation and relative monthly LSTM, Feed-forward NN RMSE
meteorological Val: time-series CV ensemble MLP
humidity; variable selection varied by model type
San Juan (weekly): Train: May 1990 - April 2011 (98%),
1 year ahead: ARIMA-NNAR in all 3
Test: May-Oct 2011 (2%). Iquitos (weekly): Train: Jul NNAR, Feed-forward NN,
Peru, Philippines, 6 months and 1 Dengue cases; residuals from ARIMA models; lags ARIMA, SVM, LSTM, NNAR, datasets; 6 months ahead:
Chakraborty et al. (2019) city / country cases epidemiological weekly, monthly 2000 - Jun 2011 (96%), Test: Jul-Dec 2011 (4%). hybrids with ARIMA (ARIMA- MAE, RMSE, SMAPE
Puerto Rico year varied by model hybrid ARIMA-NNAR Philippines: NNAR; Iquitos: ARIMA-
Philippines (monthly): Train: 2008-15 (89%), Test: NNAR and ARIMA-ANN)
ANN; San Juan: ARIMA-NNAR
2016 (11%).
all models include total rainfall, average Feed-forward NN with actual
temperature, Dengue case counts at one lag; some weather data using variables: last
- epidemiological; - models also include: percentage relative humidity month’s dengue cases, and this
Datoc et al. (2016) Philippines city cases 1 month monthly Train: 2010-2013 (67%); Test: 2014-2015 (33%) Feed-forward NN correlation
meteorological and a province index; (first set of models used actual month’s total rainfall and average
weather data, second set used averaged monthly temperature and percentage relative
weather data) humidity
- epidemiological, - 4 week lag of Dengue cases (selected as optimal lag
meteorological, - mobile from a choice of 4-12 weeks), daily rainfall,
Dharmawardhana et al. (2017) Sri Lanka district cases 4 weeks weekly Train: 2012 - 2013 (67%); Test: 2014 (33%) Feed-forward NN XGBoost R2 Feed-forward NN
phones / human mobility, - temperature, mobility value (fixed over time),
satellite / vegetation indices vegetation index
parameter β for
García-Garaluz et al. (2011) Cuba city compartmental SIR - epidemiological; Hopfield Neural Network graph (no metric)
model
Average Temperature at 1 lag; Average Temperature
- epidemiological; - at 4 lags; Average Relative Humidity at 1 and 4 lags; MSE, correlation, log sigmoid activation with 4 hidden
Herath et al. (2014) Sri Lanka district cases 1 week weekly Train: 70%, Val: 15%, Test: 15% Feed-forward NN
meteorological Total Rainfall at 4 lags; Number of Rainy Days at 4 MMRE, Pred(25) units
lags; Number of Dengue cases at 1 lag
temperature, rainfall, humidity, wind speed; Ae. SVM (with 3 different kernels:
high-risk region - epidemiological; - seasonal (year Sensitivity,
aegypti larvae infection rate, male mosquito infection linear kernel, radial basis
Kesorn et al. (2015) Thailand district (binary 1 season meteorological; - mosquitoes; - divided into three 10-fold CV Feed-forward NN specificity, and SVM with radial basis function
rate, female mosquito infection rate; population function, and polynomial);
classification) demography seasons) accuracy
density; Dengue infection rate KNN, DT
- epidemiological; - the once-differenced dengue data at one and two
Koh et al. (2018) Singapore country/city cases 1 and 2 weeks weekly time series CV NN(AR2), NN(AR1) AR(2); Poisson regression MSE
meteorological lags, once-differenced rainfall data at three lags
One-vs-Rest Classifier; multi-
Multi-label GRU; Dengue index
Twitter Dengue binary classifier (as opposed to Hamming loss;
Livelo and Cheng (2018) Philippines country present - epidemiological; -social media weekly Dengue case counts, Tweets weekly Train: 60%, Val: 20%, Test: 20% GRU generated using 2 of the 5 Tweet
Index multi-label) which uses the correlation
classes ("absence" and "mosquito")
same GRU architecture.
- epidemiological, - Dengue cases, air temperature data, air humidity,
Rahayu et al. (2019) Indonesia city cases Train: 2007- 2017 (85%); Test: 2018-2019 (15%) Feed-forward NN MSE, correlation
meteorological rainfall, duration of solar radiation and wind speed
mean temperature and precipitation; Dengue cases;
satellite images (classify the time-invariant CNN (landscape feature Adjusted R-squared
- epidemiological; - compartmental model without compartmental model with all 6
Rehman et al. (2019) Pakistan sub-city cases 2 weeks percentage of the city covered by the following 6 2-week time steps train: 25 images classification); used as input to (for classification of
meteorological; - satellite landscape features (TSIR) landscape features
landscape features: roads, waterways, buildings, TSIR model. satellite images)
trees, standing water, crops)
2-6 lags of: minimum temperature, average
- epidemiological; - temperature, average rainfall, maximum rainfall, Cellular Automata (CA) with
Soemsap et al. (2014) Thailand district cases 2 weeks weekly Train: 287 weeks (80%); Test: 72 weeks (20%) Feed-forward NN RMSE, correlation CA
meteorological minimum rainfall, average relative humidity, Genetic Algorithm
minimum relative humidity, Dengue case counts
Sousa et al. (2015) Brazil city cases 1 week - epidemiological Dengue cases at 1-5 lags weekly Train: 70%, Test: 30% Feed-forward NN Linear AR RMSE Feed-forward NN
12 month lags of: Dengue cases, maximum pressure,
average pressure, mean water pressure, maximum
LSTM (with and without
- epidemiological, - air temperature, average of daily highest
Xu et al. (2020) China city cases 1 month monthly Train: 2005-2016 (86%); Test: 2017-2018 (14%) transfer learning), Feed- GAM, SVM, GBM RMSE LSTM
meteorological temperature, average of daily lower temperature,
forward NN
average of daily precipitation, number of days with
rainfall, and average of relative humidity
- epidemiological; -
Yusof and Mustaffa (2011) Malaysia district cases 1 week Dengue cases, rainfall weekly Train: 70%, Test: 30% Feed-forward NN SVM MSE and accuracy SVM
meteorologicalReferences
[1] Oliver J. Brady, Peter W. Gething, Samir Bhatt, Jane P. Messina, John S. Brownstein,
Anne G. Hoen, Catherine L. Moyes, Andrew W. Farlow, Thomas W. Scott, and Simon I.
Hay. Refining the global spatial limits of dengue virus transmission by evidence-based con-
sensus. PLOS Neglected Tropical Diseases, 6(8):1–15, 08 2012.
[2] Samir Bhatt, Peter W Gething, Oliver J. Brady, Jane P. Messina, Andrew W. Farlow, Cather-
ine L. Moyes, John M Drake, John S Brownstein, Anne G. Hoen, Osman Sankoh, Monica
F. Myers, Dylan B. George, Thomas Jaenisch, G. R. William Wint, Cameron P. Simmons,
Thomas W Scott, Jeremy Farrar, and Simon I Hay. The global distribution and burden of
dengue. Nature, 496(7446):504–507, apr 2013.
[3] Who fact sheets: Dengue and severe dengue. https://www.who.int/news-room/
fact-sheets/detail/dengue-and-severe-dengue, June 2020.
[4] Lung-Chang Chien and Hwa-Lung Yu. Impact of meteorological factors on the spatiotemporal
patterns of dengue fever incidence. Environment international, 73C:46–56, 07 2014.
[5] H Thu, K Aye, and Swee Thein. The effect of temperature and humidity on dengue virus
propagation in aedes aegypti mosquitos. The Southeast Asian journal of tropical medicine
and public health, 29:280–4, 06 1998.
[6] Jingchun Fan, Hualiang Lin, C.G. Wang, Li Bai, Shu-Ran Yang, Cordia Chu, W.Z Yang, and
Qi-Yong Liu. Identifying the high-risk areas and associated meteorological factors of dengue
transmission in guangdong province, china from 2005 to 2011. Epidemiology and infection,
142:1–10, 07 2013.
[7] A. Kilpatrick and Sarah Randolph. Drivers, dynamics, and control of emerging vector-borne
zoonotic diseases. Lancet, 380:1946–55, 12 2012.
[8] Kate Mulligan, Jenna Dixon, Chi-Ling Sinn, and Susan Elliott. Is dengue a disease of poverty?
a systematic review. Pathogens and global health, 109:2055033214Y0000000009, 12 2014.
[9] Carlos Isidoro, Nuno Fachada, Fábio Barata, and Agostinho Rosa. Agent-Based Model of
Aedes aegypti Population Dynamics, volume 5816, pages 53–64. 10 2009.
[10] M. Johansson, N. Reich, A. Hota, J.S. Brownstein, and M. Santillana. Evaluating the per-
formance of infectious disease forecasts: A comparison of climate-driven and seasonal dengue
forecasts for mexico. Scientific Reports, 6, 2016.
[11] Pete Riley, Michal Ben-Nun, James Turtle, David Bacon, and Steven Riley. Sarima forecasts
of dengue incidence in brazil, mexico, singapore, sri lanka, and thailand: Model performance
and the significance of reporting delays. medRxiv, 2020.
[12] Pi Guo, Tao Liu, Qin Zhang, Li Wang, Jianpeng Xiao, Qingying Zhang, Ganfeng Luo, Zhihao
Li, Jianfeng He, Yonghui Zhang, and Wenjun Ma. Developing a dengue forecast model using
machine learning: A case study in china. PLOS Neglected Tropical Diseases, 11(10):1–22, 10
2017.
[13] Adnan Qayyum, S. Anwar, M. Majid, M. Awais, and M. Alnowami. Medical image analysis
using convolutional neural networks: A review. Journal of Medical Systems, 42:1–13, 2018.
[14] K. Papik, B. Molnar, Rainer Dr Schaefer, Z. Dombóvári, Z. Tulassay, and J. Feher. Application
of neural networks in medicine - a review. 1998.
13[15] Nida Shahid, Tim Rappon, and Whitney Berta. Applications of artificial neural networks in
health care organizational decision-making: A scoping review. PLOS ONE, 14(2):1–22, 02
2019.
[16] Kate Zinszer, Aman D Verma, Katia Charland, Timothy F Brewer, John S Brownstein,
Zhuoyu Sun, and David L Buckeridge. A scoping review of malaria forecasting: past work
and future directions. BMJ Open, 2(6), 2012.
[17] Ali Alessa and M. Faezipour. A review of influenza detection and prediction through social
networking sites. Theoretical Biology & Medical Modelling, 15, 2017.
[18] Joseph Aylett-Bullock, Alexandra Luccioni, Katherine Pham, Cynthia Lam, and Miguel
Luengo-Oroz. Mapping the landscape of artificial intelligence applications against covid-19.
Journal of Artificial Intelligence Research, 69:807–845, 11 2020.
[19] P. Siriyasatien, S. Chadsuthi, K. Jampachaisri, and K. Kesorn. Dengue epidemics prediction:
A survey of the state-of-the-art based on data science processes. IEEE Access, 6:53757–53795,
2018.
[20] Vanessa Racloz, Rebecca Ramsey, Shilu Tong, and Wenbiao Hu. Surveillance of dengue fever
virus: A review of epidemiological models and early warning systems. PLOS Neglected Tropical
Diseases, 6(5):1–9, 05 2012.
[21] Li Deng and Dong Yu. Deep learning: methods and applications. Foundations and trends in
signal processing, 7(3–4):197–387, 2014.
[22] S. Haykin. Neural Networks: A Comprehensive Foundation. International edition. Prentice
Hall, 1999.
[23] Martin Abadi, Paul Barham, Jianmin Chen, Zhifeng Chen, Andy Davis, Jeffrey Dean,
Matthieu Devin, Sanjay Ghemawat, Geoffrey Irving, Michael Isard, Manjunath Kudlur, Josh
Levenberg, Rajat Monga, Sherry Moore, Derek G. Murray, Benoit Steiner, Paul Tucker, Vi-
jay Vasudevan, Pete Warden, Martin Wicke, Yuan Yu, and Xiaoqiang Zheng. Tensorflow: A
system for large-scale machine learning. In 12th USENIX Symposium on Operating Systems
Design and Implementation (OSDI 16), pages 265–283, 2016.
[24] F. Pedregosa, G. Varoquaux, A. Gramfort, V. Michel, B. Thirion, O. Grisel, M. Blondel,
P. Prettenhofer, R. Weiss, V. Dubourg, J. Vanderplas, A. Passos, D. Cournapeau, M. Brucher,
M. Perrot, and E. Duchesnay. Scikit-learn: Machine learning in Python. Journal of Machine
Learning Research, 12:2825–2830, 2011.
[25] François Chollet et al. Keras. https://keras.io, 2015.
[26] Sepp Hochreiter and Jürgen Schmidhuber. Long short-term memory. Neural Comput.,
9(8):1735–1780, November 1997.
[27] Jürgen Schmidhuber. Deep learning in neural networks: An overview. Neural Networks,
61:85–117, Jan 2015.
[28] Zachary Lipton. A critical review of recurrent neural networks for sequence learning. 05 2015.
[29] Yann LeCun, Bernhard Boser, John Denker, Donnie Henderson, R. Howard, Wayne Hubbard,
and Lawrence Jackel. Handwritten digit recognition with a back-propagation network. In
D. Touretzky, editor, Advances in Neural Information Processing Systems, volume 2, pages
396–404. Morgan-Kaufmann, 1990.
14[30] David Moher, Alessandro Liberati, Jennifer Tetzlaff, Douglas G. Altman, and The PRISMA
Group. Preferred reporting items for systematic reviews and meta-analyses: The prisma
statement. PLOS Medicine, 6(7):1–6, 07 2009.
[31] V. O. Andersson, C. Cechinel, and R. M. Araujo. Combining street-level and aerial images for
dengue incidence rate estimation. In 2019 International Joint Conference on Neural Networks
(IJCNN), pages 1–8, 2019.
[32] Kuruge Abeyrathna, Ole-Christoffer Granmo, Xuan Zhang, and Morten Goodwin. A scheme
for continuous input to the tsetlin machine with applications to forecasting disease outbreaks.
pages 564–578, 06 2019.
[33] Sumiko Anno, Takeshi Hara, Hiroki Kai, Ming-An Lee, Yi Chang, Kei Oyoshi, Yousei
Mizukami, and Takeo Tadono. Spatiotemporal dengue fever hotspots associated with cli-
matic factors in taiwan including outbreak predictions based on machine-learning. Geospatial
Health, 14, 11 2019.
[34] E. D. Livelo and C. Cheng. Intelligent dengue infoveillance using gated recurrent neural
learning and cross-label frequencies. In 2018 IEEE International Conference on Agents (ICA),
pages 2–7, 2018.
[35] Yew-Meng Koh, Reagan Spindler, Matthew Sandgren, and Jiyi Jiang. A model comparison
algorithm for increased forecast accuracy of dengue fever incidence in singapore and the aux-
iliary role of total precipitation information. International Journal of Environmental Health
Research, 28:1–18, 07 2018.
[36] T. Soemsap, S. Wongthanavasu, and W. Satimai. Forecasting number of dengue patients using
cellular automata model. In 2014 International Electrical Engineering Congress (iEECON),
pages 1–4, 2014.
[37] K. G. S. Dharmawardana, J. N. Lokuge, P. S. B. Dassanayake, M. L. Sirisena, M. L. Fernando,
A. S. Perera, and S. Lokanathan. Predictive model for the dengue incidences in sri lanka
using mobile network big data. In 2017 IEEE International Conference on Industrial and
Information Systems (ICIIS), pages 1–6, 2017.
[38] Tanujit Chakraborty, Swarup Chattopadhyay, and Indrajit Ghosh. Forecasting dengue epi-
demics using a hybrid methodology. Physica A: Statistical Mechanics and its Applications,
527:121266, 2019.
[39] Jiucheng Xu, Keqiang Xu, Zhichao Li, Fengxia Meng, Taotian Tu, Lei xu, and Qi-Yong Liu.
Forecast of dengue cases in 20 chinese cities based on the deep learning method. International
Journal of Environmental Research and Public Health, 17:453, 01 2020.
[40] Yuhanis Yusof and Zuriani Mustaffa. Dengue outbreak prediction: A least squares support
vector machines approach. International Journal of Computer Theory and Engineering, 3:489–
493, 01 2011.
[41] Kraisak Kesorn, Phatsavee Ongruk, Jakkrawarn Chompoosri, Atchara Phumee, Usavadee
Thavara, Apiwat Tawatsin, and Padet Siriyasatien. Morbidity rate prediction of dengue
hemorrhagic fever (dhf) using the support vector machine and the aedes aegypti infection
rate in similar climates and geographical areas. PLOS ONE, 10(5):1–16, 05 2015.
[42] Oswaldo Santos Baquero, Lidia Maria Reis Santana, and Francisco Chiaravalloti-Neto. Dengue
forecasting in são paulo city with generalized additive models, artificial neural networks and
seasonal autoregressive integrated moving average models. PLOS ONE, 13(4):1–12, 04 2018.
15[43] I Rahayu, N Nurhasanah, and R Adriat. Prediction of dengue hemorrhagic fever cases based
on weather parameters using back propagation neural networks (case study in pontianak city).
Jurnal Pendidikan Fisika Indonesia, 15:114–121, 07 2019.
[44] N. Rehman, U. Saif, and R. Chunara. Deep landscape features for improving vector-borne
disease prediction. In CVPR Workshops, 2019.
[45] Himesha Wijekoon, P. Herath, and A. Perera. Prediction of dengue outbreaks in sri lanka
using artificial neural networks. International Journal of Computer Applications, 101:1, 09
2014.
[46] Hani Aburas, Gültekin Çetiner, and Murat Sari. Dengue confirmed-cases prediction: A neural
network model. Expert Systems with Applications, 37:4256–4260, 06 2010.
[47] Hillary Datoc, Romeo Caparas, and Jaime Caro. Forecasting and data visualization of dengue
spread in the philippine visayas island group. pages 1–4, 07 2016.
[48] Esther Garcı́a-Garaluz, Miguel Atencia, Gonzalo Joya, Francisco Garcı́a-Lagos, and Francisco
Sandoval. Hopfield networks for identification of delay differential equations with an applica-
tion to dengue fever epidemics in cuba. Neurocomputing, 74(16):2691 – 2697, 2011. Advances
in Extreme Learning Machine: Theory and Applications Biological Inspired Systems. Com-
putational and Ambient Intelligence.
[49] Larissa Braz Sousa, Claudio Zuben, and Fernando Von Zuben. Regularized linear and nonlin-
ear autoregressive models for dengue confirmed-cases prediction. volume 9252, pages 132–143,
08 2015.
16You can also read