Beyond "Local", "Categories" and "Friends": Clustering foursquare Users with Latent "Topics"
←
→
Page content transcription
If your browser does not render page correctly, please read the page content below
Beyond “Local”, “Categories” and “Friends”: Clustering
           foursquare Users with Latent “Topics”
             Kenneth Joseph                              Chun How Tan                      Kathleen M. Carley
        Carnegie Mellon University                 Carnegie Mellon University          Carnegie Mellon University
             5000 Forbes Ave.                           5000 Forbes Ave.                     5000 Forbes Ave.
           Pittsburgh, PA 15212                       Pittsburgh, PA 15212                 Pittsburgh, PA 15212
           kjoseph@cs.cmu.edu                         chunhowt@cmu.edu                 kathleen.carley@cs.cmu.edu

ABSTRACT                                                            time [18, 17, 16, 6]. These areas, particularly in cities, are
In this work, we use foursquare check-ins to cluster users          often representative of different neighborhoods - areas in
via topic modeling, a technique commonly used to classify           cities with dynamic, fuzzy boundaries [7, 8] whose residents
text documents according to latent “themes”. Here, however,         exhibit homophilic tendencies, both in their demographics
the latent variables which group users can be thought of not        and social interactions [9]. Because of the importance of
as themes but rather as factors which drive check in behav-         neighborhoods in a diverse set of social processes (e.g. [21]),
iors, allowing for a qualitative understanding of influences        a natural way of conceptualizing groups of people in cities
on user check ins. Our model is agnostic of geo-spatial lo-         is to cluster them based on the neighborhoods in which they
cation, time, users’ friends on social networking sites and         reside or are most active.
the venue categories- we treat the existence of and intricate
interactions between these factors as being latent, allowing        Yet while heterogeneity in a population can to a large extent
them to emerge entirely from the data. We instantiate our           be explained by closeness of social and geodesic distances
model on data from New York and the San Francisco Bay               [4] (a closeness inherent in neighborhoods), there are other
Area and find evidence that the model is able to identify           ways of defining “groups” of people in cities. For exam-
groups of people which are of different types (e.g. tourists),      ple, one could consider tourists, who almost by definition
communities (e.g. users tightly clustered in space) and inter-      are not bound to specific parts of a city, as being a group
ests (e.g. people who enjoy athletics).                             of interest. Similarly, sports enthusiasts, bound not to neigh-
                                                                    borhoods but more to the specific places (e.g. stadiums) they
Author Keywords                                                     frequent, may be of interest as well. These two examples
location-based service, foursquare, topic modeling                  represent interesting and useful groupings of people moving
                                                                    within cities which the concept of a neighborhood cannot
                                                                    fully capture.
ACM Classification Keywords
H.5.m Information Interfaces and Presentation: (e.g. HCI);          In this work, we consider an alternate approach to defining
J.4 Social and Behavioral Sciences: Sociology                       groups of people in a city by characterizing people simply
                                                                    by the places they go. Such an approach has previously been
INTRODUCTION                                                        found effective for uncovering social and interest relation-
There has long been an interest in understanding how, when,         ships between users as well as for location and friend rec-
where and why people move from place to place [14]. In              ommendations, though the approach taken also considered
recent years, such studies have begun to focus more on the          temporal information and utilized a different type of location
large amount of geo-spatially tagged data being produced            data [10, 27]. We work with a large dataset of foursquare
from mobile devices, as such data allows one to approach            check ins, obtained from the authors of [7], which details
questions of societal-level interest in an entirely data-driven     where and when people were at specific locations around
manner [26, 7, 27]. Data drawn from mobile devices on the           different U.S. cities. While the dataset gives a diverse set of
whereabouts of their users has led to an influx of interest-        information, we describe each user simply by the places they
ing findings in explaining patterns of human mobility [6, 17,       go and how often they go there, thus choosing to ignore geo-
5], predicting friendship on social networking sites based on       spatial and social information which exists in the data. In
location data [23, 20], and better understanding different as-      addition, we ignore information on the category of different
pects of cities, both at the city level as a whole [24] and at      places, as explained in later sections.
the neighborhood level [7, 8].
                                                                    Using such a simple feature set for users is somewhat counter-
A significant amount of previous work on human mobility             intuitive, however, we do so with a specific purpose. First,
has come to the conclusion that people tend to stay within          the relationship between social ties, geodesic distances be-
relatively small geographic areas for the majority of their         tween people and their temporal coevolution are intertwined
                                                                    in an intricate manner which has only recently begun to be
                                                                    understood in a strong quantitative manner [4, 9, 10, 19]. By
Copyright is held by the author/owner(s)
UbiComp ’12, Sep 5-Sep 8, 2012, Pittsburgh, USA.                    only implicitly considering these variables in our data rep-
978-1-4503-1224-0/12/09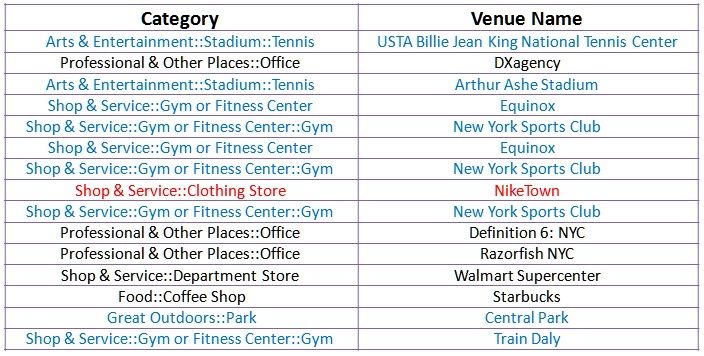
resentation, we allow for them to emerge as latent factors        RELATED WORKS
whose association we need not explicitly predefine. This          The Data
allows a further understanding of how these variables may         The data that we use, obtained from the authors of [7], is
affect the check in behaviors of users. In addition, by not       a set of approximately 18 million data points from across
specifying any presumed factors to be responsible for sim-        the United States of users of foursquare. Foursquare is a
ilar check in locations between users, we avoid restrictions      socially-driven location sharing application [11], where users
of the types of groups our model might find. For example,         can “check in” to different locations and have these check
explicitly using geo-spatial features may restrict our ability    ins be shared with friends both on foursquare and on various
to understand groups of users with similar interests which        other social networking sites. In addition to allowing users
are spread throughout a city, such as the tourists described      to share check ins with others, foursquare uses various gami-
above.                                                            fication techniques to encourage contributions, including re-
                                                                  warding users with badges and points for various actions.
Given that our feature set is simple and we desire an un-
derstanding of what causes users to check in at various lo-       Indeed, these gamification techniques have been found to be
cations, the model we use must allow us to posit that latent      a strong determinant in use of foursquare. Lindqvist et al.
factors affect where users go within cities, quantify how each    [11] found the most likely reason for a check in was for
user is affected by them, and give some intuition as to what      the gamification aspects of the site, followed by social as-
these latent factors might be. We use a clustering model          pects (e.g. to interact with friends), to visit and discover new
based on the idea of topic modeling, a method of clustering       places, and to keep track of personal history and accomplish-
which captures these very concepts. Specifically, our model       ments. Users were also asked for reasons why they would
assumes that every user can be represented by multiple hid-       not check in at a location- these centered on privacy con-
den factors, and that each check in by that user is motivated     cerns and issues of self-representation. Self-representation
by one or more of these hidden variables. These hidden fac-       concerns the fact that users have a desire to be represented
tors may represent, for example, interests or needs of a user,    as being of a certain type, leading to the possibility that a
but the range of their distinction is broad, as topic models      user’s check ins could mis-represent his or her interests. For
force the researcher to determine the qualitative meaning         example, users surveyed tended to not want to check in to
behind the hidden factors it discovers. Users can then be         places which they perceived to be uninteresting (e.g. work)
grouped by how strongly they are affected by these hidden         or embarrassing (e.g. fast food). Such findings are pertinent
factors, and the hidden factors themselves can be defined by      to our understanding of the clusters resulting from our topic
a certain set of locations (or venues) which are frequented       model in that they must be analyzed from the perspective
by the users clustered together by it.                            of the typical user- one that is at least partially interested in
                                                                  gamification and self-representation.
In order to understand what might be gained from a topic
model approach to location-based social network data, we          Each of our 18 million data points represents one check in
instantiate Latent Dirichlet Analysis (LDA) on foursquare         which was published to Twitter by a foursquare user. In the
data from check ins in New York City and the Bay Area.            data set used, a check in provides a unique user Twitter id,
We find that our model produces latent collections of people      the timestamp of the user check in, an optional user descrip-
which represent both geo-spatially close groups and people        tion (e.g. “the coolest place ever!”), and also the venue id of
who appear to have similar interests, thus suggesting social      the check in location. Using this venue’s id, the original data
factors are at play. Our model therefore captures drivers of      collectors also obtain the venue’s name, geo-location, and
user check in behavior found to be so important in grouping       “category” information. These categories are drawn from
people in cities into neighborhoods, lending another piece of     a set of hierarchical categories given by foursquare itself -
support to previous work in this area [7, 9, 4]. However, in      there are over three hundred categories, the full list of which
addition to latent factors indicating groupings due to social     can be found by querying the foursquare API 1 . We utilize
and geo-spatial closeness, we also find clusters of different     these categories extensively in defining the hidden factors
“types” of people, such as tourists, who tend to visit specific   which our topic model generates. From the data set collected
venues which do not seem, qualitatively, to have any clear        by the authors of [7], we consider check ins located in the
geo-spatial or social relevance. Thus, by using a model ag-       metropolitan areas of New York City and the San Francisco
nostic of place category, geo-spatial information and friend-     Bay Area.
ship information, we create a model which is rich enough to
incorporate all of them and extend beyond to include these        Human Mobility
user “types”. This allows for a deeper understanding of user      Noulas et al, in [17], study distances users travel between
check in behavior on location based social networking sites.      successive check ins, noting that nearly 80% of the total
                                                                  check ins for a user occur within 10 kilometers of the pre-
After describing our findings, we discuss some potential ap-      vious check in. Though larger than the typical neighbor-
plications of a topic-model approach, such as venue recom-        hood, this lends support to the idea that people tend to stay
mendation. We also consider ways in which our model is            within small sections of cities and hence can be grouped in
different from preexisting methods of recommendation us-          this manner. Similarly, user displacement, or distance be-
ing similar data [27, 10], with particular concern to note the    tween two successive check ins, follows a power law which
limitations of the current approach.                              1
                                                                      https://developer.foursquare.com/index
can be modeled by a Lévy Flight [5]. Work in [16] shows To cluster foursquare users into meaningful groups which
that across various American cities, the density of the city is are representative of different factors driving check in be-
negatively correlated with user displacement. havior, we apply the idea of topic modeling. Specifically,
we apply a topic model known as Latent Dirichlet Alloca-
While such work suggests that users tend to stay within rea- tion (LDA), first introduced in [3]. LDA is a latent space
sonably small areas, particularly in dense areas, they provide model commonly used to better understand text corpora by
little evidence of the specific places people are traveling to representing a large collection of documents in a much more
at various distances. Cho et al. [6] explain mobility using compact set of hidden topics. In a typical LDA model (as
the concept of two places, home and work, but do not go discussed in [3]) a text document is represented as a set of
in depth into travel to places which might represent user in- words, where each word is assumed to belong to one or more
terests. In contrast, Cranshaw et al., in [7], present an ap- hidden topics. Thus, each document can be described by
proach which utilizes geographic proximity in combination considering how heavily the words within it relate to the var-
with user check in history, thus incorporating a better under- ious hidden topics, and each hidden topic can be described
standing of the specific places people travel to. This infor- by the words which are most heavily associated with it. For
mation is utilized to understand how the existence of “neigh- example, a document about the opening of a new Italian
borhoods” can be approximated by foursquare check ins. restaurant might contain the words “restaurant” and “din-
Our work is different from the work of Cranshaw et al. in ner”, associated with Topic 1, and the words “pizza” and
that we focus on clustering users, as opposed to venues, into “spaghetti”, associated with Topic 2. LDA would give us in-
groups. It is important to notice, however, that the method formation on how heavily the document was related to the
in [7] can be applied without modification to show a variety two topics, and we could understand what these two topics
of neighborhoods around a city which similar users might were about by considering the words which are associated
frequent. Such a model suggests that incorporating venue with them (e.g. Topic 2 is likely about “food” or “Italian
categories as a feature describing user movement restricts Food”). By considering documents which are highly associ-
the formation of neighborhood clusters- each neighborhood ated with the same topic, we can begin to understand “clus-
has its own set of venues within a variety of categories. ters” (or groups) of documents in the corpora, where each
cluster represents a set of documents which are related to a
The question of user clustering, as opposed to venue clus- given topic.
tering, has been previously approached [12, 22, 10], most
noteably in [10], where a hierarchical, temporally aware user Ref. [8] has successfully applied LDA to location check
clustering mechanism (HGSM) is proposed. This method is in data. Specifically, [8] applied a topic-model approach
extended to show its abilities as a recommender system in on socially-tagged data from a location-sharing social net-
[27], where it is shown to perform well on tasks involving work in order to understand boundaries that might exist on
recommending both places and social connections for users. neighborhoods and characteristics of these neighborhoods.
We discuss how this model compares to the one presented In their topic model, the “documents” were regions gen-
here in Section . erated by splitting geo-spatial coordinates into grids, their
“words” were venue category tags, and their topics were hy-
One might be tempted to assume that human movement can pothesized to be archetypal neighborhoods. Note, however,
be much better understood if it is conditioned on the move- that LDA was still performed on text.
ment of friends. Indeed, much work has been done to show
that one can reliably predict the location of a user based on In contrast, we use an instantiation of the data which does
the location of their friends (see [20, 23] for recent exam- not revolve around the concept of themes in text. Rather, in
ples). Furthermore, recent work has shown that neighbor- order to model user check in behaviors using LDA, we use
hoods implied by census boundaries can be inferred from the analogy of a document to represent a user, and thus each
social graphs [9]. However, evidence from [6] suggests that check in for a user can be thought of as a word in a docu-
while location prediction is possible, predicting where a user ment. As each venue has a unique identifier, we can model
will go based on where their friends on location-based ser- each as a unique word. This means, for instance, that the
vices go is not as straightforward. Cho et al. [6] state that Starbucks on 5th Street will be different than the Starbucks
people who are friends on Brightkite and Gowalla have a on 10th Street. Similar to text documents, where documents
check in in common less than ten percent of the time. Fur- can have the same word multiple times, we define a multi-
thermore, the authors find that travel over short distances is nomial distribution for the check ins for each user by using
not heavily impacted by the social network structure - friend- the counts of check ins for each venue as features.
ship links on location-sharing social networks only can ex-
plain about 30% of all check ins. These findings suggest to Using our representation of user check in behavior, we ob-
us that explicitly adding in features of friendship on social tain a set of hidden topics which can each be described by a
networking sites may restrict clusters to community-based set of venues (words), and which can be used to categories
groups, perhaps overpowering other latent variables such as users (documents) according to these topics. Because these
user interests which exist in the data. topics have to do with check ins at different venues, we can
associate them not with textual themes but rather with fac-
tors which drive users to check in at various locations (e.g.
interest). More specifically, for each user, we obtain a set
MODEL DESCRIPTIONof weights corresponding to each hidden topic, allowing us
Category Venue Name
to understand multiple facets of the behavior of each user. “Sport Enthusiast” Cluster
Thus, a benefit of using LDA is that each user can be rep-
resented as a distribution of a variety of drives in behavior. Baseball Stadium Yankee Stadium
This coincides well with our intuition that check in behavior Football Stadium MetLife Stadium
Baseball Stadium Stadium Citi Field
is driven by multiple underlying factors, each of which may Hockey,Basketball Arena Madison Square Garden
be used to correlate the behavior of a user with others and
thus may help to better understand user check in behavior at “Art Enthusiast” Cluster
a general level.
Performing Art Venue NBC Studio 1A
Art Museum Brooklyn Museum
In the case studies below, we set the number of hidden top- Art Museum Metropolitan Museum of Art
ics to be twenty. A shortcoming of LDA, addressed in later Art Museum Museum of Modern Art (MOMA)
topic models (as shown in [3]) is that an arbitrary number of Table 1. Top venues of two clusters found in the New York data. These
hidden topics need be chosen. We complete sensitivity tests, two clusters can be thought of as clustering users based on similar in-
as suggested in [3], and find that our model is most effective terests
and most interpretable when we use twenty clusters. In ad-
dition, we remove those users with less than 5 unique venue case.
check ins and those venues with less than 10 check ins, re-
peating the pruning iteratively until all such venues and users
are removed. This approach of pruning data points is com- Interest Factors
mon in document modeling, as in imperfect documents there We define interest factors as those where the top venues
tend to be spelling mistakes which occur rarely and are ob- within that cluster are all associated with a specific action
viously not of interest. Similarly, in our case, those users which can be performed, such as eating ice cream or watch-
who have few check ins might be newcomers to foursquare ing a sporting event. Two examples of such clusters in the
who quickly stop using the application and thus might not be New York data are shown in Table 1 - similar clusters, not
well-represented by their check ins. However, this pruning shown, are observed in the San Francisco data. In many
criteria is selected arbitrarily and future work in the direction respects, one would question any model of user behavior
of data selection is important. which does not in some way account for the interests of
the user, and as such the fact that our model discovers in-
terests as a hidden driver of user action is not of particular
RESULTS surprise. However, such clusters are of interest in suggest-
In this section, we present two exploratory case studies of ing that certain arguments recently put forth for describing
the results of running LDA on check in data from New York human mobility are too simplistic. In particular, claims that
City and the San Francisco Bay Area. The New York data set simple concepts of geo-spatial phenomenon, as suggested in
initially had a total of 448,156 check ins, 36,388 users and [16], are sufficient to explain human mobility cities should
44,312 venues. After pruning, we were left with 288,029 be treated with some skepticism - our model suggests con-
check ins, 10,459 users and 7,432 venues. Note that we still textual factors, including points of interest at different loca-
keep more than half of the check ins, although the number of tions in cities are clearly of high importance [27]. This can
venues and users decreases significantly. While future work be observed by the relatively wide geo-spatial spread of the
may make use of these data points, we find that including two interest clusters from the New York data, as can be seen
them in the model makes clusters more difficult to interpret, in the clusters with these names in Figure 1.
as is often the case when incorporating analogous words and
documents when running LDA on text corpora. Similarly, In addition to casting doubt on the simplicity of human mo-
for San Francisco Bay Area data, we initially have a to- bility modeling, the existence of clusters of users driven by
tal of 181,572 check ins, 18,650 users and 20,844 venues, what we presume to be similar interests suggests that social
and were left with 102,851 check ins, 4,269 users and 3,439 factors have a strong underlying effect on locations that users
venues after applying the same pruning criteria. check in to. This claim is based on the well-supported notion
that social acquaintances tend to have similar interests [13].
In our analysis, we examine the “top” venues in each clus- Such a finding indicates that a topic model approach to clus-
ter, as given by weights from the LDA. By observing these tering users may be an effective route to generating friend-
venues, we are able to better understand the latent factor ship recommendations [27] with the added benefit of being
which is representative of the users in each cluster. In the able to give reasons for the recommendation which are less
following sections, we provide a qualitative analysis of three intrusive. For example, instead of suggesting to two users
different “kinds” of latent factors that our model uncovers in New York that they may want to become friends because
as being hidden drivers in where users check in. We de- they have both visited Yankee Stadium and MetLife stadium
velop this intuition by considering the geo-spatial distribu- within the past few months, a topic model approach (with
tion and categorical information (garnered from foursquare the assistance of a practitioner) could instead suggest that
category information) of the venues which represent each these two users become friends because they are both “Sport
cluster. Thus, the cluster types that we generate are in some Enthusiasts”. Though other approaches might provide sim-
cases quite similar to the typical category of the venues within ilar functionality, it would likely be on a more case-by-case
that cluster, though we will show that this is not always the basis.Figure 1. The geo-spatial distribution of the twenty clusters our model discovers in New York - each point represents one of the top twenty venues
in each cluster. Those clusters assessed which could be qualitatively associated with a name are labeled with these names, as discussed in the paper.
Those with numbers are not qualitatively assessed in this work-they are shown to give a better understanding of spatial distribution of clusters
Category Venue Name Category Venue Name
Bridge George Washington Bridge Gay Bar Toad Hall
Gay Bar Therapy NYC Park Mission Dolores Park
Gay Bar Boxers NYC Sportsbar Gay Bar Badlands
Gay Bar Ritz Bar and Lounge Gay Bar QBar
Gay Bar Splash Bar Gay Bar Club Trigger
American Restaurant Elmo Restaurant and Lounge Gay Bar The Lookout
Gym Equinox Burger Joint Harvey’s
Gay Bar Posh Gay Bar 440 Castro
Train Station New York Penn Station Gay Bar Blackbird Bar
Gay Bar Pieces Bar Gay Bar The Mix
Coffee Shop Starbucks Supermarket Safeway
Gay Bar XES Lounge Movie Theater AMC Loews Metreon 16
Gay Bar Barrage Gay Bar Moby Dick
Train Station Castro MUNI Metro Station
Table 2. A cluster consisting mainly of gay bars, found in the New York
data Table 3. The San Francisco “gay bar” cluster. These venues are all
found in The Castro, an area with a large gay population. Notice that
venues of other types are included in the cluster
Community Factors
Given the previous work which suggests that geo-spatial (and
cated in “The Castro”, a neighborhood well-known for its
thus social [4]) factors influence user mobility, it is also not
gay population. This can be seen in Figure 2, where each
surprising to see several clusters which are tightly clustered
marker represents one of the top twenty venues associated
in space. However, as our model ignores the geo-spatial co-
with the given cluster. What is particularly interesting is that
ordinates of venues, it is interesting to note that such clus-
the observed hidden factor associated with these clusters cor-
ters are purely the result of a group of users which are all
relates well with a segment of the population which is heav-
driven by some hidden factor driving them to check in within
ily discriminated against, fitting traditional notions which
a small geographical area. It is important to note, how-
suggest that people who are discriminated against tend to co-
ever, that this factor could be representative of issues of self-
alesce into tight communities [2]. Indeed, while many other
representation, or to some genuine factor influencing users
types of venues carrying explicit demographic information
to stay within that area. We thus define these clusters as
about their users, such as churches, exist in foursquare’s cat-
“communities”, in that users either feel strongly that they are
egories, this was the only one to repeatedly appear as a topic
associated with this specific area, or are indeed frequenters
across both cities and various model configurations. The
of the area.
ability of foursquare data to reveal such segregations even
when geo-spatial properties of venues are ignored is a rather
In the results from both the New York and San Francisco
interesting finding which we hope to explore in later work.
Bay Area data, a “community” cluster exists where the rep-
resentative venues are nearly all of the category “Gay Bar”.
A list of places which describe these clusters in the two data User Type Factors
sets are shown in Table 2 and Table 3, and the closeness of The final kind of cluster we uncover in our results groups
these places in space can be seen for the New York data in users by hidden factors we refer to as a “type”. We define
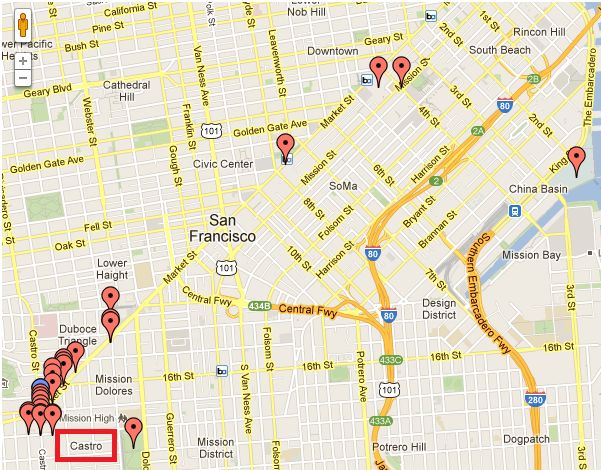
Figure 1. Thee San Francisco gay bar cluster is similarly type clusters as those which group users into a recognizable
close in space- in fact nearly all venues in the cluster are lo- form which is clearly distinguishable quantitatively but rep-Category Venue Name
Subway Station Civic Center BART Station
Subway Station Balboa Park BART Station
University The Quad
University Jordan Hall
University Gates CS Building
University Hoover Tower
Nightclub The Ambassador
Movie Theater AMC Bay Street 16 and IMAX
Bridge San Francisco-Oakland Bay Bridge
Light Rail BART - Transbay Tube
Stanford Stanford Golf Course
Stanford Stanford University
Plaza The Claw
Sculpture Garden Rodin Sculpture Garden
Movie Theater Regal Emery Bay 10
Movie Theater AMC Loews Metreon 16
Table 5. A cluster from the San Francisco Bay Area which seems to
Figure 2. The geo-spatial distribution of the community cluster found consist of Stanford students
in the San Francisco data. Each marker denotes a location, and the
name of the traditionally gay area in San Francisco, the Castro, is
boxed in red for the reader. to check in a different locations, and thus gives evidence of
topic models as being a useful approach for location based
Category Venue Name
data. In particular, as many users utilize foursquare to present
Electronics Store Apple Store themselves as being a specific type of person [11], topic
Train Station New York Penn Station models which expose different characteristic types of peo-
Train Station Grand Central Terminal ple, in addition to user interests, may be much more apt to
Park Central Park
Airport Terminal Terminal 5
make recommendations based not on superficial factors but
Art Museum Museum of Modern Art (MOMA) on more internalized ones such as geo-spatial homophily.
Park Bryant Park While such clusters are interesting in defining non-obvious,
Art Museum Metropolitan Museum of Art latent factors affecting where users check in, a drawback to
Department Store Macy type clusters is that they do not have as distinctive features,
Bridge Brooklyn Bridge
Plaza Rockefeller Center such as common venue categories or tight geo-spatial loca-
Science Museum American Museum of Nat. History tions, as the other kinds of clusters we observe. Thus, these
Historic Site National September 11 Memorial clusters clearly require increased knowledge of the city at
Toy or Game Store FAO Schwarz hand to justify their existence, and as such should be ap-
Monument Statue of Liberty
Hotel Hilton New York
proached with caution until more quantified means of ana-
Art Museum Guggenheim Museum lyzing their existence are examined.
Table 4. A cluster consisting mainly of tourist attractions in New York
FUTURE WORK AND LIMITATIONS
resents users across a varied geo-spatial setting and across There are several application areas which could be pursued
a variety of possible interests. As such, these type clusters with the output from our model. One obvious use of the
could be considered a kind of “catch-all”, however in noting clusters discovered would be to design a recommendation
that we only suggest that a few clusters qualify, we do not system, as is done in [27] with the user similarity metric
consider it as such. A type cluster for New York can be seen developed first in [10]. As noted, our model can recom-
in Table 4, where the users grouped into this cluster appear mend related places which are not necessarily of same cat-
to be of the type “tourist”. We make this claim based on egory, leading to robust and interesting recommendations
the fact that most of the places representing this cluster are based on representative latent factors which have driven pre-
sites which tourists would visit, and includes several travel vious check ins of users. For example, Figure 3 shows a
venues, in particular the airport. Similarly in the San Fran- cluster of users that seem to frequent fitness centers. We
cisco Bay Area data, we identify a type cluster correspond- observe that these “fitness enthusiasts” also frequent Nike-
ing to Stanford students, as shown in Table 5. Here, the top Town, an athletic clothing store which would make for a
venues are either establishments within Stanford University very reasonable recommendation. One advantages to our ap-
or common places that college students might visit in San proach in location recommendation over previous user sim-
Francisco (e.g. movie theaters and bars), along with a few ilarity approaches in [27, 15] is that we cluster specifically
public transport stations. on Points of Interest (POI), as opposed to geographic coor-
dinates, thus allowing us to recommend areas without the
Type clusters are interesting in that they show the ability of need to have an additional filtering step. In addition, users
a latent model to capture relationships between users which are already grouped according to factors which drive their
cannot be easily expressed in a parameterized model. As interests or needs, thus allowing us to avoid costly user sim-
such, our model can be seen here to transcend simple cate- ilarity calculations in situations which are time critical, such
gorical, geo-spatial and social factors which influence users as on-the-fly recommendations.predictable - because the model is probabilistic, results can
change slightly with each run. Furthermore, results are not
predictable across cities, for example, we did not find a tourist
cluster in San Francisco Bay Area. Third, the model is sensi-
tive to the amount of data it is given. In noting that San Fran-
cisco Bay Area had much less data compared to New York,
we also find that the clusters are not as well defined. This
was also true for cities for which we had even less data, such
as Pittsburgh and Chicago. One possible solution would be
to incorporate other, similar data types, such as Yelp data.
Figure 3. A cluster found by LDA using New York data that consists Fourth, in the text modeling domain, “stop words” are often
mainly of gyms (in blue), yet also including a sporting apparel store removed, words such as “a” and “the” which are highly fre-
(red).
quent. It might behoove a model of places to do the same.
Venue Names
However, while it might make sense to remove uninteresting
places such as airports and bus stations, it is unclear if pop-
Century Cinema 16 Computer History Museum ular places representative of interests, like stadiums, should
AT&T Park Stanford Stadium really be removed. While we considered this avenue, we did
Stanford University In-N-Out Burger not obtain rigorous findings in this direction. Finally, a hier-
Cafe Borrone Mission Bay Conference Center
Hacker Dojo Apple Inc. archical approach, as implemented in [10], would allow us
Googleplex Microsoft SVC to extend beyond the current categorizations.
LinkedIn Googleplex - 43
Google San Francisco Googleplex - Charlie’s Cafe
Facebook Plug And Play Tech Center CONCLUSIONS
The Company Store Stanford Shopping Center The model we present is simplistic in the features of the data
San Francisco Caltrain Mountain View Caltrain it incorporates. We group users into clusters based only on
the places they go and thus do not incorporate explicit rep-
Table 6. A cluster in the San Francisco Bay Area data made up of check resentations of geo-spatial, categorical or social aspects of
ins from what one would expect to be a tech event(s).
our data. Because of this simplistic methodology, significant
limitations, suggested above, exist in the practical usage of
Another possible use of our model, if applied in an online the model we present. Indeed, we do not discuss how such a
form [1], would be to better understand the dynamics of model would compare to those which incorporate more rich
check ins due to groups of users being in cities for various features, and discuss how in some ways, previous user simi-
events. An example of a group formed by a possible event larity metrics are more desirable than the one presented here.
is observed in the data from San Francisco in Table 6. The Future work, particularly those keen on understanding the
cluster discovered is represented by a collection of places in applicability of our approach to recommendation technolo-
the San Francisco Bay Area which relate strongly to famous gies, should indeed incorporate a user study which allows
technology sites across the city, transportation and confer- for the comparison of a topic model approach, using various
ence centers. While we could not confirm it, we believe feature sets, to different mechanisms for recommendation.
that this cluster is representative of a technology event which
brought technology fans into the city, who in turn toured im- However, the simplicity of our model allows us to generate a
portant sites in the field around the Bay Area. more data-driven understanding than has been previously ex-
plored of the latent factors which may be driving user check
The existence of a possibly fleeting group of users points in behavior in data from location based social networks. Our
to one clear limitation of our model - by ignoring tempo- findings confirm that geo-spatial and social homophily are
ral information in the data, we assume that groupings of powerful factors in grouping user into different types, in-
users (and thus the factors affecting their check in behaviors) terests and communities, thus supporting a large amount of
are heavily static, which is likely not the case. Topic mod- work which suggests the same (e.g. [7, 4, 9, 13]). However,
els which consider temporal information, such as periodicity in addition to supporting previous work, we extend their ef-
[25], may be able to garner interesting clusters over time. We forts in two ways. First, we find that by typifying different
also ignore temporal information with respect to sequences users with a categorical, qualitative type such as “tourist”,
of user actions, a significant shortcoming of our model as one can understand check in behavior beyond patterns in
compared to the user similarity model proposed in [10, 27]. social, geo-spatial and venue categories. Second, for those
At least five other limitations exist. First, the results of the groups which are in fact bonded by social and geo-spatial
model are not always interpretable - it is difficult, particu- factors, our model allows for interpretation of the groupings
larly if one is not familiar with the city in which the check beyond these variables to specific traits, such as homosexu-
ins occurred, to understand certain clusters. Foursquare cat- ality, which define a part of the community itself.
egories help, but can only explain so much about the intrica-
cies of user behavior. ACKNOWLEDGEMENTS
We would like to thank Justin Cranshaw for the data and
A second problem of our model is that, in addition to be- for his assistance in developing the concepts presented. We
ing difficult to interpret, the resulting clusters are also not would also like to thank Robert Kraut, Jason Hong and ouranonymous reviewers for their invaluable suggestions. 14. S. Milgram. A Psychological Map of New York City.
American Scientist, 60:194–200, Mar. 1972.
REFERENCES
15. J. Moore. Building a recommendation engine,
1. L. Al Sumait, D. Barbara, and C. Domeniconi. On-line
foursquare style, Mar. 2011.
LDA: adaptive topic models for mining text streams
with applications to topic detection and tracking. In 16. A. Noulas, S. Scellato, R. Lambiotte, M. Pontil, and
Proceedings of the 2008 Eighth IEEE International C. Mascolo. A tale of many cities: universal patterns in
Conference on Data Mining, Proc. ICDM’08, pages human urban mobility. ArXiv e-prints, Aug. 2011.
3–12. IEEE Computer Society.
17. A. Noulas, S. Scellato, C. Mascolo, and M. Pontil. An
2. P. Blau. Inequality and heterogeneity: A primitive empirical study of geographic user activity patterns in
theory of social structure. New York: Free Press, 1977. foursquare. In Proc. ICWSM ’11, pages 570–573.
3. D. M. Blei, A. Y. Ng, and M. I. Jordan. Latent dirichlet AAAI, 2011.
allocation. J. Mach. Learn. Res., 3:993–1022, Mar. 18. R. Park and E. Burgess. Introduction to the Science of
2003. Sociology. University of Chicago, 1921.
4. C. Butts. Space and Structure: Methods and Models for 19. M. T. Rivera, S. B. Soderstrom, and B. Uzzi. Dynamics
Large-Scale Interpersonal Networks. Springer, 2012, of dyads in social networks: Assortative, relational, and
expected. proximity mechanisms. Annual Review of Sociology,
5. Z. Cheng, J. Caverlee, K. Lee, and D. Z. Sui. Exploring 36(1):91–115, 2010.
millions of footprints in location sharing services. In 20. A. Sadilek, H. Kautz, and J. P. Bigham. Finding your
Proc. ICWSM ’11, pages 81–88. AAAI, 2011. friends and following them to where you are. In Proc.
6. E. Cho, S. A. Myers, and J. Leskovec. Friendship and WSDM ’12, pages 723–732. ACM, 2012.
mobility: user movement in location-based social 21. R. J. Sampson, S. W. Raudenbush, and F. Earls.
networks. In Proc. SIGKDD ’11, pages 1082–1090. Neighborhoods and violent crime: A multilevel study
ACM, 2011. of collective efficacy. Science, 277(5328):918–924,
7. J. Cranshaw, R. Schwartz, J. I. Hong, and N. Sadeh. 1997.
The livehoods project: Utilizing social media to 22. C. Sato, S. Takeuchi, and N. Okude. Experience-based
understand the dynamics of a city. In Proc. ICWSM ’12. curiosity model: Curiosity extracting model regarding
AAAI, 2012. individual experiences of urban spaces. In A. Marcus,
8. J. Cranshaw and T. Yano. Seeing a home away from the editor, Design, User Experience, and Usability. Theory,
home: Distilling proto-neighborhoods from incidental Methods, Tools and Practice, volume 6770 of Lecture
data with latent topic modeling. In CSSWC Workshop Notes in Computer Science, pages 635–644. Springer
at NIPS 2010, NIPS ’10. AAAI, 2010. Berlin / Heidelberg, 2011.
9. J. R. Hipp, R. W. Faris, and A. Boessen. Measuring 23. S. Scellato, A. Noulas, and C. Mascolo. Exploiting
neighborhood: Constructing network neighborhoods. place features in link prediction on location-based
Social Networks, 34(1):128 – 140, 2012. Capturing social networks. In Proc. SIGKDD ’11, pages
Context: Integrating Spatial and Social Network 1046–1054. ACM, 2011.
Analyses. 24. S. Wakamiya, R. Lee, and K. Sumiya. Crowd-based
10. Q. Li, Y. Zheng, X. Xie, Y. Chen, W. Liu, and W. Ma. urban characterization: extracting crowd behavioral
Mining user similarity based on location history. In patterns in urban areas from twitter. In Proc.
Proc. SIGSPATIAL ’08, GIS ’08, pages 34:1–34:10. SIGSPATIAL International Workshop on
ACM, 2008. Location-Based Social Networks, pages 77–84. ACM,
2011.
11. J. Lindqvist, J. Cranshaw, J. Wiese, J. Hong, and
J. Zimmerman. I’m the mayor of my house: examining 25. Z. Yin, L. Cao, J. Han, C. Zhai, and T. Huang. Lpta: A
why people use foursquare - a social-driven location probabilistic model for latent periodic topic analysis. In
sharing application. In Proc. CHI ’11, pages Proc. ICDM ’11, pages 904 –913, dec. 2011.
2409–2418. ACM, 2011.
26. Y. Zheng. Location-Based social networks: Users. In
12. M. Loecher, D. Rosenberg, and T. Jebara. Citysensetm: Y. Zheng and X. Zhou, editors, Computing with Spatial
Multiscale space time clustering of gps points and Trajectories, pages 243–276. Springer New York, 2011.
trajectories. In Joint Statistical Modeling, JSM ’09,
27. Y. Zheng, L. Zhang, Z. Ma, X. Xie, and W. Ma.
2009.
Recommending friends and locations based on
13. M. McPherson, L. Lovin, and J. Cook. Birds of a individual location history. ACM Trans. Web,
feather: Homophily in social networks. Annual Review 5(1):5:1–5:44, Feb. 2011.
of Sociology, (1):415–444, 2001.You can also read