Down the bot hole: actionable insights from a 1-year analysis of bots activity on Twitter - arXiv
←
→
Page content transcription
If your browser does not render page correctly, please read the page content below
Down the bot hole: actionable insights from a
                                           1-year analysis of bots activity on Twitter
                                                  Luca Luceri, Felipe Cardoso, and Silvia Giordano
                                             University of Applied Sciences and Arts of Southern Switzerland (SUPSI)
                                                  luca.luceri@supsi.ch, felipe.cardoso@supsi.ch, silvia.giordano@supsi.ch

                                                                               Abstract
arXiv:2010.15820v1 [cs.SI] 29 Oct 2020

                                                   Nowadays, social media represent persuasive tools that have been
                                               progressively weaponized to affect people’s beliefs, spread manipula-
                                               tive narratives, and sow conflicts along divergent factions. Software-
                                               controlled accounts (i.e., bots) are one of the main actors associated with
                                               manipulation campaigns, especially in the political context. Uncovering
                                               the strategies behind bots’ activities is of paramount importance to de-
                                               tect and curb such campaigns. In this paper, we present a long term
                                               (one year) analysis of bots activity on Twitter in the run-up to the 2018
                                               U.S. Midterm Elections. We identify different classes of accounts based
                                               on their nature (bot vs. human) and engagement within the online dis-
                                               cussion and we observe that hyperactive bots played a pivotal role in the
                                               dissemination of conspiratorial narratives, while dominating the political
                                               debate since the year before the election. Our analysis, on the horizon
                                               of the upcoming U.S. 2020 Presidential Election, reveals both alarming
                                               findings of humans’ susceptibility to bots and actionable insights that
                                               can contribute to curbing coordinated campaigns.

                                         Introduction
                                         False narratives, fake accounts, low-credibility news sources, state-sponsored
                                         operators, and so on and so forth: The online ecosystem landscape appears
                                         loaded with threats and malicious entities disposed to undermine the integrity
                                         of social media discussions. Among those, bots (i.e., automated and software-
                                         controlled accounts) [23, 12] and trolls (i.e., human operators often state-
                                         sponsored) [61, 35, 3] have been recognized as the main responsible actors of
                                         manipulation and misinformation operations in diverse contexts [18], ranging
                                         from finance [38, 14, 51] to public health [21, 58], in which the rise of infodemics
                                         (i.e., the widespread diffusion of unverified information and conspiracy theories)
                                         during the Covid-19 outbreak represents the latest milestone of the misinforma-
                                         tion age [63]. Moreover, the abusive behavior of these malicious actors received
                                         enormous resonance in the political domain [33, 5, 37, 29, 2, 4, 25, 62, 34], where

                                                                                    1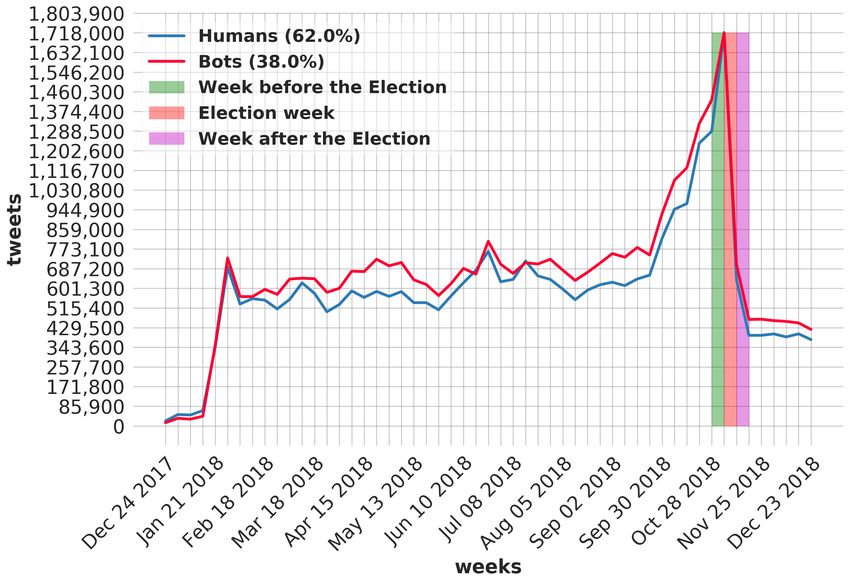
the abuse of social platforms has put under threat the effective fulfillment of the
democratic process, other than creating worldwide concerns for the integrity
of voting events [47, 7, 49, 3, 40, 19, 28, 46, 54, 48, 6, 27, 43, 41].
    In such a context, recent findings showed that most of the political messages
shared on Twitter are published by a small set of hyperactive accounts [57, 30].
Yang et al. [57] observed that hyperactive users are more likely to publish low-
credibility narratives with respect to ordinary users and they tend to exhibit
suspicious behaviors, often linked to automated and fake accounts. In this
regard, Ferrara et al. [22] recognized how a set of conspiracy bots pushed a
relevant portion of low-credibility information within the 2020 U.S. Presidential
election debate on Twitter. From this perspective, it follows that, by flooding
social platforms with content of questionable accuracy, hyperactive accounts
can both manipulate organic users, by affecting and influencing their opinions,
but also the platform mechanisms and its engagement metrics, e.g., trending
topics and feed ranking algorithms [57]. Such vulnerabilities, along with the
relentless presence of inauthentic entities, highlight the need for intervention
to prevent the distortion of online discussions and the manipulation of public
opinion.
    Therefore, developing computational tools to detect deceptive and orches-
trated campaigns is the main goal of the agenda initiated by the research
community to purge online platforms. However, this represents a challenging
task [24, 11, 53]. Nevertheless, in the last few years, researchers offered several
approaches to identify bots [52, 59, 15, 36, 42, 13, 9, 50, 11], while solutions
for unveiling the activity of trolls have been recently proposed [35, 1]. Other
studies focused on the detection of collective and inauthentic behaviors of ma-
licious accounts to uncover coordinated campaigns [45, 38, 39] and suspicious
content diffusion [31, 26, 60]. However, social media abuse persists and the
online ecosystem still presents a mix of organic and malicious users [34, 32],
where the former class still demonstrates a moderate capability to identify the
latter [56]. This also calls for a clear understanding of users’ susceptibility to
the content shared by malicious accounts and the interplay with them.

Research Questions and Contributions In light of these considerations,
more research is needed to uncover the strategies behind the activity of mali-
cious actors on social media for curbing the abuse of online platforms, as well
as to investigate the downstream effects of users’ exposure to and interaction
with malicious accounts for appraising the impact of their deceptive activity.
    Along these research directions, in this paper, we inspect the activity of
bot and human accounts on Twitter during the year approaching the 2018
U.S. Midterm elections, which were held on November 6, 2018. To the best
of our knowledge, this work represents the first attempt to study users, and
in particular bots, temporal activity over an extended period of time (one
year). The aim is to explore the strategies developed to both inject automated
accounts into the Midterm debate and program their sharing activities while

                                        2
avoiding detection. We focus on the sharing activities that Twitter users can
 employ to create content (i.e., original tweets), re-share others’ tweets (i.e.,
 retweets), and respond to others’ tweets (i.e., reply). We investigate how and
 to what extent bots used such digital weapons [8] over time to identify cues that
 can empower the identification of bot accounts and, accordingly, contribute to
 the detection of orchestrated campaigns.
     More specifically, this paper aims at answering the following Research Ques-
 tions (RQs):

    • RQ1: How did bots perform their sharing activities over time?
      We explore the temporal dynamics of bots operations by examining the
      volume of published content during the year and, in particular, as the
      election approached.

    • RQ2: When did bots enter into the Midterm debate over the
      year? The rationale is to understand how bots were strategically injected
      into the online conversation to perform their deceptive activity while
      avoiding detection.

    • RQ3: Did hyperactive accounts play a pivotal role in the broad-
      casting of political messages? We aim to investigate the nature of
      hyperactive accounts, monitor their appearance in the Midterm discus-
      sion, and shed light on their activity.

    • RQ4: How did bot accounts engage and interact with human
      users? We explore the interactions, in terms of retweets and replies,
      between humans and bots, and we measure the centrality within the
      online discussion of both classes of accounts.

    To respond to these RQs, in this work, we attain the following findings:

RQ1: We found that bots followed similar temporal patterns of humans in
     every sharing activity over the whole observation period, which suggests
     that bots strategically attempted to mimic human operations since the
     beginning of the Midterm debate. We observed that bots flooded Twitter
     with a disproportionate number of retweets, but an increasing number of
     bots aimed at creating original content entered into the conversation as
     the election approached.

RQ2: We discovered that a relevant fraction of bots started pushing content re-
     lated to the Midterm election even one year prior to the election. A con-
     stant number of new bot accounts progressively entered into the Midterm
     debate every week of the year, indicating a cautious strategy to infiltrate
     bots within the online discussion to avoid their detection. We recognized
     that another significant fraction of bots appeared the month before the
     election to operate and supposedly interfere into the debate.

                                        3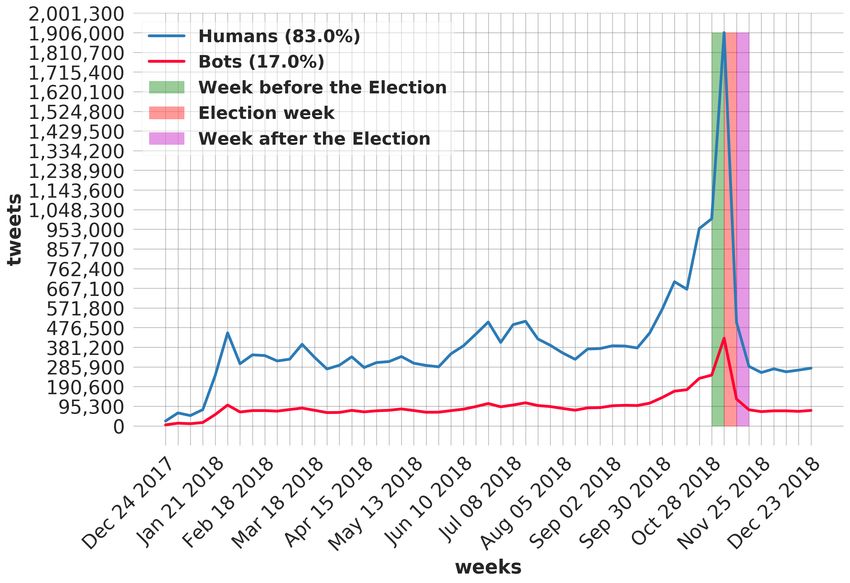
RQ3: We identified 83k hyperactive accounts (9 percent of the users in our
     dataset), which were responsible for the creation of more than 70M po-
     litical messages (72 percent of the collected tweets). We recognized their
     pivotal role in the broadcasting of conspiratorial narratives and we ob-
     served that they exhibited a higher degree of automated behavior if com-
     pared to ordinary users. Interestingly, we noticed that a small group of
     hyperactive bots (19k accounts) were involved in the Midterm discussion
     since one year before the election, generating a gargantuan volume of po-
     litical messages (almost 30.6M tweets), and we found that most of these
     accounts have also been operating in the upcoming 2020 U.S. Presidential
     election debate.

RQ4: We measured to what extent humans relied on and interacted with the
     content shared by bot accounts. We recognized that human users signifi-
     cantly connected to bots by re-sharing their content, while less interplay
     is noted in terms of replies. Alarmingly, we observed that one-third of
     humans’ retweets is a re-share of the content originated by bot accounts.
     We examined users’ embeddedness within the social network and found
     that bots, and in particular the hyperactive and less recent ones, populate
     the most central and influential area of the social network.

 Data and Methodology
 In this Section, we present the Twitter data collected to perform our analy-
 sis and the methodologies followed to gather the set of data and detect bot
 accounts. Then, we detail the proposed approach to distinguish classes of ac-
 counts based on their engagement in the Midterm debate. Finally, we describe
 the technique used to measure the centrality of the accounts within the Twitter
 conversation.

 Data collection and bot detection To perform our analysis, we leverage
 the dataset gathered by the researchers of the George Washington Univer-
 sity [55]. The authors collected Twitter messages (i.e., tweets) for one year
 (from December 2017 to December 2018) by using Midterm elections-related
 keywords and hashtags. Based on Twitter’s developer policy, the authors [55]
 were allowed to publicly share only the tweet IDs of the collected tweets. Given
 the released tweet IDs, a process referred to as hydration was necessary to re-
 cover the complete tweet information. The hydration process uses the Twitter
 API to obtain the entire tweet object from the corresponding tweet ID. Only
 74% of the released 171,248,476 tweet IDs were still available online at the time
 we performed the hydration process (December 2019) and, as a consequence,
 we were able to gather only this subset of tweets.
     We then considered narrowing the analysis to the tweets published by a set
 of accounts studied in our previous works [34, 17] to enable comparison and

                                        4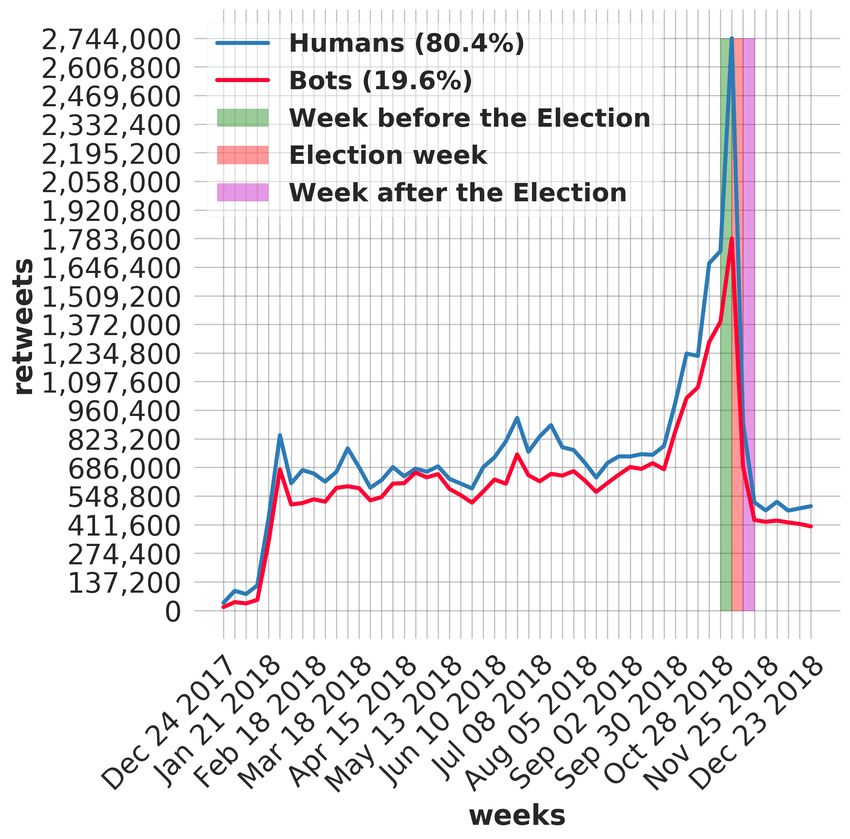
validate previous findings. Moreover, from the set of 997k users analyzed in
[34, 17], we found 943k accounts in the collected dataset that were responsible
for the creation of the majority of the collected tweets. Specifically, more than
98M tweets (over the 126M collected) were shared by the set of 943k accounts.
It should also be noted that a consistent subset of such users (62 percent),
which is responsible for almost 80 percent of the collected tweets, is also active
at the time of this writing (mid-October 2020) in the debate related to the U.S.
2020 Presidential election [10]. The interested reader can find further details
in the Supplement.
    Given that the set of 943k accounts was analyzed in previous efforts, we
rely on the account classification (bot vs. human) that we performed and
validated in [34, 17]. The accounts classification was performed by means of
Botometer1 , a machine learning-based tool developed by Indiana University
[16, 52]. Botometer outputs a bot score: the lower the score, the higher the
probability that the user is human. Besides using the bot score to classify
the accounts, we further analyzed the status of such accounts, i.e., active,
suspended, or deleted (not found) by leveraging the Twitter API. In Table 1,
we show the statistics of the final dataset under analysis.
                      Table 1: Accounts and tweets statistics
                   All          Bots             Humans       Suspended   Not found
 Accounts          943,126      184,545          758,581      38,164      30,688
 Accounts %                     19.57%           80.43%       4.05%       3.25%
 Tweets            98,123,612   42,386,269       55,737,343   9,645,522   2,828,963
 Tweets %                       43.2%            56.8%        9.83%       2.88%

    Specifically, Table 1 details the number of accounts and shared tweets for
each class of users. The percentage of bots (around 20 percent) and human
accounts (around 80 percent) is in line with previous works [34, 17]. The
majority of users are still active (around 93 percent) at the time of this writing
(mid-October 2020), while a small fraction deleted their account (around 3
percent) or have been suspended by Twitter (around 4 percent). It is out of
the scope of this paper to characterize the suspended accounts. However, an
evaluation about the correlation between account suspension and the likelihood
of automation is provided to the interested reader in the Supplement.

Engagement-based accounts classification To better understand how
both human and bot accounts acted over time, we analyze their behavior ac-
cording to their engagement within the Midterm debate. In particular, we
consider the frequency and duration of their activity during the observation
period by identifying, for each account, the following parameters:
      • first tweet: the first time the account shared a tweet within our dataset;
      • last tweet: the last time the account shared a tweet within our dataset;
  1
      https://botometer.iuni.iu.edu/

                                             5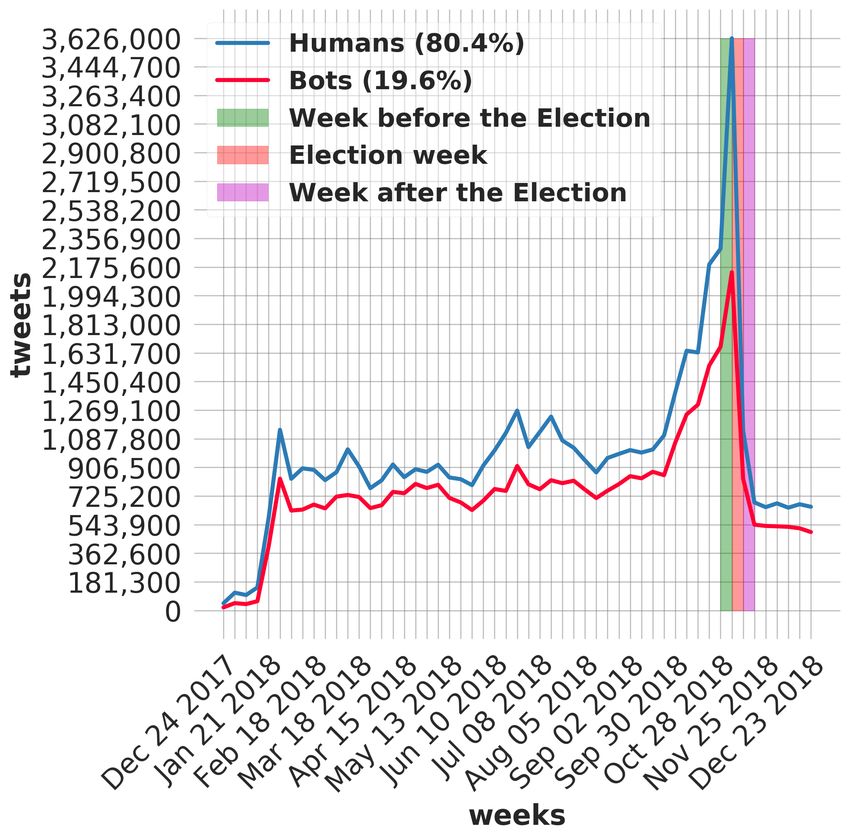
• tweets count: the number of tweets shared by the account within our
     dataset;
   • active days: the number of days between the last and first tweet;
   • daily tweet frequency: the average number of tweets shared by the account
     during the active days time window, computed as:
                                                   tweets count
                        daily tweets frequency =
                                                    active days

    Based on the active days and daily tweets frequency parameters, we propose
to classify the accounts into two categories: hyperactive and ordinary accounts.
To distinguish these two classes of accounts, we need to identify a threshold for
each considered parameter that allows to opportunely separate the hyperactive
users from the ordinary ones. More specifically, we observe how ordinary (resp.
hyperactive) accounts are filtered out (resp. selected) from the whole set of
accounts by varying these thresholds. In Figure 1, we show how the percentage
of retained accounts decreases as the filtering parameters (i.e., active days and
tweets frequency) increase.

Figure 1: Percentage of accounts that persist to the filtering based on the active
days and tweet frequency parameters
    In particular, in the left panel of Figure 1, we show the percentage of ac-
counts that persist to such a filtering as a function of the filtering parameters.
In the right panel of Figure 1, we only focus on the two-dimensional relation
between the percentage of accounts and the tweet frequency parameter. Every
dot in the figures indicates a combination of the filtering parameters, while its
color represents the percentage of accounts that persist to the filtering. Two
facts are worth noting. First, the active days parameter does not significantly
affect the percentage of filtered accounts, except for the first gap (from 100
percent to 80 percent of the accounts), where the accounts active only one day
are filtered out. It can be noticed that, at a fixed tweet frequency, the percent-
age of filtered accounts does not vary by increasing the active days parameter
(dots appear to be aligned). Second, the tweet frequency parameter highly

                                        6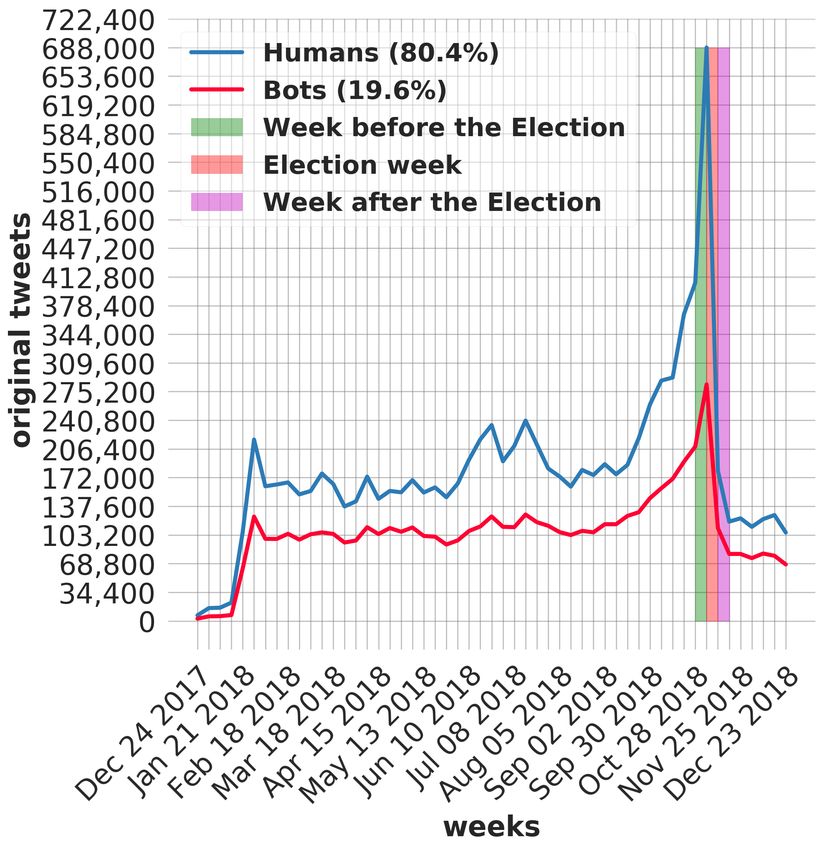
affects the percentage of filtered accounts: as this parameter increases, the
percentage of accounts decreases. The most noticeable gap can be appreciated
when the tweet frequency parameter value equals 0.2 tweets/day, which results
in a filtering of almost 70 percent of the accounts.
    In Figure 2, the same evaluation is performed by considering the percent-
age of tweets that persist to the accounts filtering (based on the same set of
parameters) and similar considerations can be done.

Figure 2: Percentage of tweets that persist to the accounts filtering based on
the active days and tweet frequency parameters
     Indeed, also in Figure 2, the parameter that impacts most of the percentage
of filtered tweets is the tweet frequency. However, in Figure 2, the percentage
of tweets decreases more gradually by increasing the tweet frequency parameter
if compared to the percentage of accounts reduction (Figure 1). Interestingly,
with a tweet frequency of 0.2 tweets/day, more than 70 percent of accounts were
filtered out but more than 90 percent of tweets were retained, suggesting that a
small percentage of accounts is responsible for a huge amount of tweets, which
is consistent with previous findings [30]. Given the above observations, we
classify as hyperactive the accounts that satisfy both the following conditions:
   • active days ≥ 1
   • daily tweets frequency ≥ 1
    We consider these parameters as (i) for the active days parameter the most
noticeable variation in the percentage of filtered accounts can be appreciated
when this parameter is greater than 0, and (ii) a tweet frequency of 1 corre-
sponds to the knee of the curve in the account distribution (Figure 1), which
can be viewed as a conservative choice to discriminate the two classes of ac-
counts (hyperactive vs. ordinary), as no significant difference would occur in
the classification by further increasing this threshold, i.e., the percentage of
accounts does not significantly vary by increasing the tweet frequency param-
eter.
    According to these filtering parameters, hyperactive accounts represent less
than 9 percent of the accounts in our dataset and cover about 70 percent of

                                       7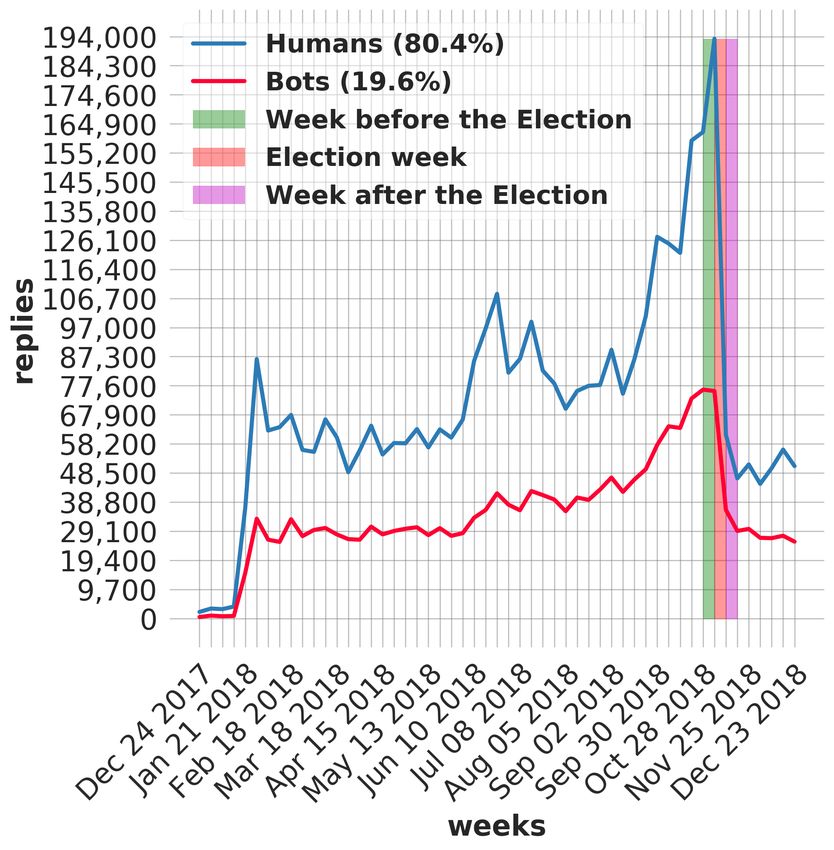
the collected tweets. It is worth noting that bots cover about 38 percent of
the hyperactive accounts, which represents a noticeable increase of automated
accounts with respect to the percentage related to the full set of accounts (80
percent humans vs. 20 percent bots), other than indicating a robust presence of
bots within the online conversation. This is in line with previous findings [57]
and is further confirmed in Figure 3, which depicts the bot score distribution
for hyperactive and ordinary accounts. It can be noticed that the two classes
of accounts exhibit significantly different distributions, as also demonstrated
by a Mann-Whitney rank test (p-value < 0.001). On the one hand, most of
the probability mass in the distribution related to ordinary accounts is in the
range [0,0.14], suggesting that the majority of ordinary accounts are humans.
On the other hand, in the distribution related to hyperactive accounts, we can
notice how these users are more likely to have higher bot scores with respect to
ordinary accounts, indicating a more relevant presence of automated (software-
controlled) users within the set of hyperactive accounts.

Figure 3: Bot score distributions comparison between hyperactive and ordinary
accounts

k-core decomposition To evaluate the centrality (or embeddedness) of the
accounts within the Twitter conversation, we employ the k-core decomposition
technique. The k-core decomposition aims to determine the set of nodes deeply
embedded in a graph by recursively pruning nodes with degrees less than k.
Formally, the k-core is a subgraph of the original graph in which every node has
a degree equal to or greater than a given value k. The k-core decomposition
assigns a core number to each node, which is the largest value k of a k-core
containing that node. The higher the core number k is, the more embedded
the node is in the network.

Results and Analysis
In this Section, we present our analysis and corresponding results on the tem-
poral and behavioral dynamics of bot and human activity over the whole year

                                       8
preceding the 2018 U.S. Midterm elections. We focus on investigating bots
sharing activities over time with the objective of understanding how such ac-
counts have been strategically injected in the online discussion related to the
Midterm as the election approached. Then, we consider the distinction be-
tween hyperactive and ordinary accounts to identify peculiar and distinctive
behaviors between these two classes of accounts by also considering their na-
ture (bot vs. human). Finally, we observe the volume of interactions between
bots and humans, and their embeddedness within the social network.
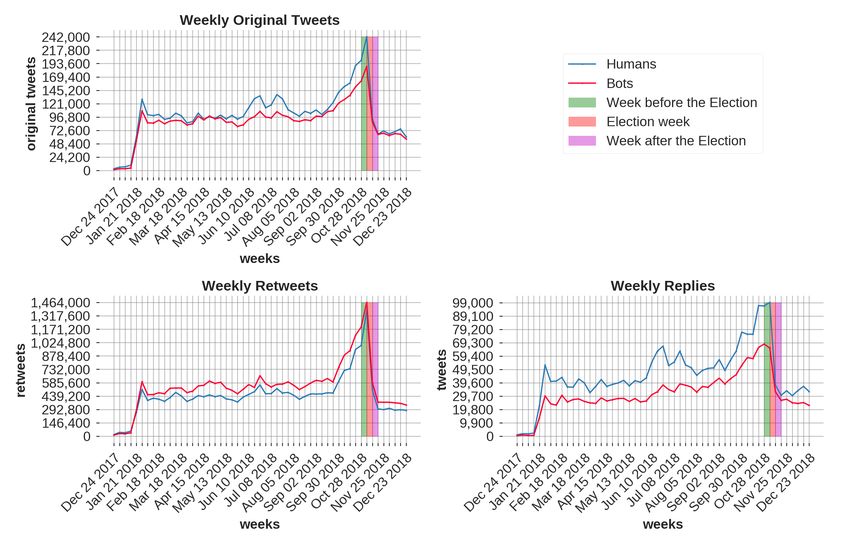
RQ1: Bots activity over the Midterm year In Figure 4a, we show the
number of tweets shared by human and bot accounts per each week of the
observation period. It could be noticed that the human population shared
more tweets than bots over the whole year. However, this could be expected
given that, as shown in Table 1, human accounts represent the largest portion
(80 percent) of the accounts of the collected dataset and shared more content
(about 57 percent of the tweets) with respect to the bot population (about
20 percent of the accounts and 43 percent of the tweets). As a consequence,
bots were more active (in terms of tweets generated per account) than humans
during the whole period. On average, a bot shared three times the number
of tweets published by a human user (218 vs. 70 tweets/account), which is
consistent with bots’ purpose of flooding online platforms with a high volume
of tweets [5]. Interestingly, bots followed a similar temporal pattern of human
users over the whole year, suggesting that bots strategically attempted to mimic
human sharing activity since the beginning of the online conversation related
to the Midterm elections. As expected, the content shared by both classes
of accounts increased as the election approached, and a spike of activity is
noticeable during the election week.
To better examine how bots performed their activity over time, we disen-
tangle the shared messages in original tweets, retweets, and replies. In Table 2,
we show the number of shared messages for each category of tweet and class
of accounts over the observation period.
Table 2: Sharing activities of bot and human accounts
Bots Humans
Accounts 184,545 758,581
Original tweets 5,677,142 (14%) 9,635,364 (18%)
Retweets 32,746,675 (81%) 39,427,132 (74%)
Replies 1,849,625 (5%) 3,876,595 (8%)
It can be noticed that retweeting is the most used operation for both hu-
mans (74 percent of the time) and bots (81 percent of the time). As expected,
bots heavily relied on the retweet action as it represents a simpler operation
for automated accounts with respect to the creation of an original tweet or
a reply, which requires the usage of more sophisticated techniques based on
9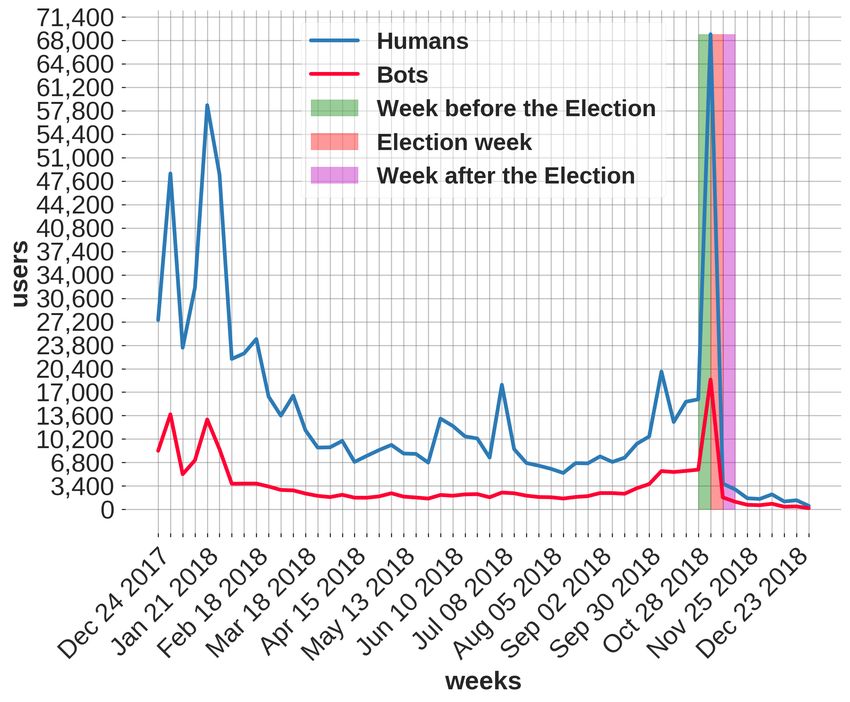
(a) Tweets                          (b) Original tweets

               (c) Replies                            (d) Retweets
      Figure 4: Sharing activities over time of bot and human accounts
natural language processing and understanding [20]. This is also in line with
previous findings [34], further confirming that retweets have been employed as
bots’ favorite digital weapon to resonate messages and create an illusion of con-
sensus within the online community [23]. Figures 4b-c-d portray the number of
original tweets, replies, and retweets shared weekly by humans and bots over
the year approaching the Midterm elections. Interestingly, also in the disen-
tangled sharing activities, bots followed a similar temporal pattern of human
users over the whole year. Indeed, the number of tweets shared by humans and
bots over time positively correlate (ρ > 0.97, p-value < 0.001) for each kind of
activity (i.e., original tweets, retweets, and replies). Although original tweets
and replies require to develop advanced AI techniques on software-controlled
accounts, the volume of such activities performed by bots approaches human
activities volume (see also Table 1), especially if we consider the number of

                                       10
messages published per each account. This suggests that also more sophisti-
cated bots operated along with less advanced spam bots [20]. Also, similarly
to Figure 4a, the content shared by both classes of accounts increased as the
election approached, and a spike of activity is noticeable during the election
week. Finally, it is worth noting how bots started emulating every kind of
human sharing activity since the beginning of the year, further confirming how
detecting coordinated campaigns is a challenging task, even when users are
monitored over an extended observation window.
RQ2: Bots injection within the Midterm debate To have a more com-
prehensive understanding of how both human and bot online activities evolve
over time, in Figure 5a, we depict the number of human and bot accounts en-
gaged in the debate every week of the observation period. In a given week, we
denote as engaged an account that shared at least one tweet during the week
under analysis.
(a) Engaged accounts (b) New accounts
Figure 5: Engaged and new accounts within the Midterm debate
It should be noticed that the number of engaged bots per week is almost
steady and slowly increases over time, while human users engagement is less
regular. This controlled engagement of bots might suggest a coordinated ef-
fort to simultaneously avoid the detection of such automated accounts, while
infiltrating them into the political discussion.
To shed light on this finding, we observe the number of new accounts that
joined the conversation related to the Midterm elections during the observation
window. We define an account as new when it participates for the first time
in the Midterm debate. In Figure 5b, we display the number of new accounts
for each week of the period under analysis. Once again, bot temporal pattern
shows a stationary trend, where an almost constant number of new accounts
entered into the conversation each week. As we mentioned before, this con-
trolled, and supposedly scheduled, activity appears a more cautious approach
for injecting bots within the online discussion to allegedly avoid their detection.
Moreover, we notice that a significant number of accounts (34 percent of the
11accounts within our dataset) joined the Midterm conversation since the end of
2017 and beginning of 2018 (first two weeks of February), as it can be observed
from the two peaks in the left side of Figure 5b. Interestingly, this subset of
accounts is responsible for 80 percent of the collected tweets, suggesting that
such users play a central role within the Twitter discussion. This holds true
both for human (28 percent of the accounts) and bot (6 percent of the accounts)
users. It is worth, and mostly alarming, noting that 60k of such accounts are
bots that have persisted online during the whole year generating around 34.2
million tweets (35 percent of the tweets) with an average rate of 570 tweets
per account. It should be considered that this subset of 60k bots represents a
relevant fraction (about 33 percent) of the bot accounts that participated in
the Midterm discussion and most of them (44k accounts) are actively involved
in the 2020 U.S. Presidential election debate at the time of this writing (mid-
October 2020). Also, we observe that the 260k human accounts that appeared
in the early stage of the year (28 percent of the accounts) shared 44.9 mil-
lion tweets (45 percent of the tweets) with an average rate of 173 tweets per
account, which is about 3.3 times lower than bots tweet fabrication rate.
A similar trend of appearance can be observed in the time around the
election day. Specifically, from the first week of October to the week after the
election, we observe a peak corresponding to a new set of accounts (11.6 percent
of the total users) that joined the conversation. Among such accounts, we
recognize 85k human users and 24.6k bots, which were responsible for creating
210k and 158k tweets during the aforementioned period, respectively. It could
be noticed that the ratio between the sharing rate of bots (6.4 tweets/account)
and humans (2.5 tweets/account) is lower than the one observed with the set
of accounts that joined the conversation since the beginning of the year (3.3
vs 2.5), which allegedly indicates a more cautious strategy adopted by bots for
sharing content in a relatively short time window (if compared to the whole
year).
To characterize the behavior of bot accounts that participated in the Midterm
debate, in Table 3, we compare the sharing activities of those that joined the
conversation since the beginning of the year (from now on referred to as old
bots) with those that appeared during the election period (from now on re-
ferred to as election bots). It can be noticed how both classes of bots used the
retweet as the main sharing activity. However, it can be observed a relevant
difference in the propensity of re-sharing and producing original tweets between
old and election bots. Indeed, election bots significantly created more original
content (t-test results: t(4,708,912)=118.2, p < 0.001), while re-sharing signifi-
cantly fewer posts with respect to old bots (t-test results: t(28,213,616)=121.1,
p < 0.001), which might suggest the deployment of different strategies between
the two classes of bot accounts based on their lifetime within the Midterm
debate.
Notice that all the other bots (i.e., the ones injected between the end of
February and the end of September) exhibited a hybrid behavior between the
two considered classes of accounts, with a distribution of shared activities in
12Table 3: Sharing activities of old and election bots
Old bots Election bots
Tweets 34,197,174 158,708
Original tweets 13% 25%
Retweets 83% 70%
Replies 4% 5%
between old and election bots. This further highlights that an increasing num-
ber of bots created with the purpose of sharing original content have been
strategically injected in the online conversation as the election approached.
To further investigate the nature of the analyzed bot accounts, we examine
their creation date (by inspecting tweets metadata). In Figure 6, we display the
date of the creation of bot and human accounts. We observe how the number
of created bots within our dataset increases as the election approaches. It
stands out how in 2009 (similarly to [57]), 2017, and right before the Midterm
elections, an elevated number of bots have been created. It is particularly
concerning to note how such bots persisted online over the years, allegedly
participating in diverse social and political discussions. From the superimposed
illustration of Figure 6, it can be appreciated how the bot accounts created
from July 2018 to November 2018 (Midterm election month) outnumber the
accounts created by humans in the same time window, which highlights that a
conspicuous number of bots might have been purposely created for infiltrating
into the discourse related to the Midterm elections. More specifically, about
10 percent of bot accounts were created from July to November 2018, whereas
80 percent of them were created before the beginning of 2018. The remaining
fraction (10 percent) was created in the first six months of 2018.
Figure 6: Account creation time Figure 7: Account age
Finally, we consider the account age, computed as the time difference be-
tween the date of the first tweet of the account in our dataset and its creation
date. Figure 7 shows the distribution of the account age, measured in days, for
both humans and bots. It can be appreciated how the account age for bots (av-
erage account age = 1963.8 days) is significantly lower (presult indicates that bots shared Midterm-related content closer to their cre-
ation date if compared to human accounts (similarly to [21]), which further
suggests that some bots might have been specifically designed to operate in
the Midterm debate.
RQ3: Hyperactive accounts behavior Based on the engagement-based
accounts classification described in Section Data and Methodology, we classify
users in hyperactive and ordinary accounts. For what pertains to ordinary
accounts, it should be noticed that, from this set of users, we filtered out
the accounts that shared only one tweet during the window of observation,
as we want to consider these users distinctly and analyze them in contrast
to the hyperactive ones. Overall, we observe that 74 percent of the accounts
are classified as ordinary accounts, 9 percent of the accounts are classified as
hyperactive accounts, and 17 percent of the accounts shared only one tweet
during the whole year (see the Supplement for further details). Ordinary ac-
counts were responsible for about 28 percent of the tweets and the proportion
between bots and humans within this set of users is consistent with the full
set of accounts. A similar accounts distribution can also be noticed for the
users that shared only one tweet, which in turn published a negligible volume
of messages.
Hyperactive users, while representing a tiny fraction of the accounts (about
83.7k), were responsible for about 72 percent of the collected tweets (about
70.7M messages). With 31.8k accounts, bots represent about 38 percent of the
hyperactive accounts and published more tweets (38 percent of the collected
tweets) than hyperactive humans (62 percent of the hyperactive accounts and
34 percent of the collected tweets) despite the latter set of users outnumbers
automated accounts, which further highlights bots prevalence in the online
discussion. Alarmingly, we notice that hyperactive accounts were involved in
the vast majority (90 percent) of the 1.6 million tweets related to the QAnon
conspiracy theory2 that we identified within our dataset (see the Supplement
for more details). This result supports the finding of Yang, et al. [57], related to
hyperactive users’ propensity of sharing low-credibility information. Moreover,
hyperactive bots dominated the broadcasting of such conspiratorial narratives
by pushing 62 percent of the content related to the QAnon theories, similarly to
the conspiracy bots identified in [22]. It is, therefore, a cause of concern noting
that the vast majority of hyperactive bots (22.5k accounts) are participating
in the 2020 U.S. election debate [10] at the time of this writing.
To investigate the behavior of hyperactive accounts, we examine their ac-
tivity pattern over the whole observation window. Figure 8a portrays their
weekly activity. While in Figure 4a we have noticed that humans generated
more tweets than bots in every week, in Figure 8a, we recognize a different
trend, where hyperactive bots produced more tweets than hyperactive humans
over the whole year. In Figure 8b, we display the number of tweets shared
2
https://www.bbc.com/news/53498434
14(a) Hyperactive accounts (b) Ordinary accounts
Figure 8: Tweets shared by hyperactive and ordinary accounts
weekly by ordinary accounts. Differently from Figure 8a, the gap between the
number of shared tweets by ordinary bots and ordinary humans is remarkable,
with the former class of accounts that shared about five times fewer tweets with
respect to the latter class. The interested reader can refer to the Supplement
for the detailed trends and volumes of the disentangled sharing activities (i.e.,
original tweets, retweets, and replies) for both hyperactive and ordinary users.
Next, we evaluate how the appearance and engagement of the accounts
within both classes evolve over time. In Figure 9a, we show the number of
engaged accounts within the hyperactive class for each week of the year. We
recall that an account is considered engaged in a certain week if it produced at
least one tweet in that week. Here, the most noticeable difference with respect
to Figure 5a (where all the accounts are considered) is related to the activity
of hyperactive humans. In fact, as shown in Figure 9a, human activity has a
progressive growth over time and a similar pattern to bots activity. This might
suggest that the irregular spikes of activity in Figure 5a are mainly caused by
ordinary accounts. For what pertains to bots, their weekly activity appears
similar to Figure 5a, which might indicate that bots activity is scheduled sim-
ilarly for hyperactive and ordinary bot accounts. We further investigate such
intuitions in the next paragraphs.
(a) Engaged accounts (b) New accounts
Figure 9: Engaged and new accounts in the Midterm debate within the hy-
peractive accounts class
15In Figure 9b, we show the number of new hyperactive accounts that appear
in the Twitter discussion for each week of the year. As discussed before, an
account is considered new when it appears in the Midterm-related conversa-
tion for the first time over the observation window. Also in Figure 9b, bot
and human hyperactive accounts tend to have similar temporal patterns in
their appearance within the political discussion. This finding, related to the
hyperactive accounts, is in contrast to what we noticed in Figure 5b (where all
the accounts are considered), which further confirms that the different tempo-
ral patterns between humans and bots (in both Figure 5a and Figure 5b) are
mainly due to ordinary accounts activity.
Interestingly, and similarly to Figure 5b, in Figure 9b, an almost constant
number of new hyperactive bot accounts joined the conversation for each week
of the observation period, but in the election period, where the number of
new hyperactive bot accounts increased significantly. We also notice that the
majority of hyperactive accounts appeared since the end of 2017 (specifically,
from December 2017 to February 2018). Such a subset of users (about 5 percent
of the accounts) created about 60 percent of the collected tweets. This is
consistent with the findings reported in the previous paragraph. In particular,
here, we recognize that hyperactive accounts were the main responsible for the
tweets created by the users that joined the Midterm debate one year before the
election. Indeed, of the 79M tweets created by such users, 59M were shared by
hyperactive accounts, which, thus, represent the most prolific tweet fabricators.
Among these accounts, bots played a relevant role by broadcasting almost one-
third of the collected tweets. Indeed, 30.6M tweets were created by 19k bot
accounts, which means that 2 percent of the accounts in our dataset were bots
that shared about 31 percent of the collected tweets. This finding becomes
even more concerning when considering the pivotal role of the majority of
these accounts in the diffusion of narratives related to the QAnon conspiracy
theory (14k accounts) and their involvement in the current U.S. Presidential
election debate (16k accounts).
Next, we replicate the same evaluation for ordinary accounts. In Figure 10a,
we display the number of engaged ordinary accounts for each week of the obser-
vation period. Similarly to Figure 5a (where all the accounts are considered),
human accounts present an irregular pattern (with peaks and valleys) of en-
gagement if compared to bots trend, which presents a more controlled and
stationary pattern. The ordinary humans pattern is different from the one
observed for hyperactive humans (see Figure 9a), confirming that the non-
stationary pattern in Figure 5a is mainly caused by ordinary human accounts.
In Figure 10b, we depict the number of new ordinary accounts that ap-
peared in the Twitter discussion for each week of the year. Similarly to Fig-
ure 5b and Figure 9b, bots entered into the debate at a constant and lower
rate with respect to human accounts. Also, the majority of ordinary accounts
joined the discussion at the beginning of 2018 and during the election month.
Interestingly, by disentangling the shared tweets, we notice different activity
patterns among the bots injected from December 2017 to the first two weeks of
16(a) Engaged accounts (b) New accounts
Figure 10: Engaged and new accounts in the Midterm debate within the or-
dinary accounts class
February 2018 (old bots) and those appearing the month around the election
day (election bots). In Table 4, we detail how these two classes of accounts dis-
tributed their sharing activities. The main difference is related to the creation
of original content and the usage of retweets, similarly to Table 3 (where all
the accounts are considered). Here, the discrepancy between old and election
bots is even more pronounced, with election bots that performed re-sharing
activities only 58 percent of the time, while sharing original tweets 37 percent
of the time. This result further confirms the different approaches used by old
and election bots and highlights their diverse operational tasks.
Table 4: Sharing activities of ordinary bot accounts
Old bots Election bots
Tweets 3,553,531 37,713
Original tweets 16% 37%
Retweets 80% 58%
Replies 4% 5%
To further examine the different behavior between hyperactive and ordi-
nary bots, in Figure 11, we compare the activity of such classes of accounts.
In particular, Figure 11a depicts the number of engaged bots for each week
of the year. It can be noticed how the engagement of hyperactive bot ac-
counts presents a more steady pattern, with an increasing number of accounts
progressively engaged as the election approached, if compared to the trend of
ordinary bots, which presents a less stationary pattern of engagement and a
more pronounced growth in the month prior to the election.
This is also reflected in Figure 11b, which displays the number of new bots
accounts that joined the Midterm discussion over the year. From Figure 11b, we
can observe how a significant number of bots were active in the conversation
since the beginning of the year and new bots were weekly injected over the
months preceding the election. It can be noticed how a small and constant
number of hyperactive bots joined the conversation weekly, while a larger set
of ordinary bots was injected over the year and especially during the election
week.
17(a) Engaged bots (b) New bots
Figure 11: Engaged and new bots within Midterm debate
RQ4: Interactions and embeddedness of bot and human accounts In
this paragraph, we explore the interactions between human and bot accounts.
In particular, we examine the interplay in terms of retweets (re-sharing of
other users’ content) and replies (respond to other users’ content) exchanged
between these two classes of accounts over the whole period of observation.
We also investigate the embeddedness of both bots and humans within the
social network with the objective of measuring their centrality in the online
discussion.
Figure 12 shows the interactions in terms of retweets and replies between
the two classes of accounts, where each edge reports the volume of interactions
(in terms of percentage) between each group. The source of the edge represents
the user that re-shared (i.e., retweeted) the tweet of a target user. Node size
is proportional to the percentage of accounts in each group for the considered
sharing activity, while edge size is proportional to the percentage of interactions
between each group. On the one hand, we observe that human content is more
re-shared (59 percent of the retweets) than bot-generated content (41 percent
of the retweets). Interestingly, bots equally distribute their retweets towards
human- and bot-generated content, which might indicate a strategy operated
by bots to engage humans and possibly gain their endorsement [33]. It is im-
portant to note that more than one over three human retweets is a re-share
of content produced by bots. Such indiscriminate re-sharing, which allegedly
occurs because of humans’ ineptitude in recognizing inaccurate sources of in-
formation, represents a complex issue that might have dramatic repercussions
in the spread of misinformation [5, 44, 54].
On the other hand, we recognize that humans performed the majority of
replies and only a small percentage of those (around 12 percent) were in re-
sponse to bot-generated content, which is aligned with the findings of Bessi
and Ferrara [5] related to the 2016 U.S. Presidential election. Bots, in turn,
focused their replies on the interaction with humans, which appears in con-
trast with the 2016 pattern [5], where bots interacted with other bot accounts
more than with human users. We hypothesize that bots have become increas-
ingly advanced to initiate conversations with humans [34], but allegedly not
sufficiently sophisticated to convincingly involve humans in their discussion.
18Figure 12: Retweet and reply interactions between humans and bots
Indeed, bots received much less interaction (in terms of reply) from humans
with respect to the retweet interaction.
Next, we explore the embeddedness of both bots and humans within the
social network by also considering (i) the extent of their sharing activity (hy-
peractive vs. ordinary accounts) and (ii) the time of their appearance within
the Midterm debate. We recall that we indicate an account as old if it shared
the first Midterm-related tweet by the first two weeks of February 2018. Oth-
erwise, we here denote the account as recent. As detailed before, this choice
is motivated by the evidence that a significant number of accounts joined the
Twitter conversation from the early stage of the Midterm debate (see Figure
5b) and, in turn, generated a disproportionate volume of tweets if compared
to the recent ones.
To perform such analysis, in Figure 13, we depict the k-core decomposition
of the retweet network for the two classes of accounts (bots and humans).
A retweet network is a directed weighted graph that represents the retweet
interactions between users, where nodes represent users and edges represent
retweets among them. We extracted the k-cores from the retweet network by
varying k in the range between 0 and 500 (no variations can be observed after
this value). Figure 13 displays the percentage of hyperactive vs. ordinary
(resp. old vs. recent) users as a function of k, i.e., for every k-core we compute
the proportion of accounts of each group within the accounts in the k-core.
From Figure 13a, we can notice that the fraction of hyperactive bots in-
creases with k, while the percentages related to ordinary accounts drop with
k. It appears evident how hyperactive users, and in particular bot accounts,
populate the most central position within the retweet network. To the con-
trary, within the ordinary accounts set, human users appear to hold a more
central position within the retweet network with respect to bot accounts. Fig-
ure 13b depicts the k-core decomposition of recent and old accounts. It can be
noticed that old bots represent the group of accounts most embedded within
19(a) Hyperactive vs. ordinary accounts (b) Old vs. recent accounts
Figure 13: k-core decomposition of the retweet network for bot and human
accounts
the retweet network, which indicates that they are more deeply connected with
respect to old humans and recent accounts. Interestingly, we observe that, as k
grows, the fraction of humans drops, whereas the percentage of recent bots re-
mains almost steady. This suggests that a fraction of recent bots populate the
most central area of the social network, which, in turn, shows their capability
of infiltrating the online discussion and rapidly gaining trust and reputation
even in a relatively short time window.
Discussion and Conclusion
Bots represent one of the most recognized threats to the integrity of social me-
dia. The understanding of how bot accounts operate in social platforms and
infiltrate into crucial discussions is of pivotal importance to enable prompt and
precautionary detection of coordinated campaigns. Further, it is also funda-
mental measuring and controlling the extent of bots interactions with organic
users to assess the impact of their manipulation attempts. Along these research
directions, in this paper, we examined how bots strategically performed their
online activity over time during the year approaching the 2018 U.S. Midterm
elections, as well as the effects of their interplay with human users.
We observed how bots reproduced humans’ activity patterns for every shar-
ing activity (i.e., original tweet, retweet, and reply) since the year before the
election and we recognized their propensity of flooding online platforms with
retweets. However, an increasing number of bots created with the purpose of
sharing original content was strategically injected into the online conversation
as the election day approached. Interestingly, we discovered that a significant
fraction of bots (about one-third of the identified automated accounts) started
pushing Midterm-related content even one year before the election, generating
a conspicuous volume of tweets (34.2 million) over the whole observation pe-
riod. Alarmingly, this group of prolific tweet fabricators encompasses a small
set of hyperactive bots (19k accounts) that acted continuously over the whole
2018 broadcasting 30.6M tweets and most of them (16k accounts) are also op-
erating in the 2020 U.S. Presidential debate at the time of this writing. This
20finding becomes even more concerning when considering that hyperactive ac-
counts promoted the vast majority of conspiratorial narratives related to the
QAnon movement.
Further, we noticed that bots entered into the Midterm debate at a more
regular and lower rate with respect to human accounts. Specifically, a constant
number of bot accounts were injected and participated in the Midterm conver-
sation every week of the year, suggesting the implementation of a scheduled and
cautious strategy to infiltrate bots within the online discussion while avoiding
their detection. Besides these bots, a relevant fraction of automated accounts
have been created a few months prior to the election (from July to November
2018) and participated in the related discussion, which might indicate that such
accounts have been purposely injected for operating into the Midterm elections
debate. Interestingly, these bots generated significantly more original content,
while decreasing the usage of the retweet, with respect to older bot accounts.
This was particularly evident for bot accounts with a moderate engagement in
the Midterms debate (i.e., ordinary accounts), which suggests that diverse op-
erational tasks were deployed on more recent and less recent bot accounts, also
based on their degree of engagement within the conversation (i.e., hyperactive
vs. ordinary accounts).
Finally, bots resulted to be more deeply connected in the social network
with respect to humans, especially the hyperactive and less recent ones. It
stands out how a fraction of more recent bot accounts have been capable of
infiltrating the online discussion to the extent to rapidly gain trust and stand
in a central position of the social network in a relatively short time window. In
terms of interactions, bots equally distributed their retweets towards human-
and bot-generated content, while their replies were more focused on the inter-
play with humans. For what pertains to human accounts, it is alarming noting
that one over three human’s retweets was a re-share of content produced by
bots, which further highlights the need for intervention to avoid the diffusion
of misinformation. However, our results also reveal that bots received less
interaction from humans in terms of replies (if compared to retweets), which
might represent an encouraging finding when considering users’ awareness of
and response to the activity of malicious entities on social media.
Concluding, our study confirms how the detection of manipulation cam-
paigns is a complex and challenging task, even when suspected malicious ac-
counts are monitored over an extended observation window. Indeed, we have
shown that a pivotal set of bots mimicked human sharing activities by emulat-
ing the volume and temporal patterns of their narratives several months before
the voting event while dominating the debate and infiltrating the most influ-
ential areas of the social network. These results should be a cause of concern
when considering the persuasive power of social media, especially in the polit-
ical context, where the upcoming 2020 U.S. Presidential Election represents a
global testing ground for our democracy.
However, our analysis revealed novel patterns (e.g., the increasing injec-
tion of bots aimed at creating original content as the election approached)
21and actionable insights (e.g., hyperactive bot accounts started their sharing
activity one year before the election and were responsible for fueling conspir-
atorial narratives) that can empower the identification of malicious entities
and, accordingly, contribute to the detection of coordinated campaigns. These
findings, and corresponding analysis, will be validated in our future work by
encompassing both other voting events discussions and social conversations on
diverse contexts (e.g., public health).
Acknowledgments
The authors are funded by the European Institute of Innovation & Technology
via the project Virtual Machina, and by the Swiss National Science Foundation
via the project Late teenagers Online Information Search (LOIS). The authors
are grateful to Emilio Ferrara’s team at USC for releasing the Twitter 2020
U.S. Presidential election dataset, and to Goran Muric (USC) for his support
with the dataset.
References
[1] Addawood, A., Badawy, A., Lerman, K., Ferrara, E.: Linguistic cues to
deception: Identifying political trolls on social media. In: Proceedings of
the International AAAI Conference on Web and Social Media. vol. 13, pp.
15–25 (2019)
[2] Allcott, H., Gentzkow, M.: Social media and fake news in the 2016 elec-
tion. Journal of Economic Perspectives 31(2), 211–36 (2017)
[3] Badawy, A., Addawood, A., Lerman, K., Ferrara, E.: Characterizing the
2016 russian ira influence campaign. Social Network Analysis and Mining
9(1), 31 (2019)
[4] Badawy, A., Ferrara, E., Lerman, K.: Analyzing the digital traces of
political manipulation: The 2016 russian interference twitter campaign.
In: ASONAM. pp. 258–265 (2018)
[5] Bessi, A., Ferrara, E.: Social bots distort the 2016 us presidential election
online discussion. First Monday 21(11) (2016)
[6] Bovet, A., Makse, H.A.: Influence of fake news in twitter during the 2016
us presidential election. Nature communications 10(1), 7 (2019)
[7] Broniatowski, D.A., Jamison, A.M., Qi, S., AlKulaib, L., Chen, T., Ben-
ton, A., Quinn, S.C., Dredze, M.: Weaponized health communication:
Twitter bots and russian trolls amplify the vaccine debate. American jour-
nal of public health 108(10), 1378–1384 (2018)
22[8] Cardoso, F., Luceri, L., Giordano, S.: Digital weapons in social media
manipulation campaigns. Workshop Proceedings of the 14th International
AAAI Conference on Web and Social Media (2020)
[9] Chavoshi, N., Hamooni, H., Mueen, A.: Debot: Twitter bot detection via
warped correlation. In: ICDM. pp. 817–822 (2016)
[10] Chen, E., Deb, A., Ferrara, E.: # election2020: The first public
twitter dataset on the 2020 us presidential election. arXiv preprint
arXiv:2010.00600 (2020)
[11] Chen, Z., Subramanian, D.: An unsupervised approach to detect spam
campaigns that use botnets on twitter. arXiv preprint arXiv:1804.05232
(2018)
[12] Cresci, S.: A decade of social bot detection. Communications of the ACM
63(10), 72–83 (2020)
[13] Cresci, S., Di Pietro, R., Petrocchi, M., Spognardi, A., Tesconi, M.: Emer-
gent properties, models, and laws of behavioral similarities within groups
of twitter users. Computer Communications 150, 47–61 (2020)
[14] Cresci, S., Lillo, F., Regoli, D., Tardelli, S., Tesconi, M.: $ fake: Evidence
of spam and bot activity in stock microblogs on twitter. In: Twelfth in-
ternational AAAI conference on web and social media (2018)
[15] Cresci, S., Petrocchi, M., Spognardi, A., Tognazzi, S.: Better safe than
sorry: an adversarial approach to improve social bot detection. In: Pro-
ceedings of the 10th ACM Conference on Web Science. pp. 47–56 (2019)
[16] Davis, C.A., Varol, O., Ferrara, E., Flammini, A., Menczer, F.: Botornot:
A system to evaluate social bots. In: Proceedings of the 25th International
Conference Companion on World Wide Web (2016)
[17] Deb, A., Luceri, L., Badawy, A., Ferrara, E.: Perils and challenges of
social media and election manipulation analysis: The 2018 us midterms.
In: Companion Proceedings of the 2019 World Wide Web Conference
(2019)
[18] Ferrara, E.: Manipulation and abuse on social media by emilio ferrara with
ching-man au yeung as coordinator. ACM SIGWEB Newsletter (Spring),
4 (2015)
[19] Ferrara, E.: Disinformation and social bot operations in the run up to the
2017 french presidential election. First Monday 22(8) (2017)
[20] Ferrara, E.: The history of digital spam. Communications of the ACM
62(8), 82–91 (2019)
23[21] Ferrara, E.: What types of covid-19 conspiracies are populated by twitter
bots? First Monday (2020)
[22] Ferrara, E., Chang, H., Chen, E., Muric, G., Patel, J.: Characterizing so-
cial media manipulation in the 2020 u.s. presidential election. First Mon-
day (2020)
[23] Ferrara, E., Varol, O., Davis, C., Menczer, F., Flammini, A.: The rise of
social bots. Communications of the ACM 59(7), 96–104 (2016)
[24] Ferrara, E., Varol, O., Menczer, F., Flammini, A.: Detection of promoted
social media campaigns. In: Tenth International AAAI Conference on Web
and Social Media. pp. 563–566 (2016)
[25] Gerber, T.P., Zavisca, J.: Does russian propaganda work? The Washing-
ton Quarterly 39(2), 79–98 (2016)
[26] Giglietto, F., Righetti, N., Rossi, L., Marino, G.: Coordinated link shar-
ing behavior as a signal to surface sources of problematic information on
facebook. In: International Conference on Social Media and Society. pp.
85–91 (2020)
[27] Grinberg, N., Joseph, K., Friedland, L., Swire-Thompson, B., Lazer, D.:
Fake news on Twitter during the 2016 U.S. presidential election. Science
363(6425), 374–378 (2019)
[28] Howard, P.N., Bolsover, G., Kollanyi, B., Bradshaw, S., Neudert, L.M.:
Junk news and bots during the us election: What were michigan voters
sharing over twitter. CompProp, OII, Data Memo (2017)
[29] Howard, P.N., Kollanyi, B., Woolley, S.: Bots and automation over twit-
ter during the us election. Computational Propaganda Project: Working
Paper Series (2016)
[30] Hughes, A., Asheer, N.: National politics on twitter: Small share of us
adults produce majority of tweets. Pew Research Center (2019)
[31] Hui, P.M., Yang, K.C., Torres-Lugo, C., Menczer, F.: Botslayer: Diy real-
time influence campaign detection. In: Proceedings of the International
AAAI Conference on Web and Social Media. vol. 14, pp. 980–982 (2020)
[32] Im, J., Chandrasekharan, E., Sargent, J., Lighthammer, P., Denby, T.,
Bhargava, A., Hemphill, L., Jurgens, D., Gilbert, E.: Still out there:
Modeling and identifying russian troll accounts on twitter. arXiv preprint
arXiv:1901.11162 (2019)
[33] Luceri, L., Deb, A., Badawy, A., Ferrara, E.: Red bots do it better: Com-
parative analysis of social bot partisan behavior. In: Companion Proceed-
ings of The 2019 World Wide Web Conference. pp. 1007–1012 (2019)
24You can also read