Fractionation of Lignocellulosic Biomass by Selective Precipitation from Ionic Liquid Dissolution - MDPI
←
→
Page content transcription
If your browser does not render page correctly, please read the page content below
applied
           sciences
Article
Fractionation of Lignocellulosic Biomass by Selective
Precipitation from Ionic Liquid Dissolution
Marta Lara-Serrano, Silvia Morales-delaRosa, Jose M. Campos-Martín *               and Jose L. G. Fierro
 Energy and Sustainable Chemistry Group (EQS), Instituto de Catálisis y Petroleoquímica, CSIC, c/Marie Curie 2
 Cantoblanco, 28049 Madrid, Spain; m.lara.serrano@csic.es (M.L.-S.); smorales@icp.csic.es (S.M.-d.);
 jlgfierro@icp.csic.es (J.L.G.F.)
 * Correspondence: jm.campos@csic.es

 Received: 15 April 2019; Accepted: 30 April 2019; Published: 7 May 2019

 Abstract: We propose the treatment of barley straw with 1-ethyl-3-methylimidazolium acetate
 [EMIMAcO] ionic liquids (ILs) and subsequent precipitation with antisolvent mixtures, thus allowing
 the separation of the sugar-rich fractions (cellulose and hemicellulose) from the lignin fraction. For this
 purpose, different concentration ranges of acetone:water antisolvent mixtures were studied. In all
 cases, a high recovery percentage and a high and effective separation of fractions was achieved
 for 1:1 acetone:water. The fractionated lignocellulosic compounds were studied by using infrared
 spectroscopy, scanning electron microscopy and 1 H nuclear magnetic resonance characterization
 techniques. This method allows the possibility of reusing IL, confirming the versatility of the
 established method. The fraction rich in cellulose and hemicellulose was subjected to acid hydrolysis
 (0.2 mol/L H2 SO4 ) for 5 h at 140 ◦ C, obtaining a yield of total reducing sugars of approximately 80%,
 much higher than those obtained in non-pretreated samples.

 Keywords: lignocellulosic biomass; ionic liquid; ethyl methyl imidazolium; fractionation; pretreatment;
 barley straw

1. Introduction
      The exponential growth of the global population and industrial activity in the last century has
 compromised the sustainability of life on Earth. The European Commission has set a long-term goal
 to develop a competitive, resource-efficient and low-carbon economy by 2050 [1]. The bioeconomy
will play an important role (2.4 billon € market value in 2015). While fossil resources are the major
 source of energy and chemicals, biomass will eventually be the most prominent source. Cellulose,
 hemicelluloses and lignin are the most abundant biopolymers on Earth [2]. These biopolymers are
 the major components of the plant cell wall, where they are present in a dense ordered matrix and
 are known as lignocellulose [3,4]. Biomass lignocellulosic used as a feedstock may contain also
 minor components like proteins and other nitrogen containing materials, non-structural material
 and inorganic material (ashes) structural or extractable [5]. Cellulose is a linear polymer of glucose
 units with β-(1→4) links that form a cellulose chain [6–8], and cellulose chains form fibers via
 H-bonds. Cellulose can be present in a crystalline or amorphous structure, which determines its
 resistance to hydrolysis [9,10]. In contrast to cellulose, the chemical composition of hemicelluloses
 differs between lignocellulose sources [3]. Lignin is a complex heterogeneous branched polymer
 that consists of 4-phenylpropane units linked by ether and carbon–carbon alkyl–aryl and aryl–aryl
 linkages [11]. Various linkages can also exist between lignin and cellulose or hemicelluloses in so-called
‘lignin-carbohydrate complexes’. Lignocellulosic biomass conversion requires, almost unavoidably, a
pretreatment step, which can be physical, chemical, biochemical, biological or a combination thereof.
 Pretreatment can reduce the particle size, improve the porosity, alter the cellulose crystallinity and

Appl. Sci. 2019, 9, 1862; doi:10.3390/app9091862                                  www.mdpi.com/journal/applsci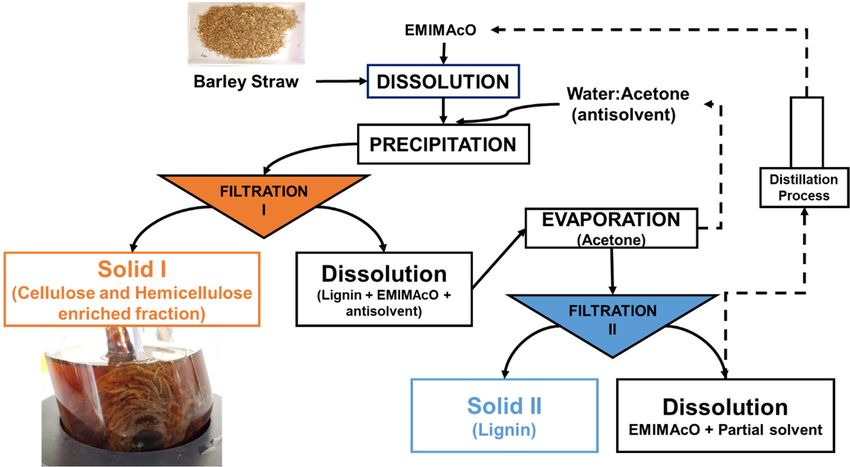
Appl. Sci. 2019, 9, 1862                                                                              2 of 17

fractionate the lignocellulose [10,12–17]. The presence of lignin is considered to be a major barrier
to achieving efficient cellulosic bioconversion because of its negative interaction with the biocatalyst
during enzymatic hydrolysis and microbial fermentation [18,19]. Lignin acts as a cement around
cellulose fibrils, and it is difficult to separate the two components. Typically, harsh conditions are
used, causing chemical and structural changes [20]. Once lignin is isolated as a solid (technical lignin),
the resulting material is even more recalcitrant than its native state. One of the more interesting
lignocellulosic residues are barley wastes. These residues are the second largest biomass feedstock in
Europe [21,22]. The estimated amounts of environmental sustainable of barley straw in the European
Union for 2030 are 25 million tons [23].
     Ionic liquids (ILs) are effective in solubilizing crystalline cellulose and lignocellulosic
biomass [24–32], and dissolved cellulose can be regenerated by precipitation with antisolvents.
Interestingly, regenerated cellulose shows lower crystallinity and enhanced subsequent hydrolysis
rates [33,34]. ILs can also deconstruct and fractionate lignocellulose. Once lignocellulosic biomass is
dissolved, it can be fractionated into its principal components by the addition of antisolvents, which
leads to the selective precipitation of lignin, cellulose or hemicellulose [35–41]. There is a plethora of
studies of IL dissolution of lignocellulosic biomass, where ionic liquids of the imidazolium type are the
best solvents [33,42–47]. Among them 1-ethyl-3-methylimidazolium acetate [EMIMAcO] is the most
popular, because of his physical properties (low boiling point and viscosity) and chemical properties,
absence of halogen as an anion, is not corrosive and practically no reactive with the biomass [30,48–54].
     In this work, we studied the dissolution of barley straw in [EMIMAcO] and subsequent
precipitation with different concentrations of water:acetone mixtures to improve the fractionation of
lignocellulosic biomass. This combination may be interesting because the presence of water favors
the precipitation of all the main components of biomass (cellulose, hemicellulose and lignin), while
acetone does not favor the precipitation of lignin, according to the literature [55].

2. Materials and Methods
     All chemicals were of reagent grade and purchased from Meck Milipore Sigma-Aldrich (Darmstadt,
Germany), except xylan (from beechwood), which was purchased from TCI-Europe, N. V. (Zwijndrecht,
Belgium) and used without any further purification. The lignocellulosic biomass (barley straw) used
was provided and characterized by the Biofuels Unit of CIEMAT.
     Analysis of Barley Straw. The methods of characterization of barley straw are procedures adapted
from the standard methods for the analysis of biomass published by the National Renewable Energy
Laboratory (NREL; Colorado, USA) [56]. Determinations of extractives were made in quadruplicate,
and component analysis of the collected samples was performed in triplicate. The average values for
dried samples are summarized in Table 1.

                  Table 1. Composition analysis (wt.%) of samples of barley straw dried at 105 ◦ C.

                                    Extractives                  13.37
                                     Aqueous                     10.99 ± 0.31
                                     Organic                     2.38 ± 0.26
                                    Cellulose                    31.09 ± 1.25
                                    Hemicellulose                27.23 ± 0.44
                                     Xylose                      22.06 ± 0.47
                                     Galactose                   1.3 ± 0.01
                                     Arabinose + Mannose         3.87 ± 0.03
                                    Insoluble Lignin             16.67 ± 1.13
                                    Soluble Lignin               2.1 ± 0.03
                                    Ash                          3.89 ± 0.05
                                    Acetyl Goups                 1.72 ± 0.02
Appl. Sci. 2019, 9, 1862 3 of 17
Appl. Sci. 2019, 9, x FOR PEER REVIEW 3 of 19
102 reactorand
®
Dissolution equipped with mechanical
Precipitation. A totalstirring
of 0.50atg atmospheric
of barley strawpressure
was[34,47,57,58].
dissolved in Complete
9.50 g of ionic
visual dissolution was observed at 3.5 h, and then the carbohydrate-rich ◦ material was precipitated by
liquid (1-ethyl-3-methylimidazolium acetate, [EMIMAcO]) at 105 C in a Mettler-Toledo Easy Max
the addition of an antisolvent (25 mL). The antisolvents tested were water, acetone and mixtures
102® reactor
thereof.equipped withSolid
The obtained mechanical stirringby
I was separated at vacuum
atmospheric pressure
filtration with a [34,47,57,58].
nylon membrane Complete
(20 µL) visual
dissolution
such that the lignin dissolved in the ionic liquid (IL) was not retained in the filter. The filtered solid, by the
was observed at 3.5 h, and then the carbohydrate-rich material was precipitated
additionwhich
of anwas
antisolvent (25 mL). Thewas
rich in carbohydrates, antisolvents tested
washed several were
times water,
with acetone
distilled waterand mixtures
to remove the thereof.
remaining IL. Solid II (carbohydrate-free lignin) was recovered by evaporation of
The obtained Solid I was separated by vacuum filtration with a nylon membrane (20 µL) such that the acetone, vacuum
filtration with a nylon membrane (0.2 µL) and washing with distilled water (Figure 1).
lignin dissolved in the ionic liquid (IL) was not retained in the filter. The filtered solid, which was rich
The scheme of the dissolution process of barley straw in the ionic liquid [EMIMAcO] and
in carbohydrates, was washed several times with distilled water to remove the remaining IL. Solid II
subsequent precipitation with mixtures of water:acetone is shown in Figure 1, which shows the
(carbohydrate-free
methods usedlignin) was
to obtain therecovered bysolids.
two types of evaporation of acetone,
Solid I (rich vacuum
in cellulose filtration with
and hemicellulose) wasa nylon
membrane (0.2 µL) and washing with distilled water (Figure 1).
obtained after Filtration I, and Solid II (rich in lignin) was obtained after Filtration II from the liquid
obtained in the first filtration after the evaporation of acetone.
The1.scheme
Figure
Figure 1. of the
The scheme process
of the ofofdissolution
process ofbarley
dissolution of barleystraw
straw in [EMIMAcO]
in [EMIMAcO] and subsequent
and subsequent
precipitation
precipitation with awith a water:acetone
water:acetone antisolventmixture.
antisolvent mixture.
Hydrolysis. Hydrolysis reactions were carried out batchwise in a magnetically stirred 100 mL
The scheme of the dissolution process of barley straw in the ionic liquid [EMIMAcO] and
thermostatic Teflon-lined steel Berghof reactor equipped with a pressure addition funnel [33,34,57].
subsequent precipitation with mixtures of water:acetone is shown in Figure 1, which shows the
In a typical run, 0.5 g of barley straw and 40 mL of water were mixed in the reactor, the suspension
methods wasused to to
heated obtain the two
the reaction types of(140
temperature solids. Solid
°C), and I (rich
10 mL of H2in
SOcellulose and hemicellulose) was
4 (0.2 mol/L) was added to the
obtained after These
reactor. Filtration I, and
are the Solid
optimal II (rich obtained
conditions in lignin) was
from obtained
previous after
works Filtration
[33,57]. II fromtime
The reaction the liquid
obtainedwas
in measured from this moment;
the first filtration after thethe reaction wasof
evaporation stopped
acetone.at 5 h, and the suspension was quickly
cooled. Aliquots
Hydrolysis. were periodically
Hydrolysis reactions taken
werefrom the reactor.
carried The solutioninwas
out batchwise filtered off andstirred
a magnetically washed 100 mL
with distilled water, and finally, the solid was dried at 80 °C overnight. The amount of solid isolated
thermostatic Teflon-lined steel Berghof reactor equipped with a pressure addition funnel [33,34,57].
was determined by weighing. The liquid was analyzed by HPLC (Agilent Technologies (Santa Clara,
In a typical run, 0.5
California, USA)g of barley
HPLC 1200straw andseries).
and 1260 40 mL Theofchromatographic
water were mixed in thewere
separations reactor, theout
carried suspension
in
was heated to theHreaction ◦
a Hi-PLEX column attemperature
60 °C using 0.6(140
mL/min C),sulfuric
and 10 mL
acid of H2 SO
aqueous 4 (0.2(0.01
solution mol/L)
M) aswas added to the
the mobile
reactor.phase
These andare
in the optimal
a Hi-Plex conditions
Pb column obtained
at 90 °C using 0.6 from
mL/min previous worksfor[33,57].
water solution HPLC asThe reaction time
the mobile
phase and a refractive index detector. This method avoids the analysis of sugars
was measured from this moment; the reaction was stopped at 5 h, and the suspension was quickly (glucose and xylose)
cooled. and the secondary
Aliquots products (5-hydroxy-methylfurfural,
were periodically taken from the reactor. furfural and levulinic
The solution wasacid). Identification
filtered off and washed
and quantification of the components was performed by ◦comparison of retention times and using
with distilled water, and finally, the solid was dried at 80 C overnight. The amount of solid isolated
internal calibration curves by pattern compounds.
was determined by weighing. The liquid was analyzed by HPLC (Agilent Technologies (Santa Clara,
California, USA) HPLC 1200 and 1260 series). The chromatographic separations were carried out in a
Hi-PLEX H column at 60 ◦ C using 0.6 mL/min sulfuric acid aqueous solution (0.01 M) as the mobile
phase and in a Hi-Plex Pb column at 90 ◦ C using 0.6 mL/min water solution for HPLC as the mobile
phase and a refractive index detector. This method avoids the analysis of sugars (glucose and xylose)
and the secondary products (5-hydroxy-methylfurfural, furfural and levulinic acid). Identification and
quantification of the components was performed by comparison of retention times and using internal
calibration curves by pattern compounds.Appl. Sci. 2019, 9, 1862 4 of 17
FTIR. Infrared spectra of the solids were recoded with a Jasco FT/IR-6300 spectrophotometer with
KBr pellets made of 5% sample. A total of 180 cumulative scans were performed with a resolution of
4 cm−1 in the frequency range of 4000–800 cm−1 in absorption mode.
NMR. 1 H Nuclear magnetic resonance (NMR) spectra were obtained in DMSO-d6 and were
recorded using a Bruker Advance at 300 MHz referenced to DMSO at 2.50 ppm.
Scanning electron microscopy (SEM). SEM micrographs of untreated barley straw and barley
straw pretreated with IL were collected with a Hitachi S-3000 N instrument. The samples were treated
with increasing concentrations of ethanol to fix the structure and to dehydrate the samples. The
samples were metallized in a Balzers SCD 004 gold sputter coater and were sputter-coated with a thin
layer of gold.
X-ray diffraction (XRD). XRD profiles of samples were recorded with an X’Pert Pro PANalitical
diffractometer equipped with a CuKα radiation source (λ = 0.15418 nm) and X’Celerator detector based
on real-time multiple-strip (RTMS) detection. The samples were ground and placed on a stainless steel
plate. The diffraction patterns were recorded in steps over a range of Bragg angles (2θ) between 4◦
and 90◦ at a scanning rate of 0.02◦ per step and an accumulation time of 50 s. Diffractograms were
analyzed with X’Pert HighScore Plus software.
3. Results and Discussion
3.1. Effect of the Water:Acetone Ratio
The barley straw dissolved in [EMIMAcO] was reconstructed by the addition of an antisolvent.
The antisolvents employed were mixtures of water:acetone (W:A) with different mass ratios: 1:0, 2:1,
1.5:1, 1:1, 1:1.5, 1:2 and 0:1. The solid precipitated after the addition of the solvent was labeled “Solid
I”, and a second solid was obtained after the evaporation of acetone, labeled “Solid II”. To evaluate the
fractionation ability of the antisolvent employed, the mass of each solid was measured and compared
with the theoretical amount that corresponds in Solid I to the sum of cellulose and hemicellulose and
in Solid II to lignin. In addition, the recovered in each solid and total biomass was calculated by
comparing the sum of the masses recovered in the two filtrations and the sum of cellulose, lignin and
hemicellulose present in the biomass added at the beginning of the experiment. The results obtained
from precipitation with the different antisolvents are shown in Table 2.
Table 2. Mass balance of matter based on dry barley straw after precipitating the biomass with different
water:acetone antisolvent mixtures. The barley straw samples were dissolved in [EMIMAcO]) at 105
◦ C for 3.5 h.
% Solid I % Solid II
Sample a % Recovered
Antisolvent % Initial % Initial
% Expected c % Expected c Biomass
Biomass b Biomass b
WA-1:0 Water No separation found 89%
WA-2:1 Water:Acetone 2:1 77.6% 113.4% 10.4% 53.1% 88%
WA-1.5:1 Water:Acetone 1.5:1 79.9% 112.9% 11.1% 55.0% 91%
WA-1:1 Water:Acetone 1:1 71.2% 102.9% 17.8% 90.0% 89%
WA-1:1.5 Water:Acetone 1:1.5 78.6% 113.6% 10.4% 52.5% 89%
WA-1:2 Water:Acetone 1:2 78.1% 114.2% 9.9% 50.4% 88%
WA-0:1 Acetone No separation found 87%
a The samples are called WA-X:Y, where WA refers to “Water:Acetone” and the numbers X and Y indicate the
water:acetone ratio used. b % of biomass recovered based on the initial mass of cellulose + hemicellulose + lignin
present in raw barley straw. c % of mass recovered if Solid I is only the sum (cellulose + hemicellulose) and Solid II
is the mass of lignin (Table 1).
The total recovered biomass was high, approximately 90%, in all cases, respect the sum of
hemicellulose + cellulose + lignin present in the starting barley straw. In Solid II the recovery is
between 70 and 80% while in Solid II is 10–17%, depending on the mixture of antisolvent employed.
This effect was also observed in the % expected which depends also on the mixture employed. WhenAppl. Sci. 2019, 9, x FOR PEER REVIEW 5 of 19
Appl. Sci. 2019, 9, 1862 5 of 17
Table 2. Mass balance of matter based on dry barley straw after precipitating the biomass with
different water:acetone antisolvent mixtures. The barley straw samples were dissolved in
pure [EMIMAcO]) at 105
solvent (water °C for 3.5was
or acetone) h. employed, only Solid I was obtained, which implies no separation
of components by selective precipitation. % However,
Solid I the properties%ofSolid
the obtained
II solid were % quite
different
Sample depending
a on the pure solvent
Antisolvent employed.
% Initial When water
% Expected % was used as an antisolvent,
Initial Solid I was
Recovered
% Expected c
easy to manipulate, wash and filter, but inbthe case cof acetone,
Biomass the solid
Biomass b obtained was very Biomassdifficult to
WA-1:0wash and filter.
handle, WaterHowever, when the antisolvent No separation found of water:acetone, the presence
was a mixture 89%
WA-2:1 Water:Acetone 2:1 77.6% 113.4% 10.4% 53.1%
of two solids (Solid I and Solid II) was observed (Table 2). In all cases, the amount of Solid I was higher 88%
WA-1.5:1
than Water:Acetone
the theoretical sum of1.5:1
cellulose79.9% 112.9% (>100%),
and hemicellulose 11.1%
and the amount 55.0%of Solid II was91%lower
WA-1:1 Water:Acetone 1:1 71.2% 102.9% 17.8% 90.0% 89%
than the theoretical amount of lignin (in xylans (hemicellulose); 1653 cm−1 indicates absorbed O-H and conjugated C-O in lignin; 1593 cm−1
and 1508 cm−1 indicate C=C skeletal vibrations (aromatic ring) in lignin; 1457 cm−1 and 1420 cm−1
indicate C-H deformation in lignin and carbohydrates; 1375 cm−1 indicates C-H deformation in
cellulose and hemicellulose; 1336 cm−1 and 1318 cm−1 indicate C-H vibration in cellulose and C-O
vibration in syringyl derivatives; 1264 cm−1 indicates guaiacyl ring breathing, C-O stretching in lignin
Appl.and
Sci. 2019,
C-O 9,linkages
1862 in guaiacyl aromatic methoxyl groups; 1157 cm−1 indicates C-O-C vibration in 6 of 17
cellulose and hemicellulose; 1118 cm−1 indicates aromatic skeletal vibration; 1085 and 1035 cm−1
indicate C-O deformation in aliphatic ether and guaiacyl aromatic methoxyl groups, respectively;
as follows
1048 cm [60–63]:
−1 indicates cm−1stretching
1735 C-O indicates unconjugated
in cellulose and C=O in xylans (hemicellulose);
hemicellulose; 1653 cm−1C-H
and 896 cm−1 indicates indicates
absorbed O-H and conjugated C-O in lignin; 1593 cm −1 and 1508 cm −1 indicate C=C skeletal vibrations
deformation in cellulose [60–63].
(aromaticThe ring) in lignin;
presence of a1457
peakcm at−1 andcm
1508 1420
−1 is cm −1 indicate C-H deformation in lignin and carbohydrates;
usually taken as an indication of the presence of lignin,
−1
1375especially
cm indicateswhen aC-H weakdeformation
band at 1520in cmcellulose
−1 is present
and[63] (Figure 4), whereas
hemicellulose; the−1
1336 cm 1735,
and1157, cm−1
13181048 and
indicate
C-H897 cm peaks
−1
vibration are characteristic
in cellulose and C-Oof polysaccharides
vibration [60,63].
in syringyl There are1264
derivatives; somecm −1 indicates
weak bands typical of ring
guaiacyl
lignin in
breathing, C-OFigure 4, confirming
stretching thatand
in lignin lowC-O
amounts of lignin
linkages are retained
in guaiacyl in Solid
aromatic I, as cangroups;
methoxyl be deduced
1157 cm−1
from the mass balance data (Table 2). However, no peaks attributed −1 to polysaccharides are evident
indicates C-O-C vibration in cellulose and hemicellulose; 1118 cm indicates aromatic skeletal vibration;
in the spectrum of Solid II (Figure 4). In summary, the spectrum of Solid I is similar to that
1085 and 1035 cm−1 indicate C-O deformation in aliphatic ether and guaiacyl aromatic methoxyl groups,
corresponding to the pure cellulose reference, whereas the spectrum of Solid II is similar to that
respectively; 1048 cm−1 indicates C-O stretching in cellulose and hemicellulose; and 896 cm−1 indicates
corresponding to lignin. These data indicate that selective precipitation occurred, except for small
C-Hamounts
deformation in cellulose
of lignin incorporated[60–63].
into Solid I.
1045
Xylan
Cellulose
1071
Solid I (WA1:1)
1118
1157
997
1653
1635
1375
1418
1456
1198
1318
1337
1558
1520 1508
1733
896
1800 1600 1400 1200 1000 800
Wavenumber (cm-1)
Appl. Sci. 2019, 9, x FOR PEER REVIEW 7 of 19
Figure 3. FTIR spectra of Solid I, commercial cellulose and xylan.
Figure 3. FTIR spectra of Solid I, commercial cellulose and xylan.
Lignin
Solid II (WA 1:1)
1123
1593
1653
1508
1457
1636
1035
1540
1085
1420
1559
1223
1264
1157
1375
1336
1520
1301
1735
1800 1600 1400 1200 1000 800
Wavenumber (cm-1)
Figure4.4.FTIR
Figure FTIR spectra ofSolid
spectra of SolidIIIIand
and commercial
commercial lignin.
lignin.
TheNMR
presence of a peak at 1508 cm −1
is usually taken as an indication of the presence of lignin,
3.3. Analysis
especially when a weak band at 1520 cm−1 is present [63] (Figure 4), whereas the 1735, 1157, 1048 and
The Solid I and Solid II samples were analyzed by 1H magnetic resonance in DMSO-d6 solution
−1
897 cm peaks are characteristic of polysaccharides [60,63]. There are some weak bands typical of
and were compared with commercial reference materials of cellulose, xylans and lignin (Figures 5–
lignin
9). in
The Figure
spectra4,ofconfirming that low
Solid I and Solid II areamounts of lignin are retained in Solid I, as can be deduced
very different.
from theThemass 1Hbalance
spectrum of Solid I (Figure 5), obtainedpeaks
data (Table 2). However, no attributed
after the to polysaccharides
first filtration, was compared are
withevident
the in
reference 1H spectra of commercial samples of cellulose and hemicellulose (Figure 6 and Figure 7). A
combination of the structural skeletons of both sugars in the range of 5.5–3.5 ppm is observed [64,65].
This observation indicates that Solid I is mainly a combination of carbohydrates; however, in the
spectrum of Solid I, peaks corresponding to aromatic rings at 7.8 and 7.7 ppm and aldehyde at 9.0
ppm, associated with lignin, were observed. These data are consistent with the mass balance, which
indicated that the mass recovered in the first filtration was slightly higher than expected. This analysisAppl. Sci. 2019, 9, 1862 7 of 17
the spectrum of Solid II (Figure 4). In summary, the spectrum of Solid I is similar to that corresponding
to the pure cellulose reference, whereas the spectrum of Solid II is similar to that corresponding to
lignin. These data indicate that selective precipitation occurred, except for small amounts of lignin
incorporated into Solid I.
3.3. NMR Analysis
The Solid I and Solid II samples were analyzed by 1 H magnetic resonance in DMSO-d6 solution
and were compared with commercial reference materials of cellulose, xylans and lignin (Figures 5–9).
The spectra of Solid I and Solid II are very different.
The 1 H spectrum of Solid I (Figure 5), obtained after the first filtration, was compared with
the reference 1 H spectra of commercial samples of cellulose and hemicellulose (Figures 6 and 7).
A combination of the structural skeletons of both sugars in the range of 5.5–3.5 ppm is observed [64,65].
This observation indicates that Solid I is mainly a combination of carbohydrates; however, in the
spectrum of Solid I, peaks corresponding to aromatic rings at 7.8 and 7.7 ppm and aldehyde at 9.0
ppm, associated with lignin, were observed. These data are consistent with the mass balance, which
indicated that the mass recovered in the first filtration was slightly higher than expected. This analysis
confirms that a small amount of lignin was present in Solid I.
The 1 H spectra of Solid II (Figure 8) and commercial lignin (Figure 9) are quite similar. In both
spectra, signals appear at 9.2 ppm, corresponding to the strong shielding among guaiacyl groups,
although a greater intensity is observed in the 1 H spectrum of Solid II than that of the reference lignin.
Methoxyl group protons are in the region of 4.0–3.4 ppm, very close to the water protons of aldehyde
groups. signals in the region of 8.5–8.0 ppm correspond to the phenolic hydroxyl protons of lignin, and
in the range of 8.0–6.0, the observed proton signals belong to the aromatic rings and vinyl protons of
syringyl and guaiacyl. In the range of 6.0–4.0 ppm, signals of protons belonging to α, β, and γ saturated
carbons of β-O-4, β-5 and β-β linkages appear because the lignin and Solid II are not completely dry
and the DMSO-d6 is not 100% pure [66,67]. Finally, in the range of 2.0–1.0 ppm, the signals correspond
to CH2 , the aliphatic protons belonging to methyl or methylene groups, while the signals between 1.0
Appl. Sci. 2019, 9, x FOR PEER REVIEW 8 of 19
and 0.8 ppm were attributed to the protons in saturated aliphatic chains in lignin [66]. In summary,
Solid II is essentially lignin. These observations are in agreement with the IR characterization: Solid I
is a carbohydrate-rich solid with a small amount of lignin, and Solid II is essentially lignin.
SOLID I
DMSO-d6
Aromatic Region
Aldehyde Group
H2O
10.0 9.5 9.0 8.5 8.0 7.5 7.0
f1(ppm)
Hemicelullose and Cellulose Backbone
5.4 5.2 5.0 4.8 4.6 4.4 4.2 4.0 3.8 3.6
f1(ppm)
Aliphatic Region
10 9 8 7 6 5 4 3 2 1 0
f1(ppm)
Figure 5. 1 H NMR spectrum of Solid I.
Figure 5. 1H NMR spectrum of Solid I.
H6
H 6'
Cellulosef1(ppm)
Figure 5. 1H NMR spectrum of Solid I.
Appl. Sci. 2019, 9, 1862 8 of 17
H6
H4
H 6'
OH
Cellulose
DMSO-d6
H2
O
O
H2O
HO H5 OH
H3 H1
n
H 1 ; H6
H3
H6' H5
H2 H4
5.4 5.2 5.0 4.8 4.6 4.4 4.2 4.0 3.8 3.6
f1(ppm)
6 5 4 3 2 1 0
f1(ppm)
Appl. Sci. 2019, 9, x FOR PEER REVIEW 9 of 19
Figure 6. 1 H nuclear magnetic resonance (NMR) spectrum of commercial cellulose.
Figure 6. 1H nuclear magnetic resonance (NMR) spectrum of commercial cellulose.
Hemicellulose
DMSO-d6
H2 O
Hemicelullose Backbone
Aliphatic Region
-OCH3
6 5 4 3 2 1 0
f1(ppm)
Figure 7. 1 H NMR spectrum of commercial xylans.
Figure 7. 1H NMR spectrum of commercial xylans.
DMSO-d6
Aliphatic CHO-C-CH2-O
SOLID II
H2O
Phenol groups
Aldehyde groups
Aromatic Region
Aliphatic Region
n6 5 4 3 2 1 0
f1(ppm)
Appl. Sci. 2019, 9, 1862 9 of 17
Figure 7. 1H NMR spectrum of commercial xylans.
DMSO-d6
Aliphatic CHO-C-CH2-O
SOLID II
H2O
Phenol groups
Aldehyde groups
Aromatic Region
Aliphatic Region
Methoxyl Region
10.0 9.5 9.0 8.5 8.0 7.5 7.0 6.5 6.0 5.5 5.0
10 9 8 7 6 5 4 3 2 1 0
f1(ppm)
Appl. Sci. 2019, 9, x FOR PEER REVIEW 10 of 19
Figure 8. 1 H NMR spectra of Solid II.
Figure 8. 1H NMR spectra of Solid II.
DMSO-d6
H2O
Lignin
Phenol groups
Aromatic Region
Aldehyde groups
Methoxyl Region
Aliphatic Region
10.0 9.5 9.0 8.5 8.0 7.5 7.0 6.5 6.0 5.5 5.0
10 9 8 7 6 5 4 3 2 1 0
f1(ppm)
Figure 9. 1 H NMR spectrum of commercial lignin.
3.4. X-ray Diffraction Figure 9. 1H NMR spectrum of commercial lignin.
X-ray diffraction was employed to analyze the crystallinity of the materials. XRD profiles of the
3.4. X-ray Diffraction
original barley straw and Solid I are depicted in Figure 10. The diffractogram of the original barley
strawX-ray diffraction
shows was employed
peaks typical to analyze
of the crystalline the crystallinity
structure of the
of cellulose materials.
[57,68]. XRD profiles
A prominent peakof 23◦
atthe
original barleytostraw
corresponds and reflection,
the (200) Solid I are and
depicted
a wideinpeak
Figure 10. 15–17
from ◦
The diffractogram
represents theof the original barley
combination of the
straw shows peaks
two reflections typical of the
corresponding crystalline
to (110) structure
and (110). of cellulose
The pattern [57,68].
of Solid A prominent
I, obtained peak at
after treating 23°
barley
corresponds to the (200) reflection, and a wide peak from 15–17° represents the combination of the
two reflections corresponding to (110) and (11 ̅0). The pattern of Solid I, obtained after treating barley
straw and selective precipitation, showed that the crystallinity was lost because these reflections were
not found; the only peak found was at 21°. In this sample, almost no diffraction peaks are observed,
indicating the nearly total disappearance of its crystallinity. This study indicates that the originalAppl. Sci. 2019, 9, 1862 10 of 17
straw and selective precipitation, showed that the crystallinity was lost because these reflections were
not found; the only peak found was at 21◦ . In this sample, almost no diffraction peaks are observed,
indicating the nearly total disappearance of its crystallinity. This study indicates that the original
barley straw has a certain crystallinity that is lost after [EMIMAcO] treatment. Other authors have also
reported
Appl. this
Sci. 2019, 9, behavior
x FOR PEERinREVIEW
different samples of lignocellulosic biomass and cellulose when the samples
11 of 19
were treated with ionic liquids [33,55].
Figure 10. X-ray diffraction (XRD) spectra of raw barley straw and Solid I.
Figure 10. X-ray diffraction (XRD) spectra of raw barley straw and Solid I.
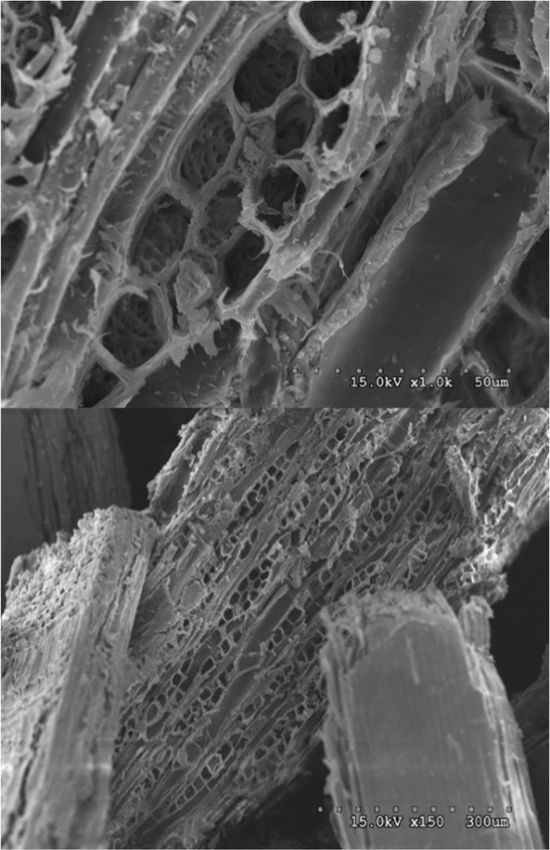
3.5. Scanning Electron Microscopy (SEM)
3.5. Scanning Electron
Solid I and raw Microscopy (SEM)
barley straw were analyzed by SEM. The micrographs show a large difference
between
Solidthe starting
I and sample
raw barley and were
straw the precipitated
analyzed by sample
SEM. The(Figure 11). The sample
micrographs show aoflarge
original barley
difference
straw (Figure 11) shows a regular structure typical of the vascularization of straw.
between the starting sample and the precipitated sample (Figure 11). The sample of original barley However, the Solid I
sample
straw (Figure
(Figure 11)11) lost apractically
shows all of its
regular structure vascular
typical structure.
of the In addition,
vascularization the However,
of straw. images with thehigher
Solid
magnification indicate that the treated sample was more porous than the original. These
I sample (Figure 11) lost practically all of its vascular structure. In addition, the images with higher morphological
changes are compatible
magnification indicate withthat thethestructural
treated changes
sample observed
was more in X-ray diffraction.
porous than the Theoriginal.
structureThese
of the
starting biomass
morphological was modified,
changes giving with
are compatible rise to a more
the amorphous
structural changesstructure,
observedwhich favors
in X-ray accessibility
diffraction. The
to the biomass components, making the material easier to transform. Destruction
structure of the starting biomass was modified, giving rise to a more amorphous structure, which of the structure of
lignocellulosic
favors biomass
accessibility to thehas been observed
biomass in previous
components, makingworks [47] by other
the material easierauthors [69] and
to transform. with other
Destruction
pretreatments
of the structure[70].
of lignocellulosic biomass has been observed in previous works [47] by other authors
[69] and with other pretreatments [70].Appl. Sci. 2019, 9, 1862 11 of 17
Appl. Sci. 2019, 9, x FOR PEER REVIEW 12 of 19
Figure
Figure 11. Scanning electron
11. Scanning electron microscopy
microscopy (SEM)
(SEM) images
images of
of raw
raw barley
barley straw
straw (left)
(left) and
and barley
barley straw
straw
treated with [EMIMAcO] (Solid I, WA 1:1) (right).
treated with [EMIMAcO] (Solid I, WA 1:1) (right).
3.6. Catalytic Activity
3.6. Catalytic Activity
Original barley straw, cellulose and Solid I were subjected to hydrolysis in water media at 140 ◦ C
Original barley straw, cellulose and Solid I were subjected to hydrolysis in water media at 140
with 0.2 mol/L H2 SO4 . In Table 3, a comparison of the conversion values obtained with Solid I, the
°C with 0.2 mol/L H2SO4. In Table 3, a comparison of the conversion values obtained with Solid I, the
original barley straw and Avicel cellulose without treatment are shown. The conversion values were
original barley straw and Avicel cellulose without treatment are shown. The conversion values were
calculated by the weight difference between the sample initially added to the reaction and the sample
calculated by the weight difference between the sample initially added to the reaction and the sample
obtained after reaction. The conversion values were different among the three samples studied; the
obtained after reaction. The conversion values were different among the three samples studied; the
lowest value was obtained for the cellulose sample, while the conversion values were higher for the
lowest value was obtained for the cellulose sample, while the conversion values were higher for the
other two samples. This trend is expected because the most complicated material to hydrolyze is
other two samples. This trend is expected because the most complicated material to hydrolyze is
cellulose, and samples of untreated barley straw only contain approximately 31% cellulose (Table 3).
cellulose, and samples of untreated barley straw only contain approximately 31% cellulose (Table 3).
In Solid I, impurities of lignin in the sample were not taken into account to avoid complicating the
In Solid I, impurities of lignin in the sample were not taken into account to avoid complicating the
calculations and reduce error since the amount of lignin in the sample was very small. The conversion
calculations and reduce error since the amount of lignin in the sample was very small. The conversion
of 90% in Solid I appears to be slightly high.
of 90% in Solid I appears to be slightly high.
Table 3. Results of conversion obtained after hydrolysis of untreated cellulose, untreated barley straw
Table 3. Results of conversion obtained after hydrolysis of untreated cellulose, untreated barley straw
and barley straw treated (Solid I) with [EMIMAcO]. Reaction conditions: H2 SO4 (0.2 mol/L), 140 ◦ C
and barley straw treated (Solid I) with [EMIMAcO]. Reaction conditions: H2SO4 (0.2 mol/L), 140 °C
and 5 h.
and 5 h.
Sample % Conversion
Sample % Conversion
Cellulose
Cellulose 25 25
Barley Straw 83
Barley
Solid IStraw 83 93
Solid I 93
However, the conversion data are not conclusive because the hydrolysis schemes of cellulose and
However, the conversion data are not conclusive because the hydrolysis schemes of cellulose
hemicellulose are complicated by consecutive reactions and can lead to the formation of humics and
and hemicellulose are complicated by consecutive reactions and can lead to the formation of humics
other products. For this reason, it is interesting to analyze the yields of the main products derived from
and other products. For this reason, it is interesting to analyze the yields of the main products derived
from glucans, glucose and levulinic acid, and the main products of xylans, xylose and furfural. ItAppl. Sci. 2019, 9, x FOR PEER REVIEW 13 of 19
should
Appl. Sci.be noted
2019, that under these reaction conditions and in aqueous media in the presence of an12acid,
9, 1862 of 17
the concentration of 5-hydroxymethylfurfural is very small because it easily transforms into levulinic
acid.
glucans, glucose
In Figure 12A,and
thelevulinic
yield ofacid, and decreases
glucose the main products of xylans,
in the following xylose
order: andIfurfural.
Solid > originalIt should
barley
straw > cellulose. Cellulose gave a very low yield of glucose (11%) after 5 h of reaction. Theacid,
be noted that under these reaction conditions and in aqueous media in the presence of an the
barley
concentration
straw sample gave of 5-hydroxymethylfurfural is very small
a higher yield of approximately 30%.because
However, it easily
with transforms into levulinic
the Solid I sample, a yieldacid.
of
In Figure 12A, the yield of glucose decreases in the following order: Solid
65% was reached, which substantially affects acid hydrolysis to sugars. These glucose yield values I > original barley
straw >
follow ancellulose. Cellulose
order inverse to thatgave a very crystallinity,
of sample low yield of glucose
as shown (11%) after 10.
in Figure 5 h This
of reaction. Thegreater
is because barley
straw sample
crystallinity gave ahinders
(order) higher yield of approximately
the breakdown of the 30%. However,
ß(1→4)- with the
D-glucosidic Solid
bonds ofIcellulose
sample, abecause
yield of
65% was reached, which substantially affects acid hydrolysis to sugars.
they are less accessible. However, treatment that reduces the crystallinity and increases These glucose yield values
the
follow an order
accessibility inverse
of said bonds tofavors
that ofhydrolysis,
sample crystallinity,
giving riseastoshown
higherinyields
Figure of10. This is
glucose because greater
[33,34,46,71].
crystallinity
The yield (order) hindersacid
of levulinic the follows
breakdown of thevery
a profile ß(1→4)-d-glucosidic
similar to that ofbonds
glucoseof cellulose because
(Figure 12B) they
because
are less accessible. However, treatment that reduces the crystallinity and increases
levulinic acid is a byproduct of glucose; therefore, at higher glucose concentrations, more levulinic the accessibility of
saidcan
acid bonds favors hydrolysis,
be formed, givingthe
but in all cases, rise to higher
yield yieldsacid
of levulinic of glucose [33,34,46,71].
is low with respect to that of glucose.
60 20
Solid I (WA 1:1) A Solid I (WA 1:1) B
Barley Straw Barley Straw
50 Cellulose Cellulose
15
Yield of Levulinic Acid (%)
40
Yield of Glucose (%)
30 10
20
5
10
0 0
0 60 120 180 240 300 0 60 120 180 240 300
Time (min) Time (min)
Figure 12. Yield of glucose (A) and levulinic acid (B) from the hydrolysis of cellulose, untreated barley
Figure 12. Yield of glucose (A) and levulinic acid (B) from the hydrolysis of cellulose, untreated barley
straw and barley straw treated (Solid I) with [EMIMAcO].
straw and barley straw treated (Solid I) with [EMIMAcO].
The yield of levulinic acid follows a profile very similar to that of glucose (Figure 12B) because
We compared
levulinic the raw barley
acid is a byproduct straw sample
of glucose; without
therefore, treatment
at higher glucose and Solid I in acidmore
concentrations, hydrolysis to
levulinic
obtain thebeconcentration
acid can formed, but in curves of the
all cases, thecompounds xyloseacid
yield of levulinic andisfurfural
low with (Figure
respect 13A,B) inof
to that both cases.
glucose.
The yield of xylose increased quickly with reaction time, reaching a maximum
We compared the raw barley straw sample without treatment and Solid I in acid hydrolysis in both cases (Figure
13A). At 2 the
to obtain h, the barley strawcurves
concentration obtained a yield
of the of 45%, and
compounds Solid
xylose I achieved
and furfural a(Figure
yield of 58%, but
13A,B) the
in both
yield
cases.ofThe
Solid I reached
yield a maximum
of xylose increasedofquickly
60% at with
3 h and then decreased
reaction until the
time, reaching end of theinreaction,
a maximum both casesat
which point the yield of xylose was 25% in barley straw and 35% in Solid I. This fact
(Figure 13A). At 2 h, the barley straw obtained a yield of 45%, and Solid I achieved a yield of 58%, but indicates that
the
thepretreated sample
yield of Solid (Solida I)
I reached can moreofeasily
maximum hydrolyze
60% at hemicellulose,
3 h and then obtaining
decreased until a higher
the end of the yield of
reaction,
xylose more quickly, although the differences are less evident than with glucose (Figure
at which point the yield of xylose was 25% in barley straw and 35% in Solid I. This fact indicates that 12A). This is
because hemicellulose (polymer of origin of xylose) is much easier to hydrolyze
the pretreated sample (Solid I) can more easily hydrolyze hemicellulose, obtaining a higher yield of than glucose and,
therefore,
xylose moreeven without
quickly, treatment,
although the hydrolysis
differences can
are be
lesseffectively performed.
evident than In addition,
with glucose (Figurepresenting
12A). This
behavior
is because hemicellulose (polymer of origin of xylose) is much easier to hydrolyze the
typical of an intermediate reaction compound in consecutive reactions, thansource
glucoseof and,
the
therefore, even without treatment, hydrolysis can be effectively performed. In addition, presenting
behavior typical of an intermediate reaction compound in consecutive reactions, the source of theAppl. Sci. 2019, 9, x FOR PEER REVIEW 14 of 19
Appl. Sci. 2019, 9, 1862 13 of 17
xylose is consumed when in contact with the acid catalyst in the medium; then, dehydration takes
place, and the material is transformed into furfural (Figure 13B).
xylose is The furfural yield
consumed whenprofiles indicate
in contact withthat theacid
the yieldcatalyst
increasesinwith
thereaction
medium; time, reaching,
then, 36% withtakes
dehydration
Solid I and 20% with untreated barley straw at 5 h. The Solid I sample had a higher concentration
place, and the material is transformed into furfural (Figure 13B).
because the xylose concentration was higher than in the untreated sample.
80 80
Solid I (WA 1:1) A Solid I (WA 1:1) B
Barley Straw Barley Straw
70 70
60 60
Yield of Furfural (%)
Yield of Xylose (%)
50 50
40 40
30 30
20 20
10 10
0 0
0 60 120 180 240 300 0 60 120 180 240 300
Time (min) Time (min)
Figure 13. Yields
Figure of xylose
13. Yields (A) and
of xylose (A)furfural (B) of barley
and furfural (B) of straw
barley treated and notand
straw treated treated
not with [EMIMAcO]
treated with
[EMIMAcO]
The furfural yield profiles indicate that the yield increases with reaction time, reaching, 36% with
Solid I and 20%hydrolysis
In the with untreated
process,barley straw at
the polymeric 5 h. of
chains The Solid and
cellulose I sample had a higher
hemicellulose becomeconcentration
smaller,
because
and the
somexylose concentration
of them become soluble was higher
in water;than in the untreated
therefore, sample.
the reaction medium not only contains
monomers such as process,
In the hydrolysis glucose orthe xylose but can chains
polymeric also contain oligomers
of cellulose and with several unitsbecome
hemicellulose that are soluble.
smaller, and
For this reason, we analyzed the final reaction samples and calculated the
some of them become soluble in water; therefore, the reaction medium not only contains monomers total reducing sugars (TRS)
content, including the sugars in monomeric and oligomeric forms. The obtained
such as glucose or xylose but can also contain oligomers with several units that are soluble. For results are shown in this
Table 4. The values of TRS are clearly higher than those obtained by the sum of sugars measured with
reason, we analyzed the final reaction samples and calculated the total reducing sugars (TRS) content,
HPLC (monomeric), which indicates that in the reaction medium, there is an appreciable amount of
including the sugars in monomeric and oligomeric forms. The obtained results are shown in Table 4.
oligomeric sugars; this discrepancy is more evident for straw samples (original and Solid I). The yield
The values
to sugarsof decreases
TRS are clearly
according higher
to thethan
orderthose
Solidobtained
I > originalbybarley
the sum
strawof>sugars
cellulose,measured with HPLC
which coincides
(monomeric), which indicates that in the reaction medium, there is an appreciable
with the conversion values described in Table 3. However, the selectivity of total reducing sugars amount of oligomeric
sugars;
doesthis
notdiscrepancy is more
follow this trend (Tableevident
4). It isfor straw
clear that thesamples (original
selectivity of TRS and Solidhigher
is much I). Theforyield to sugars
the Solid
decreases according
I sample than theto the order Solid
untreated samples I > oforiginal
cellulose barley barley>straw.
and straw cellulose,
The which coincides
combination with the
of high
conversion and high selectivity in the Solid I sample produced one of the
conversion values described in Table 3. However, the selectivity of total reducing sugars does nothighest sugar yields in acid
followcatalyzed
this trendhydrolysis
(Table of4).lignocellulosic
It is clear thatbiomass among those
the selectivity described
of TRS is much in the literature
higher for the[72–78].
Solid I sample
than the untreated samples of cellulose and barley straw. The combination of high conversion and high
Table 4. Total reducing sugars (TRS) measurements obtained from the samples after the hydrolysis
selectivity in the Solid I sample produced one of the highest sugar yields in acid catalyzed hydrolysis
reaction.
of lignocellulosic biomass among those described in the literature [72–78].
TRS % Yield of % Selectivity of Total Monomeric
Sample
(g/L) Sugars (TRS) Sugars (TRS) Sugars
Table 4. Total reducing sugars (TRS) measurements obtained from the samples after the (g/L) reaction.
hydrolysis
Cellulose 1.7 15 60 1.5
Barley Straw 2.9 % Yield
45 of Sugars % Selectivity
54 of Total 1.8
Monomeric
Sample TRS (g/L)
(TRS) Sugars (TRS) Sugars (g/L)
Cellulose 1.7 15 60 1.5
Barley Straw 2.9 45 54 1.8
Solid I (WA 1:1) 6.1 72 80 3.4Appl. Sci. 2019, 9, 1862 14 of 17
4. Conclusions
Dissolution of barley straw in [EMIMAcO] and subsequent precipitation with water:acetone
mixtures can be employed in the fragmentation of the main components. A water:acetone ratio of
1:1 is optimal for the efficient separation of carbohydrates with respect to lignin, with a high biomass
recovery efficiency of approximately 90% with respect to the initial sample. The first precipitate (Solid
I) is clearly enriched in carbohydrates (cellulose and hemicellulose), and the second precipitate is a
lignin-rich solid, as evidenced by IR and NMR. The enriched carbohydrate solid (Solid I) presented
large changes in structure (SEM) and crystallinity (XRD) with respect to those of the original barley
straw. This carbohydrate-rich fraction is easier to hydrolyze, with a yield of total reducing sugars that
is among the highest described in the literature.
Author Contributions: Experimental work: M.L.-S. and S.M.-d.; supervision: S.M.-d. and J.M.C.-M.;
writing—original draft preparation: M.L.-S. and S.M.-d.; writing—review and editing: J.M.C.-M. and J.L.G.F.
Funding: This research was funded by Comunidad de Madrid (Spain) and ERDF (European Regional
Development Fund), grant numbers S2013/MAE-2882 (RESTOENE-2-CM), S2018/EMT-4344 (BIOTRES-CM)
and CSIC (201880E029). M.L.-S. acknowledges the support of the European Social Fund and Community of
Madrid for her contract.
Conflicts of Interest: The authors declare no conflict of interest.
References
1. Scarlat, N.; Dallemand, J.F.; Monforti-Ferrario, F.; Nita, V. The role of biomass and bioenergy in a future
bioeconomy: Policies and facts. Environ. Dev. 2015, 15, 3–34. [CrossRef]
2. Pickett, J. Sustainable Biofuels: Prospects and Challenge; The Royal Society: London, UK, 2018.
3. Scheller, H.V.; Ulvskov, P. Hemicelluloses. Annu. Rev. Plant Biol. 2010, 61, 263–289. [CrossRef] [PubMed]
4. Rubin, E.M. Genomics of cellulosic biofuels. Nature 2008, 454, 841–845. [CrossRef]
5. Karimi, K.; Taherzadeh, M.J. A critical review of analytical methods in pretreatment of lignocelluloses:
Composition, imaging, and crystallinity. Bioresour. Technol. 2016, 200, 1008–1018. [CrossRef] [PubMed]
6. O’Sullivan, A.C. Cellulose: The structure slowly unravels. Cellulose 1997, 4, 173–207. [CrossRef]
7. Sharples, A. The hydrolysis of cellulose and its relation to structure. Part 2. Trans. Faraday Soc. 1958, 54,
913–917. [CrossRef]
8. Sharples, A. The hydrolysis of cellulose and its relation to structure. Trans. Faraday Soc. 1957, 53, 1003–1013.
[CrossRef]
9. Pérez, J.; Muñoz-Dorado, J.; Rubia, T.D.L.; Martı´nez, J. Biodegradation and biological treatments of cellulose,
hemicellulose and lignin: An overview. Int. Microbiol. 2002, 5, 53–63. [CrossRef]
10. Alvira, P.; Tomas-Pejo, E.; Ballesteros, M.; Negro, M.J. Pretreatment technologies for an efficient bioethanol
production process based on enzymatic hydrolysis: A review. Bioresour. Technol. 2010, 101, 4851–4861.
[CrossRef]
11. Zakzeski, J.; Bruijnincx, P.C.A.; Jongerius, A.L.; Weckhuysen, B.M. The Catalytic Valorization of Lignin for
the Production of Renewable Chemicals. Chem. Rev. 2010, 110, 3552–3599. [CrossRef]
12. Mosier, N.; Wyman, C.; Dale, B.; Elander, R.; Lee, Y.Y.; Holtzapple, M.; Ladisch, M. Features of promising
technologies for pretreatment of lignocellulosic biomass. Bioresour. Technol. 2005, 96, 673–686. [CrossRef]
13. Hendriks, A.T.W.M.; Zeeman, G. Pretreatments to enhance the digestibility of lignocellulosic biomass.
Bioresour. Technol. 2009, 100, 10–18. [CrossRef]
14. Yi, Z.; Pan, Z.P.; Zhang, R.H. Overview of biomass pretreatment for cellulosic ethanol production. Int. J.
Agric. Biol. Eng. 2009, 2, 51–68.
15. FitzPatrick, M.; Champagne, P.; Cunningham, M.F.; Whitney, R.A. A biorefinery processing perspective:
Treatment of lignocellulosic materials for the production of value-added products. Bioresour. Technol. 2010,
101, 8915–8922. [CrossRef]
16. Karimi, K.; Taherzadeh, M.J. A critical review on analysis in pretreatment of lignocelluloses: Degree of
polymerization, adsorption/desorption, and accessibility. Bioresour. Technol. 2016, 203, 348–356. [CrossRef]Appl. Sci. 2019, 9, 1862 15 of 17
17. Oliva, J.; Negro, M.; Manzanares, P.; Ballesteros, I.; Chamorro, M.; Sáez, F.; Ballesteros, M.; Moreno, A. A
Sequential Steam Explosion and Reactive Extrusion Pretreatment for Lignocellulosic Biomass Conversion
within a Fermentation-Based Biorefinery Perspective. Fermentation 2017, 3, 15. [CrossRef]
18. Sipponen, M.H.; Pihlajaniemi, V.; Pastinen, O.; Laakso, S. Reduction of surface area of lignin improves
enzymatic hydrolysis of cellulose from hydrothermally pretreated wheat straw. RSC Adv. 2014, 4, 36591–36596.
[CrossRef]
19. Pihlajaniemi, V.; Sipponen, M.H.; Liimatainen, H.; Sirvio, J.A.; Nyyssola, A.; Laakso, S. Weighing the factors
behind enzymatic hydrolyzability of pretreated lignocellulose. Green Chem. 2016, 18, 1295–1305. [CrossRef]
20. Xu, H.; Li, B.; Mu, X. Review of Alkali-Based Pretreatment to Enhance Enzymatic Saccharification for
Lignocellulosic Biomass Conversion. Ind. Eng. Chem. Res. 2016, 55, 8691–8705. [CrossRef]
21. Kim, S.; Dale, B.E. Global potential bioethanol production from wasted crops and crop residues. Biomass
Bioenergy 2004, 26, 361–375. [CrossRef]
22. Gupta, A.; Verma, J.P. Sustainable bio-ethanol production from agro-residues: A review. Renew. Sustain.
Energy Rev. 2015, 41, 550–567. [CrossRef]
23. Searle, S.; Malins, C. Availability of Cellulosic Residues and Wastes in the EU; The International Council on Clean
Transportation (ICCT): Washington, DC, USA, 2013.
24. Kilpeläinen, I.; Xie, H.; King, A.; Granstrom, M.; Heikkinen, S.; Argyropoulos, D.S. Dissolution of Wood in
Ionic Liquids. J. Agric. Food. Chem. 2007, 55, 9142–9148. [CrossRef]
25. Kosan, B.; Michels, C.; Meister, F. Dissolution and forming of cellulose with ionic liquids. Cellulose 2007, 15,
59–66. [CrossRef]
26. Zakrzewska, M.E.; Bogel-Łukasik, E.; Bogel-Łukasik, R. Solubility of Carbohydrates in Ionic Liquids. Energy
Fuels 2010, 24, 737–745. [CrossRef]
27. Mora-Pale, M.; Meli, L.; Doherty, T.V.; Linhardt, R.J.; Dordick, J.S. Room temperature ionic liquids as emerging
solvents for the pretreatment of lignocellulosic biomass. Biotechnol. Bioeng. 2011, 108, 1229–1245. [CrossRef]
[PubMed]
28. Muhammad, N.; Man, Z.; Bustam Khalil, M.A. Ionic liquid-a future solvent for the enhanced uses of wood
biomass. Eur. J. Wood Wood Prod. 2011, 70, 1–9. [CrossRef]
29. Tadesse, H.; Luque, R. Advances on biomass pretreatment using ionic liquids: An overview. Energy Environ.
Sci. 2011, 4, 3913–3929. [CrossRef]
30. Wang, H.; Gurau, G.; Rogers, R.D. Ionic liquid processing of cellulose. Chem. Soc. Rev. 2012, 41, 1519–1537.
[CrossRef]
31. Minnick, D.L.; Flores, R.A.; DeStefano, M.R.; Scurto, A.M. Cellulose Solubility in Ionic Liquid Mixtures:
Temperature, Cosolvent, and Antisolvent Effects. J. Phys. Chem. B 2016, 120, 7906–7919. [CrossRef]
32. Xu, J.; Liu, B.; Hou, H.; Hu, J. Pretreatment of eucalyptus with recycled ionic liquids for low-cost biorefinery.
Bioresour. Technol. 2017, 234, 406–414. [CrossRef]
33. Morales-delaRosa, S.; Campos-Martin, J.M.; Fierro, J.L.G. Complete Chemical Hydrolysis of Cellulose into
Fermentable Sugars through Ionic Liquids and Antisolvent Pretreatments. ChemSusChem 2014, 7, 3467–3475.
[CrossRef]
34. Morales-delaRosa, S.; Campos-Martin, J.M.; Fierro, J.L.G. Chemical hydrolysis of cellulose into fermentable
sugars through ionic liquids and antisolvent pretreatments using heterogeneous catalysts. Catal. Today 2018,
302, 87–93. [CrossRef]
35. Lan, W.; Liu, C.F.; Sun, R.C. Fractionation of bagasse into cellulose, hemicelluloses, and lignin with ionic
liquid treatment followed by alkaline extraction. J. Agric. Food Chem. 2011, 59, 8691–8701. [CrossRef]
36. Da Costa Lopes, A.M.; João, K.G.; Rubik, D.F.; Bogel-Łukasik, E.; Duarte, L.C.; Andreaus, J.; Bogel-Łukasik, R.
Pre-treatment of lignocellulosic biomass using ionic liquids: Wheat straw fractionation. Bioresour. Technol.
2013, 142, 198–208. [CrossRef]
37. Yang, D.; Zhong, L.-X.; Yuan, T.-Q.; Peng, X.-W.; Sun, R.-C. Studies on the structural characterization of
lignin, hemicelluloses and cellulose fractionated by ionic liquid followed by alkaline extraction from bamboo.
Ind. Crops Prod. 2013, 43, 141–149. [CrossRef]
38. Yang, X.; Wang, Q.; Yu, H. Dissolution and regeneration of biopolymers in ionic liquids. Russ. Chem. Bull.
2014, 63, 555–559. [CrossRef]
39. Zhang, P.; Dong, S.J.; Ma, H.H.; Zhang, B.X.; Wang, Y.F.; Hu, X.M. Fractionation of corn stover into cellulose,
hemicellulose and lignin using a series of ionic liquids. Ind. Crops Prod. 2015, 76, 688–696. [CrossRef]Appl. Sci. 2019, 9, 1862 16 of 17
40. Morais, A.R.C.; Pinto, J.V.; Nunes, D.; Roseiro, L.B.; Oliveira, M.C.; Fortunato, E.; Bogel-Łukasik, R. Imidazole:
Prospect Solvent for Lignocellulosic Biomass Fractionation and Delignification. ACS Sustain. Chem. Eng.
2016, 4, 1643–1652. [CrossRef]
41. Mohtar, S.S.; Tengku Malim Busu, T.N.; Md Noor, A.M.; Shaari, N.; Mat, H. An ionic liquid treatment and
fractionation of cellulose, hemicellulose and lignin from oil palm empty fruit bunch. Carbohydr. Polym. 2017,
166, 291–299. [CrossRef]
42. Sathitsuksanoh, N.; George, A.; Zhang, Y.H.P. New lignocellulose pretreatments using cellulose solvents: A
review. J. Chem. Technol. Biotechnol. 2013, 88, 169–180. [CrossRef]
43. Zhu, S.; Wu, Y.; Chen, Q.; Yu, Z.; Wang, C.; Jin, S.; Ding, Y.; Wu, G. Dissolution of cellulose with ionic liquids
and its application: A mini-review. Green Chem. 2006, 8, 325–327. [CrossRef]
44. Haghighi Mood, S.; Hossein Golfeshan, A.; Tabatabaei, M.; Salehi Jouzani, G.; Najafi, G.H.; Gholami, M.;
Ardjmand, M. Lignocellulosic biomass to bioethanol, a comprehensive review with a focus on pretreatment.
Renew. Sustain. Energy Rev. 2013, 27, 77–93. [CrossRef]
45. Brodeur, G.; Yau, E.; Badal, K.; Collier, J.; Ramachandran, K.B.; Ramakrishnan, S. Chemical and
physicochemical pretreatment of lignocellulosic biomass: A review. Enzym. Res. 2011, 2011. [CrossRef]
46. Morales-delaRosa, S.; Campos-Martin, J.M.; Fierro, J.L.G. High glucose yields from the hydrolysis of cellulose
dissolved in ionic liquids. Chem. Eng. J. 2012, 181, 538–541. [CrossRef]
47. Lara-Serrano, M.; Sáez Angulo, F.; Negro, M.J.; Morales-delaRosa, S.; Campos-Martin, J.M.; Fierro, J.L.G.
Second-Generation Bioethanol Production Combining Simultaneous Fermentation and Saccharification of
IL-Pretreated Barley Straw. ACS Sustain. Chem. Eng. 2018, 6, 7086–7095. [CrossRef]
48. Fort, D.A.; Remsing, R.C.; Swatloski, R.P.; Moyna, P.; Moyna, G.; Rogers, R.D. Can ionic liquids dissolve
wood? Processing and analysis of lignocellulosic materials with 1-n-butyl-3-methylimidazolium chloride.
Green Chem. 2007, 9, 63–69. [CrossRef]
49. Huddleston, J.G.; Visser, A.E.; Reichert, W.M.; Willauer, H.D.; Broker, G.A.; Rogers, R.D. Characterization and
comparison of hydrophilic and hydrophobic room temperature ionic liquids incorporating the imidazolium
cation. Green Chem. 2001, 3, 156–164. [CrossRef]
50. Sun, N.; Rahman, M.; Qin, Y.; Maxim, M.L.; Rodríguez, H.; Rogers, R.D. Complete dissolution and partial
delignification of wood in the ionic liquid 1-ethyl-3-methylimidazolium acetate. Green Chem. 2009, 11,
646–655. [CrossRef]
51. Sun, N.; Rodriguez, H.; Rahman, M.; Rogers, R.D. Where are ionic liquid strategies most suited in the pursuit
of chemicals and energy from lignocellulosic biomass? Chem. Commun. 2011, 47, 1405–1421. [CrossRef]
52. Swatloski, R.P.; Spear, S.K.; Holbrey, J.D.; Rogers, R.D. Dissolution of Cellose with Ionic Liquids. J. Am. Chem.
Soc. 2002, 124, 4974–4975. [CrossRef]
53. Sheldon, R.A. Green and sustainable manufacture of chemicals from biomass: State of the art. Green Chem.
2014, 16, 950–963. [CrossRef]
54. Prasad, K.; Sharma, M. Green solvents for the dissolution and processing of biopolymers. Curr. Opin. Green
Sustain. Chem. 2019, 18, 72–78. [CrossRef]
55. Wang, H.; Gurau, G.; Pingali, S.V.; O’Neill, H.M.; Evans, B.R.; Urban, V.S.; Heller, W.T.; Rogers, R.D. Physical
Insight into Switchgrass Dissolution in Ionic Liquid 1-Ethyl-3-methylimidazolium Acetate. ACS Sustain.
Chem. Eng. 2014, 2, 1264–1269. [CrossRef]
56. NREL. N.R.E.L. Biomass Compositional Analysis Laboratory Procedures. Available online: https://www.
nrel.gov/bioenergy/biomass-compositional-analysis.html (accessed on 1 March 2019).
57. Morales-delaRosa, S.; Campos-Martin, J.M.; Fierro, J.L.G. Optimization of the process of chemical hydrolysis
of cellulose to glucose. Cellulose 2014, 21, 2397–2407. [CrossRef]
58. Morales-delaRosa, S.; García Fierro, J.L.; Campos-Martín, J.M. Method for the Hydrolysis of Lignocellulosic
Biomass. Patent WO2015/004296, 15 January 2015.
59. Capel-Sanchez, M.C.; Barrio, L.; Campos-Martin, J.M.; Fierro, J.L.G. Silylation and surface properties of
chemically grafted hydrophobic silica. J. Colloid Interface Sci. 2004, 277, 146–153. [CrossRef]
60. Pandey, K.K.; Pitman, A.J. FTIR studies of the changes in wood chemistry following decay by brown-rot and
white-rot fungi. Int. Biodeterior. Biodegrad. 2003, 52, 151–160. [CrossRef]
61. Hergert, H.L. Infrared Spectra of Lignin and Related Compounds. II. Conifer Lignin and Model
Compounds1,2. J. Org. Chem. 1960, 25, 405–413. [CrossRef]You can also read