Inorganic Nitrogen Addition Affects Soil Respiration and Belowground Organic Carbon Fraction for a Pinus tabuliformis Forest - MDPI
←
→
Page content transcription
If your browser does not render page correctly, please read the page content below
Article
Inorganic Nitrogen Addition Affects Soil Respiration
and Belowground Organic Carbon Fraction for a
Pinus tabuliformis Forest
Huan Zhang 1 , Yanhong Liu 1, *, Zhiyong Zhou 1 and Yueying Zhang 2
 1    Key Laboratory for Forest Resources & Ecosystem Processes of Beijing, Beijing Forestry University,
      Beijing 100083, China; 18813178166@163.com (H.Z.); zhiyong@bjfu.edu.cn (Z.Z.)
 2    Academy of Inventory and Planning, National Forestry and Grassland Administration,
      Beijing 100714, China; 17610072901@163.com
 *    Correspondence: liuyh@bjfu.edu.cn; Tel.: +86-136-5135-0071

 Received: 4 March 2019; Accepted: 25 April 2019; Published: 28 April 2019

 Abstract: The capability of forest ecosystems to sequester carbon from the atmosphere largely
 depends on the interaction of soil organic matter and nitrogen, and thus, this process will be
 greatly influenced by nitrogen deposition under the future scenario of global change. To clarify
 this interaction, the current study explored the variations in soil carbon fraction and soil respiration
 with different levels of nitrogen deposition. NH4 NO3 was added at concentrations of 0, 50, 100, 200,
 and 400 kg N ha−1 year−1 separately on twenty 100 m2 plots in a Pinus tabuliformis Carr forest in
 northern China. Soil samples were analyzed for their nutrient content and biophysical properties two
 years after nitrogen application, and the soil respiration rate was measured every month during the
 study period. Seasonal variation and nitrogen addition significantly affected soil respiration rate.
 On average, nitrogen addition significantly reduced the annual soil respiration rate by 23.74%. Fine
 root biomass significantly decreased by an average of 43.55% in nitrogen treatment plots compared to
 the control plot. However, the average proportions of autumn and winter soil respiration rates out of
 the annual cumulative soil respiration rate greatly increased from 23.57% and 11.04% to 25.90% and
 12.18%, respectively. The soil microbial biomass carbon content in the control plot was 342.39 mg kg−1 ,
 23.50% higher than the average value in nitrogen treatment plots. The soil dissolved organic carbon
 was reduced by 22.60%, on average, following nitrogen addition. Significant correlations were
 detected between fine root biomass and the annual cumulative soil respiration rate, soil microbial
 biomass carbon content, and soil dissolved organic carbon content. This demonstrates that nitrogen
 addition affects soil organic carbon transformation and carbon emission, mainly by depressing fine
 root production.

 Keywords: nitrogen addition; soil respiration; organic carbon fraction; fine root biomass

1. Introduction
      The intensified nitrogen deposition associated with dramatically increased fossil fuel combustion and
the overuse of nitrogen fertilizer is an important component of global change [1,2]. Atmospheric nitrogen
deposition has increased by three to five times over the past century [3], and the annual rate of nitrogen
deposition in China increased from 9.43 kg ha−1 year−1 in 1980 to 21.76 kg ha−1 year−1 in 2010 [4], a rate
that is much higher than the natural biological nitrogen fixation rate of 7.91 kg ha−1 year−1 [1].The negative
effect of surplus nitrogen input into terrestrial ecosystems has received much research attention in recent
decades [2,4–6]. However, the future effects of nitrogen input on belowground carbon transformation in
temperate forests in northern China are still unknown.

Forests 2019, 10, 369; doi:10.3390/f10050369                                        www.mdpi.com/journal/forests
Forests 2019, 10, 369 2 of 15
Soil respiration results from a complex process of soil organic carbon mineralization, soil microbial
activity, root exudation, and root autotrophic metabolism [6,7]. It represents the primary pathway
for regulating carbon emissions from the soil carbon pool to the atmosphere, with a global flux
rate of 50–98 Pg C year−1 [7–9]. In temperate forests, about 50% of carbon emissions result from
the decomposition of different kinds of soil organic matter by the soil microbial community [10,11].
The easy accessibility of soil organic carbon by soil microorganisms has been proposed to trigger
the fast carbon cycling process [12,13]. Normally, the soil organic carbon pool is partitioned into
recalcitrant organic carbon and labile organic carbon [14]. Labile organic carbon mainly comprises soil
microbial biomass carbon (MBC), dissolved organic carbon (SDOC), and readily oxidative organic
carbon (ROC) [15,16]. The transformation dynamics of these carbon fractions not only determine the
magnitude of soil carbon storage but also influence the role of the forest ecosystem in coping with future
climate change. The root system is the interactive bridge connecting the aboveground part of a plant
with the soil [6]. The production and exudate of forest root systems are the major sources of support
for soil microbial metabolism, and they regulate soil organic carbon mineralization [17–19]. So far,
anthropogenic nitrogen input has changed much of the belowground process, including the availability
of labile organic carbon [20,21], soil microbial activity [22,23], and the allocation of photosynthetic
production to root systems [17,24]. The annual cumulative soil respiration rate (RA ) has been reduced
by 17% from nitrogen input in temperate forests [6], but the explicit contributor for this large reduction
is still a controversial issue. Thus, researchers should pay much more attention to answering the
following question: How will fine root production and the soil carbon fraction respond to future
increased anthropogenic nitrogen input in temperate forests?
It has been proposed that temperate forest ecosystems in the median-to-high latitudinal areas
of the northern hemisphere will be threatened by higher nitrogen input from the atmosphere under
the scenario of future global change [4,6], but related studies on the precise biogeochemical cycle
by which this will occur are constrained by the uncertainties in the responses of soil respiration
and the soil carbon fraction to nitrogen deposition. Pinus tabuliformis Carr is an endemic Chinese
temperate coniferous forest tree that is distributed in 16 provinces with a total forest cover area of
2.28 × 10⁶ ha [25]. A simulated atmospheric nitrogen deposition experiment was conducted by adding
NH4 NO3 in a Pinus tabuliformis forest in northern China. One of the objectives of the current study was
to quantify variation in the magnitude of soil respiration and the belowground organic carbon fraction
in response to nitrogen input in Pinus tabuliformis forests. The second objective was to clarify which
belowground processes drive the abovementioned effects of the deposited nitrogen. Five different
rates of inorganic nitrogen were applied to twenty plots in a Pinus tabuliformis forest in northern China,
and the responses of soil respiration rate, soil carbon fraction, and fine root biomass were monitored.
We hypothesized that soil respiration would be affected by inorganic nitrogen addition, mainly through
changes in fine root production and labile organic carbon.
2. Materials and Methods
2.1. Site Description and Experimental Design
This study was carried out at the Taiyueshan Long-Term Forest Ecosystem Research Station
(36◦ 040 N, 112◦ 060 E; 1450 m a.s.l.), which is located 190 km southwest of Taiyuan in the Shanxi Province
of China. The study area is located in the continental monsoon climate zone and has a mean annual
precipitation of about 600 mm and a mean annual air temperature of about 11 ◦ C. The soil type is
categorized as eutric cambisols (FAO classification) or cinnamon soil (Chinese classification), with
a mean depth between 30 and 50 cm. The dominant tree species in the forest are Pinus tabuliformis
Carr, Quercus wutaishanica Mayr, and Larix gmelinii var. principis-rupprechtii Mayr. The understory
layer mainly consists of Rosa xanthine Lindl, Corylus mandshurica Maxim, Corylus heterophylla Fisch,
Lespedeza bicolor Turcz, Carex lanceolata Boott, Spodiopogon sibiricus Trin, and Thalictrum petaloideum Linn.Forests 2019, 10, 369 3 of 15
Forests 2019, 10, x FOR PEER REVIEW 3 of 15
An
An80-year-old
80-year-old Pinus tabuliformis
Pinus tabuliformisCarrCarr
forestforest
on theon hillside of a north-facing
the hillside slope 5 kmslope
of a north-facing northwest
5 km
of the research station was selected for the inorganic nitrogen addition
northwest of the research station was selected for the inorganic nitrogen addition experiment. experiment. Nitrogen in the
form of NH
Nitrogen in4 NO was mixed
the 3form of NH4withNO3 10waskgmixed
of localwith
surface
10 kg soilofparticles
local surfaceand evenly scattered
soil particles andover the
evenly
forest floor of 100 m 2 plots in early spring 2015 and 2016. Taking the background atmospheric nitrogen
scattered over the forest floor of 100 m plots in early spring 2015 and 2016. Taking the background
2
deposition
atmospheric in nitrogen
northern deposition
China and the large amount
in northern Chinaofandfossil
thefuel
largeproduction
amount of in fossil
Shanxi province
fuel into
production
consideration
in Shanxi province[4,26–28],
intoinorganic nitrogen
consideration was added
[4,26–28], at five
inorganic levels, was
nitrogen i.e., 0added
(N0), at
50 five
(N5),levels,
100 (N10),
i.e., 0
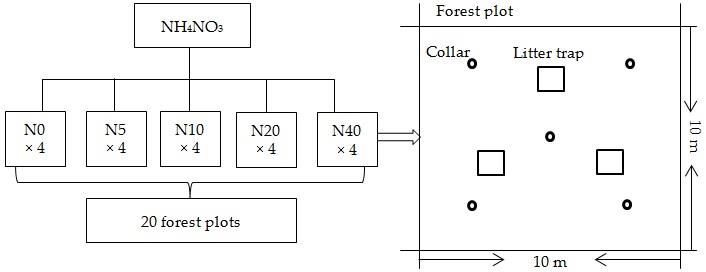
200 (N20), and 400 (N40) kg N ha −1 year−1 . Each addition level had four replicates and their spatial
(N0), 50 (N5), 100 (N10), 200 (N20), and 400 (N40) kg N ha year . Each addition level had four
-1 -1
distribution
replicates and is shown in Figure
their spatial 1. This isnitrogen
distribution shown in gradient
Figure was based
1. This on thegradient
nitrogen annual was
increase
basedrate
on
(0.42 −1 year−1 ) [4] to represent future
kg N haincrease levels
−1) of
the annual rate (0.42 kg N ha−1 year [4]anthropogenic
to represent atmospheric
future levelsnitrogen deposition
of anthropogenic
over the next 300–500
atmospheric nitrogenyears. Adjacent
deposition overplots
the were
next separated by a buffer
300–500 years. Adjacent stripplots
of 10 were
m in width to avoid
separated by a
cross-contamination
buffer strip of 10 m in ofwidth
neighboring
to avoidplots. Base characteristics
cross-contamination of the soil and
of neighboring plots.plants are shown in
Base characteristics
Table
of the1.soil
The andforest community
plants are shown had an overstory
in Table heightcommunity
1. The forest of 17.50 m,had andan theoverstory
maximum diameter
height at
of 17.50
breast height (DBH) of the trees within the 20 forest plots was 36.2 cm.
m, and the maximum diameter at breast height (DBH) of the trees within the 20 forest plots was
36.2 cm.
Figure1.1.The
Figure Theexperimental
experimentaldesign
designat
atthe
thestudy
studysite.
site.
Table1.1.Basic
Table Basiccharacteristics of forest
characteristics soil and
of forest soilplants in different
and plants treatment
in different plots before
treatment nitrogen
plots beforeaddition.
nitrogen
addition. SOC (g kg−1 )
Treatment TN (g kg−1 ) SBD (g cm−3 ) pH PD (stem ha−1 ) DBH (cm)
Treatment
N0 SOC(g
22.53 ± kg -1)
2.30 a TN(g kg-1a) SBD
1.47 ± 0.20 1.23 ±(g
0.03cma -3)6.01 ± 0.23
pH a ± 119 aha-1)19.39
PD(stem
1650 DBH(cm)
± 0.52 a
N0N5 21.19±±2.30
22.53 3.51aa 1.47 ±± 0.16
1.47 0.20 aa 1.32 ±±
1.23 0.03 a a 6.39
0.03 ± 0.25
6.01 a a 2250
± 0.23 ± 348
1650 a a 17.41
± 119 ± 0.75
19.39 a a
± 0.52
N10
N5 20.10 ± 2.87
21.19 ± 3.51 a a 1.38 ± 0.12
1.47 ± 0.16 aa 1.22 ± 0.03 a
1.32 ± 0.03 a 6.14 ± 0.05 a
6.39 ± 0.25 a 1950 ± 284 a
2250 ± 348 a 18.22 ± 1.48 a a
17.41 ± 0.75
N20 19.68 ± 1.19 a 1.40 ± 0.10 a 1.23 ± 0.02 a 6.38 ± 0.30 a 2000 ± 245 a 18.96 ± 1.41 a
N10 20.10 ± 2.87 a 1.38 ± 0.12 a 1.22 ± 0.03 a 6.14 ± 0.05 a 1950 ± 284 a 18.22 ± 1.48 a
N40 20.75 ± 1.17 a 1.45 ± 0.24 a 1.32 ± 0.02 a 6.93 ± 0.42 a 2000 ± 108 a 18.10 ± 0.92 a
N20 19.68 ± 1.19 a 1.40 ± 0.10 a 1.23 ± 0.02 a 6.38 ± 0.30 a 2000 ± 245 a 18.96 ± 1.41 a
SOC, TN, SBD, PD, and DBH denote soil organic carbon, soil total nitrogen, soil bulk density, plant density, and
N40 20.75 ± 1.17 a 1.45 ± 0.24 a 1.32 ± 0.02 a 6.93 ± 0.42 a 2000 ± 108 a 18.10 ± 0.92 a
plant diameter at breast height, respectively. Different lowercase letters in the same row represent a significant
SOC, TN,
difference < 0.05,PD,
(p SBD, n = and DBHthe
4) among denote soil organic
five nitrogen carbon,
addition rates. soil total nitrogen, soil bulk density, plant
density, and plant diameter at breast height, respectively. Different lowercase letters in the same
2.2. Soil
rowRespiration
represent aMeasurements
significant difference (p < 0.05, n = 4) among the five nitrogen addition rates.
The soil instantaneous respiration rate (Ri) was measured monthly using a LI-8100 Automated Soil
2.2. Soil Respiration Measurements
CO2 Flux System (LI-COR Inc., Lincoln, NE, USA) from April 2016 to May 2017. Five polyvinyl chloride
(PVC)The soil were
collars instantaneous respiration
systematically rateon
installed (Ri)
eachwas measured
plot, with onemonthly
collar atusing a LI-8100
the middle Automated
point and the
Soil CO
other 2 Flux
four System
in the (LI-COR
direction of theInc.,
fourLincoln,
cornersNE, USA)1).from
(Figure April
Living 2016inside
plants to Maythe 2017.
PVCFive polyvinyl
collars were
chlorideat (PVC)
clipped collars
the ground were one
surface systematically
week beforeinstalled on each plot,
each measurement. with one collar
Concurrently, the soilattemperature
the middle
point
at and of
a depth the10other four in
cm close to the
eachdirection of the
soil collar wasfour corners(Figure
monitored 1). Living plants
using a thermocouple inside
probe the PVC
attached to
collars were clipped at the ground surface one week before each measurement.
the LI-8100 system. Soil temperature was measured hourly and automatically logged during the Concurrently, the
soil temperature
period from 1 Juneat2016 a depth
to 31 of
May10 2017
cm close
by a to each soil collar
temperature was(HOBO
monitor monitored using
U22-001, a thermocouple
Onset, MA, USA)
probe
at attached
a depth of 10 cmto the LI-8100
in each forestsystem. Soilaverage
plot. The temperature was measured
soil respiration hourly
rate and and automatically
soil temperature were
logged during the period from 1
calculated from the five collars in each plot. June 2016 to 31 May 2017 by a temperature monitor (HOBO
U22-001,
BasalOnset, USA) at
parameters of asoil
depth of 10 cm were
respiration in each forest plot.
estimated Thethe
using average soil respiration
empirical correlationrate and
of the
soil temperature
instantaneous ratewere calculated
of soil from with
respiration the five
soilcollars in each plot.
temperature. The measured soil respiration rate
Basal
and soil parameters
temperature dataof were
soil respiration were estimated
fitted to Equation (1) [29]. Theusing theand
annual empirical
seasonal correlation
cumulative ofsoil
the
instantaneous rate of soil respiration with soil temperature. The measured soil respiration rate and
soil temperature data were fitted to Equation (1) [29]. The annual and seasonal cumulative soilForests 2019, 10, 369 4 of 15
respiration rates were calculated using the basal parameters and the hourly measured soil temperature
according to Equation (2) [30]:
Ri = R10 × Q10 (Ti − 10)/10, (1)
RA = Ri × 3600 × 12 × 10−6 = R10 × Q10 (Ti − 10)/10 × 3600 × 12 × 10−6 ,
P P
(2)
where Ri is the instantaneous rate of soil respiration (µmol CO2 m−2 s−1 ), R10 is the basal rate of
soil respiration at 10 ◦ C, Q10 is the temperature sensitivity of soil respiration, which represents the
change in soil respiration rate with every 10 ◦ C increase in temperature, Ti is the hourly measured
soil temperature (◦ C) at a depth of 10 cm, and RA refers to the annual cumulative soil respiration rate
(g C m−2 year−1 ). Relevant abbreviations of soil respiration variables were shown in Table 2.
Table 2. List of abbreviations.
RA Annual cumulative soil respiration rate ROC Soil readily oxidizable organic carbon
RS Seasonal cumulative soil respiration rate HEOC Hot-water-extractable organic carbon
Ri The instantaneous soil respiration rate MBC Soil microbial biomass carbon
Rai Annual average instantaneous soil respiration rate SDOC Soil dissolved organic carbon
R0 Soil respiration rate at 0 ◦ C TN Soil total nitrogen
R10 Basal soil respiration rate at 10 ◦ C MBN Soil microbial biomass nitrogen
Q10 Temperature sensitivity of soil respiration SDON Soil dissolved nitrogen
SOC Soil organic carbon HEON Hot-water-extractable nitrogen
2.3. Fine Root, Litter, and Soil Sampling
Fine roots (diameter < 2 mm) were sampled in August 2016 using an auger of 10 cm in diameter
and 10 cm in height (each area being 78.54 cm2 ), with four replicates randomly taken from each plot [31].
The sampled roots were washed with a 0.5 mm sieve, manually picked up, and then oven-dried at
60 ◦ C to a constant mass and weighed. The fine root biomass average was calculated from four soil
cores for each plot. The foliage was regularly collected every three months by litter traps of 1 m2 , with
three traps set in each forest plot. The average annual leaf litter input was calculated from the annual
cumulative leaf litter input of three samples. The root and fresh leaf litter samples were separately
and mechanically ground by a ball milling machine before chemical analysis. Five soil samples were
taken using a cylinder soil auger of 4.5 cm in diameter and 10 cm in height from each plot, and each
sample was separated into two portions. One subsample was air-dried after the manual removal of any
visible litter and debris and then ground to pass through a 0.149 mm sieve screen for chemical analysis.
Another subsample was transported in an ice box to the laboratory of Beijing Forestry University to
analyze the soil microbial biomass.
2.4. Chemical Analysis
Soil organic carbon content was measured using the wet combustion method via dichromate
oxidation and the titration of ferrous ammonium sulfate [32]. Soil, fine root and leaf litter nitrogen
contents were analyzed using the Kjeldahl digestion procedure [33]. Readily oxidizable organic
carbon (ROC) was determined by oxidation of the soil sample with KMnO4 [34,35]. Soil microbial
biomass C (MBC) was measured using the chloroform fumigation extraction technique, where the
MBC equals the DOC of fumigated soil minus that of the non-fumigated soil with a conversion factor of
0.38 [36]. Hot-water-extractable organic carbon (HEOC) and dissolved soil organic carbon (SDOC) were
separately extracted using boiling water [37,38] and a solution of 0.5 M K2 SO4 [31], and after filtering
through a 0.45 µm cellulose nitrate membrane, the supernatants were tested by a Multi 3100 (TOC/TN)
analyzer (Analytik Jena, Germany) to determine the organic carbon and nitrogen concentrations. Fine
root nitrogen content, leaf litter nitrogen content, and soil parameters were averaged from the sample
replicates of each plot. Relevant abbreviations of soil variables were shown in Table 2.Forests 2019, 10, 369 5 of 15
2.5. Statistical Analysis
The data presented in the figures and tables for each parameter were averaged across four
treatment plot replicates for each nitrogen addition rate. Differences in the measured properties
were tested at the level of α = 0.05 across different treatments using the one-way analysis of variance
(ANOVA) with tests for normal distribution and homogeneity of variance. A two-way analysis of
variance was implemented to examine the effects of nitrogen addition and seasonal variation on the
seasonal cumulative soil respiration rate (RS ). An exponential and linear regression analysis was
conducted to measure the relationships between parameters in our study. The statistical analysis was
conducted using R version 3.50 (R Core Team, 2018 R: A language and environment for statistical
computing. R Foundation for Statistical Computing, Vienna, Austria) [39]. The figures were made
using SigmaPlot 12.0 (https://sigmaplot.en.softonic.com).
3. Results
3.1. Soil Respiration Rate over Time
Following the addition of inorganic nitrogen, the annual average instantaneous soil respiration rate
(Rai ) measured in field plots decreased by an average of 16.71%, varying from 2.19 µmol CO2 m−2 s−1
in the control (N0) plot to 1.74 µmol CO2 m−2 s−1 in the N40 plot (Table 3). The estimated RA averaged
640.17 g C m−2 year−1 across all forest plots. The average RS values across all five treatment levels were
74.04, 369.21, 160.73, and 36.20 g C m−2 in spring, summer, autumn, and winter, respectively (Figure 2a).
Nitrogen addition significantly reduced the RA by 23.74 %, on average (Table 3). The N40 plot had
the lowest RA at 542.78 g C m−2 year−1 , 31.32% lower than that of the N0 plot. The Rs in summer
accounted for almost 57.41% of the RA across all plots, on average, ranging from 301.67 g C m−2 in the
N40 plot to 481.24 g C m−2 in the N0 plot (Figure 2a,b). The second-largest RS , about 25.22% of the RA ,
on average, occurred in autumn (Figure 2a,b). Although the magnitude of autumn soil respiration
decreased, its average contribution to RA significantly increased following nitrogen addition, from a
minimum value of 23.57% in the N0 plot to a maximum value of 25.90% in the N20 plot (Figure 2b).
In addition, nitrogen addition significantly increased the proportion of winter soil respiration from
11.04% in the N0 plot to 12.18% in the N40 plot (Figure 2b). The two-way analysis of variance suggested
that seasonal variation and nitrogen addition significantly affected RS (Figure 2, Table 4). R10 was also
significantly reduced by 23.95% in the N40 plot (Table 3). The Q10 and soil respiration rate at 0 ◦ C (R0 )
were not affected by nitrogen addition and were maintained at around 5.18 and 0.38 µmol CO2 m−2 s−1 ,
respectively, across different nitrogen addition rates (Table 3).
Table 3. Soil respiration variables among five nitrogen addition rates.
RA R0 (µmol CO2 R10 (µmol CO2 Rai (µmol CO2
Treatment Q10 T ◦C
(g C m−2 year−1 ) m−2 s−1 ) m−2 s−1 ) m−2 s−1 )
CK 790.25 ± 30.85 a 0.41 ± 0.02 a 2.24 ± 0.08 a 2.19 ± 0.09 a 5.41 ± 0.12 a 7.41 ± 1.59a
N5 644.64 ± 28.29 ab 0.39 ± 0.01 a 2.03 ± 0.09 ab 1.99 ± 0.07 ab 5.26 ± 0.12 a 7.41 ± 1.63a
N10 628.45 ± 44.48 b 0.34 ± 0.03 a 1.86 ± 0.14 ab 1.78 ± 0.07 ab 5.55 ± 0.14 a 7.56 ± 1.66a
N20 594.73 ± 39.45 b 0.39 ± 0.02 a 1.89 ± 0.11 ab 1.80 ± 0.11 ab 4.84 ± 0.33 a 7.49 ± 1.63a
N40 542.78 ± 38.80 b 0.36 ± 0.03 a 1.71 ± 0.07 b 1.74 ± 0.13 b 4.81 ± 0.29 a 7.48 ± 1.66a
RA , R0 , R10 , Rai , Q10 , and T denote the annual cumulative soil respiration rate, the soil respiration rate at 0 ◦ C, the
basal soil respiration rate at 10 ◦ C, the annual average instantaneous soil respiration rate, the temperature sensitivity
of soil respiration, and the annual average soil temperature, respectively. Different lowercase letters in the same
column represent significant differences (p < 0.05, n = 4) among the five nitrogen addition rates. Data are mean ± SE.Forests 2019, 10, 369 6 of 15
Forests 2019, 10, x FOR PEER REVIEW 6 of 15
Figure 2. Seasonal cumulative soil respiration (RS ) (a) and variation in the seasonal proportion of RS
(b)Figure
under2.different
Seasonal nitrogen rates.soil
cumulative Different lowercase
respiration letters
(Rs) (a) and in the same
variation incolumn indicate
the seasonal a significant
proportion of RS
difference (p < 0.05, n = 4) among the five nitrogen addition rates.
(b) under different nitrogen rates. Different lowercase letters in the same column indicate a
significant
Table difference
4. Significance of (p
the< effects
0.05, n of
=4)nitrogen
among the five nitrogen
addition addition
and seasonal rates. on seasonal cumulative
variation
soil respiration (RS ) as assessed by two-way ANOVA.
Table 4. Significance of the effects of nitrogen addition and seasonal variation on seasonal
cumulativeVariables
soil respiration Df(Rs) asSum
assessed
Sq by Mean
two-waySq ANOVA. F P
T
Variables 4 Df 32743 Sum Sq 8186
Mean Sq 11.596 F 4.86 × 10P−7
11.596Forests 2019, 10, x FOR PEER REVIEW 7 of 15
Forestsletters in 369
2019, 10, the same row represent a significant difference (p < 0.05, n = 4) among the five nitrogen7 of 15
addition rates. * represents p < 0.05 and ** represents p < 0.01. Data are mean ± SE.
3.3.The
3.3 TheEffect
EffectofofInorganic
InorganicNitrogen
NitrogenAddition
Additionon
onLitter
LitterProduction
Productionand
andIts
ItsNitrogen
NitrogenContent
Content
Litter production
Litter production andand nitrogen
nitrogen content
contentwerewere affected
affected differently
differently by
by inorganic
inorganic nitrogen
nitrogen addition
addition
(Figure 3). The amount of fine root biomass was significantly reduced
(Figure 3). The amount of fine root biomass was significantly reduced by almost half (Figure by almost half (Figure 3a),3a),
but
its nitrogen
but its nitrogencontent waswas
content not significantly
not significantly affected (Figure
affected 3b). 3b).
(Figure The The
nitrogen content
nitrogen of the
content of fine root
the fine
averaged 8.08 g kg −1 for nitrogen-addition plots, compared with 6.65 g kg−1 in the N0 plot. Nitrogen
root averaged 8.08 g kg for nitrogen-addition plots, compared with 6.65 g kg in the N0 plot.
-1 -1
addition also
Nitrogen had no
addition effect
also hadon nofoliage
effect onproduction (Figure 3c),(Figure
foliage production but it significantly increased theincreased
3 c), but it significantly nitrogen
content
the of fresh
nitrogen leaf litter
content (Figure
of fresh leaf3d) by an
litter average
(Figure 3d)of by
15.73%, with theoflargest
an average 15.73%,concentration being
with the largest
15.71 g kg −1 in the N20 plot (Figure 3d). Foliage production slightly declined (by 8.22%) from the N0
concentration being 15.71 g kg in the N20 plot (Figure 3d). Foliage production slightly declined (by
-1
value of
8.22%) 634.44
from m−2
thegN0 in the
value of plots
634.44withg mnitrogen added
-2 in the plots (Figure
with 3c). added (Figure 3c).
nitrogen
Figure
Figure 3. 3. Variations
Variations inin fine
fine root
root biomass
biomass (a),
(a), fine
fine root
root nitrogen
nitrogen content
content (b),
(b), leaf
leaf litter
litter input
input (c),
(c), and
and
leaf litter nitrogen
leaf litter nitrogencontent
content (d).(d). Different
Different lowercase
lowercase lettersletters
above above bars represent
bars represent a significanta significant
difference
(p < 0.05, n(p=Forests 2019, 10, 369 8 of 15
Forests 2019,2019,
Forests 10, x 10,
FOR PEERPEER
x FOR REVIEW
REVIEW 8 of 15
8 of 15
Figure
Figure4. Relationship
Figure between
4.4.Relationship
Relationship annual
between
between cumulative
annual
annual soil soil
cumulative
cumulative respiration
soil rate rate
respiration
respiration (RA) (R
rate and
(RA
fine
A)) and root root
and fine
fine biomass
root biomass (a),
biomass
(a),leaf
leaf litter
(a), litter input (b), MBC
(b), (b),
leaf litter input MBC content
content
MBC (c), and
(c),(c),
content SDOC
andandSDOCcontent
SDOCcontent(d).
content(d).
(d).
3.5.3.5.
3.5.
Variation
Variation
Variation
of
of Soil Soil Organic
Organic
of Soil
Carbon
Carbon
Organic
by Litter
by Litter
Carbon Input
by Litter
Input
Input
TheThe
The belowground
belowground
belowground litter
litter input
input
litter played
played
input an important
played important role
an importantrolein controlling
in
role the the
controlling SOCthe
in controlling fraction.
SOC Correlation
fraction.
SOC fraction.
analysis
Correlation showed
analysis that fine
showed root
that biomass
fine root was exponentially
biomass was and
exponentially positively
and correlated
positively
Correlation analysis showed that fine root biomass was exponentially and positively correlated with MBC and
correlated
with
SDOCMBC and SDOC
contents
with MBC contents
and (Figure (Figure 5a,b),
5a,b), respectively.
SDOC contents respectively.
(Figure 5a,b),Fine Fine
root biomass
respectively. root biomass
Fineexplained explained 36%
36%explained
root biomass and 33% of and 33%
theand
36% variation
33%
of the variation
inofMBC in MBC
and SDOC
the variation andand SDOC
contents,
in MBC contents,
respectively.
SDOC respectively.
contents, respectively.
Figure
Figure
Figure 5. Relationship
5. Relationship
5. Relationship between
between fineroot
fine fine
between root rootbiomass
biomass
biomass and
and and
MBC MBC
(a)
MBC (a)(a)
and and
SDOC
and SDOC
(b)
SDOC (b) (b)
content. content.
content.Forests 2019, 10, 369 9 of 15
4. Discussion
4.1. The Effect of Nitrogen Addition on Soil Respiration Rate at Temporal Scales
The soil temperature and instantaneous rate of soil respiration were used as the two fundamental
parameters for estimating cumulative soil respiration. Because all 20 experimental plots were distributed
in the same forest stand, soil temperature did not display a marked difference between different
treatment plots, regardless of the amount of inorganic nitrogen received. In contrast, Rai showed an
obvious decreasing trend with increased nitrogen addition (Table 3). Inorganic nitrogen addition
significantly changed RA (Table 3); summer RS was reduced by 29.10%, whereas spring and autumn
RS only declined by 18.89% and 17.11%, on average, across all four nitrogen-addition plots (Figure 2a).
The marked decrease in soil respiration in the main growing season is consistent with many previous
studies [6,40,41] but differs from a previous experiment showing that soil respiration was affected by
organic nitrogen (urea) in the same region [42]. The different results may derive from the contrasting
effects of inorganic and organic nitrogen; organic nitrogen addition could promote the transformation
of recalcitrant organic compounds into easily digestible forms, improve the microbial community
metabolism, and strengthen the activity of relevant extracellular enzymes [43]. In contrast to the
effect during the growing season, the four nitrogen levels had little effect in winter, as previously
reported by Fang et al. (2017) [44]. In contrast to the negative effect of nitrogen on the magnitude of RS ,
nitrogen addition significantly increased the proportions of autumn and winter RS in RA (Figure 2b).
This is because soil respiration is inhibited by nitrogen addition to a greater extent in the warm season
than in the cold season [45,46]. The independent and interactive effects of seasonal variation and
nitrogen addition on RS (Figure 2a, Table 4) and the variable inhibition magnitudes of different seasons
(Figure 2a,b) illustrate that a warming climate could enhance the inhibition of inorganic nitrogen. This
result is consistent with studies by Liu et al. (2017) and Tao et al. (2013), who proposed that nitrogen
deposition could mitigate increased soil respiration due to warming temperatures [45,47].
In order to avoid uncertainty in the comparability of the field-measured rate of soil respiration,
R10 was also calculated [48,49], and a similar changing trend to Rai was shown (Table 3) across all the
different treatments. R10 varied from 2.24 µmol CO2 m−2 s−1 in the N0 plot to 1.71µmol CO2 m−2 s−1
in the N40 plot. This significant decrease in R10 at the same ambient temperature is a better indication
that inorganic nitrogen addition inhibited soil respiration. No statistical difference in the Q10 values of
different treatments were discovered (Table 3). This result is consistent with some short-term studies in
a Pleioblastus amarus Keng plantation [50], a semi-arid alfalfa-pasture of the Loess Plateau [44], and
a young subtropical plantation [45]. The Q10 values in our study are similar to those reported by a
previous study, which calculated an average value of 5.2 ± 2.4 in boreal and tundra forests at high
latitudes [51]. The variation in soil respiration and seasonal respiration proportions supports the
hypothesis that soil respiration would be affected by inorganic nitrogen addition.
4.2. The Effect of Nitrogen Addition on the Soil Carbon Fraction and Plant Litter Input
Soil organic carbon, which was measured via the wet combustion method, represents the total
content of all organic carbon forms contained in mineral soil particulates, and it is resistant to
slight disturbance. Consistent with Chen et al. (2012) [35] and Liu et al. (2017) [45], SOC and TN
were not influenced by inorganic nitrogen addition in the current study (Table 5), possibly because
short-term nitrogen treatment was not sufficient to induce a significant variation in SOC and TN
content [50]. However, a compartment carbon, soil labile organic carbon, was predicted to be sensitive
to changing environmental variables and was applied to interpret the inherent transformation dynamics
of SOC [34,35,52]. Soil labile organic carbon refers to organic matter that is easily available to the
soil microbial communities, including litter detritus and root exudates, SDOC, ROC, HEOC, and soil
microbial lysates [15,38,53]. Soil MBC and SDOC content both decreased following the inorganic
nitrogen input (Table 5). Soil microbial communities, as a part of labile organic carbon, play a
vital role in SOC decomposition processes. In this study, on average, inorganic nitrogen additionForests 2019, 10, 369 10 of 15
decreased MBC content by 23.50%, which is higher than the average N-induced suppression of MBC
content of 20.00% [5] and 15.00% [22] found by related meta-analyses. The average SDOC content
reduction of 22.60% in the present study is similar to that found by Du et al. (2014) [43] and Frey et al.
(2014) [20]. In addition, the rate of organic carbon with nitrogen in total soil organic matter (SOC/TN)
and soil dissolved organic matter (SDOC/SDON) were significantly decreased (Table 5) in inorganic
nitrogen addition plots. This may be ascribed to the nitrogen form (NH4 NO3 ) added to forest plots.
Ammonium nitrate is easily dissolvable, is absorbed quickly by organic matter with a low molecular
weight, and stimulates the formation of recalcitrant compounds [6]. Meanwhile, inorganic nitrogen is
chemically immobilized by mineral soil particles [54]. Previous studies indicate that the interaction of
deposited nitrogen with soil particles will produce toxic aluminum and will limit magnesium and
calcium availability, thereby depressing soil microbial community activity [22,55,56]. The reduction of
labile organic carbon bioavailability and environmental stress by inorganic nitrogen addition are two
important factors that limit soil decomposers’ activities [57].
Leaf and root detritus and exudates are major sources of soil organic carbon, and their production
and nutrient content could be influenced by nitrogen input [19,24,58,59]. The fine root biomass was on
average reduced by 114.07 g m−2 by nitrogen addition and as 43.55 % lower in all nitrogen addition
plots compared to the N0 plot. (Figure 3a). This is because the fine root system is mainly responsible
for the absorption of nutrients from the rhizospheric environment [24,60], and nitrogen is the limiting
factor for forest growth in northern China [54,61,62]. The input of inorganic nitrogen could alleviate
the inhibition of plant growth due to soil nitrogen scarcity [6,24]. The ammonium cation in soil solution
could be quickly transported by the root system to meet the requirements of the aboveground plant
metabolism [63–66]. Although no obvious difference was measured in the aboveground litter input
(Figure 3c), the nitrogen content of fresh leaf litter was found to increase with enhanced nitrogen
addition rates, and the increase was 23.90% greater in the N20 plot than in the N0 plot (Figure 3d).
The stable nitrogen concentration in soil total organic matter and soil labile organic matter (Table 5)
and the significant increase in leaf litter nitrogen content suggest that a plant assimilates the deposited
nitrogen as an important mechanism to maintain a stable forest soil nitrogen content under intensified
atmospheric nitrogen deposition [63,66,67]. Increased nitrogen availability alleviates plants’ carbon
allocation to their root system and reduces root biomass, root litter, and root exudate production [60,68].
Additionally, nitrogen enrichment could inhibit lignin-rich leaf litter decomposition [69]. These factors
will reduce the carbon input from aboveground organic matter transformation and belowground
plant allocation.
4.3. The Correlation of RA with SOC Fraction and Plant Litter Input
Soil respiration is derived from a complicated process of above- and belowground organic matter
turnover [10,49]. Soil organic matter decomposition and carbon released from plant litter input
accounted for almost equal proportions of soil respiration [11,58,70]. The correlation analysis indicated
that RA was positively correlated with fine root biomass, leaf litter input, MBC content, and SDOC
content (Figure 4). These relationships suggest that inorganic nitrogen addition may influence soil
heterotrophic respiration by reducing MBC and soil labile organic carbon fractions [20,21,71] and
affect soil autotrophic respiration by suppressing soil fine root production, mycorrhizae, and other
types of microorganisms metabolism associated with root systems and belowground plant carbon
allocation [60,72]. This result is consistent with the hypothesis that inorganic nitrogen addition affects
soil respiration by influencing fine root production and the labile organic carbon fraction.
SOC storage and soil nutrient content play important roles in affecting the magnitude of soil
respiration [71,73]. However, the transient change in soil respiration is most strongly invoked by the
soil organic carbon fraction, which is easily affected by biophysical variables [21,53,74]. In the present
research, RA was significantly correlated with MBC and SDOC content (Figure 4c,d). These two organic
carbon fractions consisted of low molecular weight organic matter, including microbial lysates, cellulose,
glucose, and amino acids [13,75], and the added inorganic nitrogen proved to be quickly assimilated byForests 2019, 10, 369 11 of 15
these biochemical products, enhancing the ability to resist biological decomposition [6,22]. In addition,
the MBC content represents the decomposition intensity of organic carbon by soil decomposers.
Organic matter with a low molecular weight can undergo complete turnover during a period of only
several hours [21,76]. Thus, we predicted that the labile organic carbon fractions would account for the
effect of inorganic nitrogen addition on soil respiration.
Above- and belowground litter input not only influenced SOC content but also controlled soil
respiration [10,17,58]. The role of the fine root system in absorbing nutrients could be weakened in a soil
entity with sample nutrient provision, which subsequently induces less fine root production [24,60,68].
Because autotrophic respiration comprised almost 50% of total soil CO2 emissions, the reduction in
fine root biomass was another contributor to RA (Figure 4a). Although differences in foliage input did
not reach a significant level (p > 0.05), 41% of the variation in RA was still explained by leaf litter input
(Figure 4b). Generally, it was the above- and belowground litter input that jointly affected RA after
inorganic nitrogen addition.
Fine root production indirectly affected soil respiration by influencing the transformation of the
soil organic carbon fraction [19,60] and priming soil organic mineralization [18]. The decomposition of
root detritus by exocellular enzymes and root exudates produces a large amount of low molecular
weight organic matter [13,77,78]. Complex organic compounds are degraded into simple ones, which
are the components of the labile organic matter. Meanwhile, the root-derived soil labile organic fraction
is the major food resource driving soil microorganisms catabolism [18,78]. Both SDOC and MBC
content displayed significant correlation with fine root biomass (Figure 5a,b). The inhibition of fine
root biomass production by inorganic nitrogen addition perhaps lowered the labile organic carbon
content and soil microbial biomass metabolism concurrently [79].
5. Conclusions
The addition of nitrogen in the form of NH4 NO3 affected the turnover of soil organic matter,
decreasing both the RA and the fine root biomass. A similar effect of nitrogen addition was found for
soil MBC and SDOC content. However, nitrogen addition markedly enhanced the proportion of cold
season soil respiration in RA . The fine root biomass had a significant correlation with RA , MBC content,
and SDOC content, and is presumed to play a core role in untangling the interaction of nitrogen
deposition and soil organic matter turnover. Therefore, the effect of inorganic nitrogen addition on the
forest plant root system and the biogeochemical interaction of the root system with the soil organic
carbon fraction and soil decomposers should be investigated further to determine the variation in
forest soil organic carbon following intensified anthropogenic nitrogen deposition.
Author Contributions: H.Z. performed the field and laboratory experiments and analyzed the data; Y.L. and Z.Z.
designed the study; Z.Z. and H.Z. wrote the manuscript; Y.Z. took part in the field experiment and provided the
relevant material.
Funding: The financial support for this research was jointly provided by the Fundamental Research Funds for the
Central Universities (No.2015ZCQ-LX-03), the National Key Research and Development Program of the Ministry
of Science and Technology of China (No.2016YFD0600205), and the Normal Research Funds for Taiyueshan
Long-Term Forest Ecosystem Research Station (No.2017-,2018-LYPT-DW-153).
Acknowledgments: We would like to thank Yu Wang, Weicheng Sun, and Qinyang Lü for their intensive assistance
with the field investigation and the laboratory analyses.
Conflicts of Interest: The authors declare no conflict of interest.
References
1. Gruber, N.; Galloway, J.N. An Earth-system perspective of the global nitrogen cycle. Nature 2008, 451,
293–296. [CrossRef]
2. Greaver, T.L.; Clark, C.M.; Compton, J.E.; Vallano, D.; Talhelm, A.F.; Weaver, C.P.; Band, L.E.; Baron, J.S.;
Davidson, E.A.; Tague, C.L.; et al. Key ecological responses to nitrogen are altered by climate change.
Nat. Clim. Chang. 2016, 6, 836–843. [CrossRef]Forests 2019, 10, 369 12 of 15
3. Zhou, L.Y.; Zhou, X.H.; Zhang, B.C.; Lu, M.; Luo, Y.; Liu, L.L.; Li, B. Different responses of soil respiration and
itscomponents to nitrogen addition among biomes: A meta-analysis. Glob. Chang. Biol. 2014, 20, 2332–2343.
[CrossRef]
4. Liu, X.; Zhang, Y.; Han, W.; Tang, A.; Shen, J.; Cui, Z.; Vitousek, P.; Erisman, J.W.; Goulding, K.; Christie, P.;
et al. Enhanced nitrogen deposition over China. Nature 2013, 494, 459–462. [CrossRef]
5. Liu, L.; Greaver, T.L. A global perspective on belowground carbon dynamics under nitrogen enrichment.
Ecol. Lett. 2010, 13, 819–828. [CrossRef]
6. Janssens, I.A.; Dieleman, W.; Luyssaert, S.; Subke, J.-A.; Reichstein, M.; Ceulemans, R.; Ciais, P.; Dolman, A.J.;
Grace, J.; Matteucci, G.; et al. Reduction of forest soil respiration in response to nitrogen deposition.
Nat. Geosci. 2010, 3, 315–322. [CrossRef]
7. Chen, Z.M.; Xu, Y.H.; Fan, J.L.; Yu, H.Y.; Ding, W.X. Soil autotrophic and heterotrophic respiration in
response to different N fertilization and environmental conditions from a cropland in Northeast China.
Soil Biol. Biochem. 2017, 110, 103–115. [CrossRef]
8. Xu, M.; Shang, H. Contribution of soil respiration to the global carbon equation. J. Plant Physiol. 2016, 203,
16–28. [CrossRef]
9. Bond-Lamberty, B.; Thomson, A. A global database of soil respiration data. Biogeosciences 2010, 7, 1321–1344.
[CrossRef]
10. Sulzman, E.W.; Brant, J.B.; Bowden, R.D.; Lajtha, K. Contribution of aboveground litter, belowground litter,
and rhizosphere respiration to total soil CO2 efflux in an old growth coniferous forest. Biogeochemistry 2005,
73, 231–256. [CrossRef]
11. Wang, C.; Yang, J. Rhizospheric and heterotrophic components of soil respiration in six Chinese temperate
forests. Glob. Chang. Boil. 2007, 13, 123–131. [CrossRef]
12. Di Lonardo, D.; De Boer, W.; Gunnewiek, P.K.; Hannula, S.; Van Der Wal, A. Priming of soil organic matter:
Chemical structure of added compounds is more important than the energy content. Soil Boil. Biochem. 2017,
108, 41–54. [CrossRef]
13. de Graaff, M.A.; Classen, A.T.; Castro, H.F.; Schadt, C.W. Labile soil carbon inputs mediate the soil microbial
community composition and plant residue decomposition rates. New Phytol. 2010, 188, 1055–1064. [CrossRef]
14. Fang, C.; Smith, P.; Moncrieff, J.B.; Smith, J.U. Similar response of labile and resistant soil organic matter
pools to changes in temperature. Nature 2005, 433, 57–59. [CrossRef]
15. von Lützow, M.; Kögel-Knabner, I.; Ekschmitt, K.; Flessa, H.; Guggenberger, G.; Matzner, E.; Marschner, B.
SOM fractionation methods: Relevance to functional pools and to stabilization mechanisms. Soil Biol. Biochem
2007, 39, 2183–2207. [CrossRef]
16. Zhang, H.H.; Zhou, Z.Y. Recalcitrant carbon controls the magnitude of soil organic matter mineralization in
temperate forests of northern China. For. Ecosyst. 2018, 5, 17. [CrossRef]
17. Bae, K.; Fahey, T.J.; Yanai, R.D.; Fisk, M. Soil Nitrogen Availability Affects Belowground Carbon Allocation
and Soil Respiration in Northern Hardwood Forests of New Hampshire. Ecosystems 2015, 18, 1179–1191.
[CrossRef]
18. Huo, C.; Luo, Y.; Cheng, W. Rhizosphere priming effect: A meta-analysis. Soil Boil. Biochem. 2017, 111, 78–84.
[CrossRef]
19. Sokol, N.W.; Kuebbing, S.E.; Karlsen-Ayala, E.; Bradford, M.A. Evidence for the primacy of living root inputs,
not root or shoot litter, in forming soil organic carbon. New Phytol. 2019, 221, 233–246. [CrossRef]
20. Frey, S.D.; Ollinger, S.; Nadelhoffer, K.; Bowden, R.; Brzostek, E.; Burton, A.; Caldwell, B.A.; Crow, S.;
Goodale, C.L.; Grandy, A.S.; et al. Chronic nitrogen additions suppress decomposition and sequester soil
carbon in temperate forests. Biogeochemistry 2014, 121, 305–316. [CrossRef]
21. Kamble, P.N.; Rousk, J.; Frey, S.D.; Bååth, E. Bacterial growth and growth-limiting nutrients following chronic
nitrogen additions to a hardwood forest soil. Soil Boil. Biochem. 2013, 59, 32–37. [CrossRef]
22. Treseder, K.K. Nitrogen additions and microbial biomass: A meta-analysis of ecosystem studies. Ecol. Lett.
2008, 11, 1111–1120. [CrossRef] [PubMed]
23. Zhang, T.; Chen, H.Y.H.; Ruan, H. Global negative effects of nitrogen deposition on soil microbes. ISME J.
2018, 12, 1817–1825. [CrossRef]
24. Li, W.B.; Jin, C.J.; Guan, D.X.; Wang, Q.K.; Wang, A.Z.; Yuan, F.H.; Wu, J.B. The effects of simulated nitrogen
deposition on plant root traits: A meta-analysis. Soil Biol. Biochem. 2015, 82, 112–118. [CrossRef]Forests 2019, 10, 369 13 of 15
25. Guo, H.; Wang, B.; Ma, X.Q.; Zhao, G.D.; Xu, S.N. An evaluation on ecological service function of pinus
tabuliformis forest in China. Sci. China Life Sci. 2008, 38, 565–572. (In Chinese)
26. He, C.E.; Liu, X.; Fangmeier, A.; Zhang, F. Quantifying the total airborne nitrogen input into agroecosystems
in the North China Plain. Agric. Ecosyst. Environ. 2007, 121, 395–400. [CrossRef]
27. He, C.-E.; Wang, X.; Liu, X.; Fangmeier, A.; Christie, P.; Zhang, F. Nitrogen deposition and its contribution to
nutrient inputs to intensively managed agricultural ecosystems. Ecol. Appl. 2010, 20, 80–90. [CrossRef]
28. Zhang, J.; Zheng, C.; Ren, D.; Chou, C.-L.; Liu, J.; Zeng, R.; Wang, Z.; Zhao, F.; Ge, Y. Distribution of
potentially hazardous trace elements in coals from Shanxi province, China. Fuel 2004, 83, 129–135. [CrossRef]
29. van’t Hoff, J.H. Lectures on Theoretical and Physical Chemistry; Lehfeldt, R.A., Ed.; Edwart Arnold: London,
UK, 1898; pp. 224–229. (In German)
30. Zhou, Z.; Xu, M.; Kang, F.; Sun, O.J. Maximum temperature accounts for annual soil CO2 efflux in temperate
forests of Northern China. Sci. Rep. 2015, 5, 12142. [CrossRef]
31. Mo, J.; Zhang, W.; Zhu, W.; Gundersen, P.; Fang, Y.; Li, D.; Wang, H. Nitrogen addition reduces soil respiration
in a mature tropical forest in southern China. Glob. Chang. Biol. 2008, 14, 403–412. [CrossRef]
32. Nelson, D.W.; Sommers, L.E. Total carbon, organic carbon, and organic matter. In Methods of Soil Analysis;
Page, A.L., Miller, R.H., Keeney, D.R., Eds.; American Society of Agronomy and Soil Science Society of
American: Madison, WI, USA, 1982; pp. 101–129.
33. Gallaher, R.N.; Weldon, C.O.; Boswell, F.C. A Semiautomated Procedure for Total Nitrogen in Plant and Soil
Samples1. Soil Sci. Soc. J. 1976, 40, 887. [CrossRef]
34. Tirol-Padre, A.; Ladha, J.K. Assessing the Reliability of Permanganate-Oxidizable Carbon as an Index of Soil
Labile Carbon. Soil Sci. Soc. J. 2004, 68, 969. [CrossRef]
35. Chen, X.; Liu, J.; Deng, Q.; Yan, J.; Zhang, D. Effects of elevated CO2 and nitrogen addition on soil organic
carbon fractions in a subtropical forest. Plant Soil 2012, 357, 25–34. [CrossRef]
36. Vance, E.; Brookes, P.; Jenkinson, D. An extraction method for measuring soil microbial biomass C. Soil Boil.
Biochem. 1987, 19, 703–707. [CrossRef]
37. Bu, X.; Wang, L.; Ma, W.; Yu, X.; McDowell, W.H.; Ruan, H. Spectroscopic characterization of hot-water
extractable organic matter from soils under four different vegetation types along an elevation gradient in the
Wuyi Mountains. Geoderma 2010, 159, 139–146. [CrossRef]
38. Balaria, A.; Johnson, C.E.; Groffman, P.M.; Fisk, M.C. Effects of calcium silicate treatment on the composition
of forest floor organic matter in a northern hardwood forest stand. Biogeochemistry 2014, 122, 313–326.
[CrossRef]
39. R Core Team. R: A Language and Environment for Statistical Computing. R Foundation for Statistical
Computing, Vienna, Austria. Available online: https://www.R-project.org/ (accessed on 23 April 2018).
40. Fan, H.; Wu, J.; Liu, W.; Yuan, Y.; Huang, R.; Liao, Y.; Li, Y. Nitrogen deposition promotes ecosystem
carbon accumulation by reducing soil carbon emission in a subtropical forest. Plant Soil 2014, 379, 361–371.
[CrossRef]
41. Maaroufi, N.; Nordin, A.; Hasselquist, N.J.; Bach, L.H.; Palmqvist, K.; Gundale, M.J. Anthropogenic nitrogen
deposition enhances carbon sequestration in boreal soils. Glob. Chang. Boil. 2015, 21, 3169–3180. [CrossRef]
[PubMed]
42. Wang, J.; Wu, L.; Zhang, C.; Bu, W.; Zhao, X.; Gadow, K.V. Combined effects of nitrogen addition and organic
matter manipulation on soil respiration in a Chinese pine forest. Environ. Sci. Pollut. 2016, 23, 22701–22710.
[CrossRef]
43. Du, Y.; Guo, P.; Liu, J.; Wang, C.; Yang, N.; Jiao, Z. Different types of nitrogen deposition show variable effects
on the soil carbon cycle process of temperate forests. Glob. Chang. Boil. 2014, 20, 3222–3228. [CrossRef]
44. Fang, C.; Ye, J.-S.; Gong, Y.; Pei, J.; Yuan, Z.; Xie, C.; Zhu, Y.; Yu, Y. Seasonal responses of soil respiration to
warming and nitrogen addition in a semi-arid alfalfa-pasture of the Loess Plateau, China. Sci. Total. Environ.
2017, 590, 729–738. [CrossRef]
45. Liu, X.; Yang, Z.; Lin, C.; Giardina, C.P.; Xiong, D.; Lin, W.; Chen, S.; Xu, C.; Chen, G.; Xie, J.; et al. Will nitrogen
deposition mitigate warming-increased soil respiration in a young subtropical plantation? Agric. For. Meteorol.
2017, 246, 78–85. [CrossRef]
46. Zhou, X.; Zhang, Y. Seasonal pattern of soil respiration and gradual changing effects of nitrogen addition in a
soil of the Gurbantunggut Desert, northwestern China. Atmos. Environ. 2014, 85, 187–194. [CrossRef]Forests 2019, 10, 369 14 of 15
47. Tao, B.; Song, C.; Guo, Y. Short-term Effects of Nitrogen Additions and Increased Temperature on Wetland
Soil Respiration, Sanjiang Plain, China. Wetlands 2013, 33, 727–736. [CrossRef]
48. Sampson, D.A.; Janssens, I.A.; Yuste, J.C.; Ceulemans, R. Basal rates of soil respiration are correlated with
photosynthesis in a mixed temperate forest. Glob. Chang. Boil. 2007, 13, 2008–2017. [CrossRef]
49. Zhou, Z.; Zhang, Z.; Zha, T.; Luo, Z.; Zheng, J.; Sun, O.J. Predicting soil respiration using carbon stock in
roots, litter and soil organic matter in forests of Loess Plateau in China. Soil Boil. Biochem. 2013, 57, 135–143.
[CrossRef]
50. Tu, L.H.; Hu, T.X.; Zhang, J.A.; Li, R.H.; Dai, H.Z.; Luo, S.H. Short-term simulated nitrogen deposition
increases carbon sequestration in a Pleioblastus amarus plantation. Plant Soil 2011, 340, 383–396. [CrossRef]
51. Chen, H.; Tian, H.-Q. Does a General Temperature-Dependent Q10 Model of Soil Respiration Exist at Biome
and Global Scale? J. Integr. Plant Boil. 2005, 47, 1288–1302. [CrossRef]
52. McDowell, W.H.; Magill, A.H.; A Aitkenhead-Peterson, J.; Aber, J.D.; Merriam, J.L.; Kaushal, S.S. Effects of
chronic nitrogen amendment on dissolved organic matter and inorganic nitrogen in soil solution. Ecol. Manag.
2004, 196, 29–41. [CrossRef]
53. Wang, Z.; Zhang, Z.; Hu, Y.; Wang, Q.; Wang, S.; Zhang, Z.; Zhao, Y. Climate change affects soil labile organic
carbon fractions in a Tibetan alpine meadow. J. Soils Sediments 2016, 17, 326–339.
54. Bengtsson, G.; BergWall, C. Fate of 15N labelled nitrate and ammonium in a fertilized forest soil. Soil Boil.
Biochem. 2000, 32, 545–557. [CrossRef]
55. Bowman, W.D.; Cleveland, C.C.; Halada, L.; Hreško, J.; Baron, J.S. Negative impact of nitrogen deposition on
soil buffering capacity. Nat. Geosci. 2008, 1, 767–770. [CrossRef]
56. Wang, C.; Liu, D.; Bai, E. Decreasing soil microbial diversity is associated with decreasing microbial biomass
under nitrogen addition. Soil Boil. Biochem. 2018, 120, 126–133. [CrossRef]
57. Li, Y.; Sun, J.; Tian, D.; Wang, J.; Ha, D.; Qu, Y.; Jing, G.; Niu, S. Soil acid cations induced reduction in
soil respiration under nitrogen enrichment and soil acidification. Sci. Total. Environ. 2018, 615, 1535–1546.
[CrossRef]
58. Wang, Q.; Yu, Y.; He, T. Aboveground and belowground litter have equal contributions to soil CO2 emission:
An evidence from a 4-year measurement in a subtropical forest. Plant Soil 2017, 421, 7–17. [CrossRef]
59. Cusack, D.F.; Silver, W.L.; Torn, M.S.; McDowell, W.H. Effects of nitrogen additions on above-and
below-ground carbon dynamics in two tropical forests. Biogeochemistry 2011, 104, 203–225. [CrossRef]
60. Phillips, R.P.; Fahey, T.J. Fertilization effects on fineroot biomass, rhizosphere microbes and respiratory fluxes
in hardwood forest soils. New Phytol. 2007, 176, 655–664. [CrossRef] [PubMed]
61. Zeng, W.; Wang, W. Combination of nitrogen and phosphorus fertilization enhance ecosystem carbon
sequestration in a nitrogen-limited temperate plantation of Northern China. Ecol. Manag. 2015, 341, 59–66.
[CrossRef]
62. Lebauer, D.S.; Treseder, K.K. Nitrogen limitation of net primary productivity in terrestrial ecosystems is
globally distributed. Ecology 2008, 89, 371–379. [CrossRef]
63. Rothstein, D.E.; Cregg, B.M. Effects of nitrogen form on nutrient uptake and physiology of Fraser fir
(Abies fraseri). Ecol. Manag. 2005, 219, 69–80. [CrossRef]
64. Smirnoff, N.; Stewart, G.R. Nitrate assimilation and translocation by higher plants:Comparative physiology
and ecological consequences. Physiol. Plant. 1985, 64, 133–140. [CrossRef]
65. Brzostek, E.; Phillips, R.P.; Midgley, M.G. The mycorrhizal-associated nutrient economy: A new framework
for predicting carbon–nutrient couplings in temperate forests. New Phytol. 2013, 199, 41–51.
66. Midgley, M.G.; Phillips, R.P. Resource stoichiometry and the biogeochemical consequences of nitrogen
deposition in a mixed deciduous forest. Ecology 2016, 97, 3369–3378. [CrossRef]
67. Lu, M.; Yang, Y.H.; Luo, Y.; Fang, C.M.; Zhou, X.H.; Chen, J.K.; Yang, X.; Li, B. Responses of ecosystem
nitrogen cycle to nitrogen addition: A meta-analysis. New Phytol. 2011, 189, 1040–1050. [CrossRef]
68. Nadelhoffer, K.J. The potential effects of nitrogen deposition on fine-root production in forest ecosystems.
New Phytol. 2000, 147, 131–139. [CrossRef]
69. Knorr, M.; Frey, S.D.; Curtis, P.S. Nitrogen additions and litter decomposition: A meta-analysis. Ecology 2008,
86, 3252–3257. [CrossRef]
70. Hanson, P.J.; Edwards, N.; Garten, C.; Andrews, J. Separating root and soil microbial contributions to soil
respiration: A review of methods and observations. Biogeochemistry 2000, 48, 115–146. [CrossRef]You can also read