A Monte Carlo Parametric Sensitivity Analysis of Automobile Handling, Comfort, and Stability
←
→
Page content transcription
If your browser does not render page correctly, please read the page content below
Hindawi
Shock and Vibration
Volume 2021, Article ID 6638965, 24 pages
https://doi.org/10.1155/2021/6638965

Research Article
A Monte Carlo Parametric Sensitivity Analysis of Automobile
Handling, Comfort, and Stability

 Mohamed A. Hassan,1,2,3 Mohamed AA Abdelkareem ,3,4 Gangfeng Tan ,1,2
 and M.M Moheyeldein3
 1
 School of Automotive Engineering, Wuhan University of Technology, Wuhan 430070, China
 2
 Suizhou-WUT Industry Research Institute, Suizhou 441300, China
 3
 Automotive and Tractors Engineering Department, Faculty of Engineering, Minia University, El-Minia 61519, Egypt
 4
 Department of Mechanical Engineering, The Hong Kong Polytechnic University, Hong Kong, China

 Correspondence should be addressed to Gangfeng Tan; auto_nova@whut.edu.cn

 Received 10 October 2020; Revised 16 August 2021; Accepted 21 August 2021; Published 7 September 2021

 Academic Editor: Marco Lepidi

 Copyright © 2021 Mohamed A. Hassan et al. This is an open access article distributed under the Creative Commons Attribution
 License, which permits unrestricted use, distribution, and reproduction in any medium, provided the original work is
 properly cited.
 This paper investigates the bandwidth sensitivity of automobile handling, comfort, and stability based on Monte Carlo sensitivity
 simulations. Performed bandwidth sensitivity simulations include the effects of vehicle geometry and suspension parameters on
 lateral acceleration, roll angle, front/rear sideslip angles, and yaw rate angle, including both time- and frequency-domain
 sensitivity analyses. To replicate actual automobile responses, a full-vehicle roll-oriented suspension seven-degree-of-freedom
 (7-DOF) model was developed and implemented considering a 2-DOF planar two-track model with a nonlinear Pacejka tire
 model. During the Monte Carlo simulations, 10 mm and 20 mm amplitude sine-wave excitations were used for the left and right
 sides, respectively, and the frequency was uniformly sampled over the range of 0–30 Hz. Simultaneously, each investigated vehicle
 parameter varied by ±25% relative to the reference model parameters. These simulations illustrate the sensitivity of the lateral
 acceleration, roll angle, yaw angle, and sideslip angles to their parameter variations. The results confirm that the road excitation
 frequency, tire properties, vehicle geometry, and suspension parameters significantly influence the vehicular lateral and roll
 stabilities when considering the lower and higher peaks and the frequency bandwidths of the lateral and roll stabilities. In-
 terestingly, the longitudinal location of the center of gravity and the tire properties can achieve more significant peak lateral
 stability responses, as represented by the front and rear sideslip angles and the frequency bandwidth, compared to the other
 vehicle parameters at high frequencies. Choosing the correct tire properties and vehicle geometry, as well as suspension
 characteristics, plays an essential role in increasing the vehicular lateral stability and the rollover threshold. Variations in the
 studied parameters allow for higher vehicular stability when a vehicle is driven on random road surfaces.

1. Introduction the sprung mass and the location of the center of gravity
 (C.G.), suspension characteristics, and driving conditions
Studies of vehicle dynamics can make fundamental con- [1–5]. Tuned vehicle design parameters and suspension
tributions to the further development of the vehicle industry. features can provide enhanced interactions between the tires
Accordingly, several strategies have been investigated to and the road surface [6–8].
enhance the ride and handling performances of vehicles.
Handling dynamics deal with the lateral or transverse vehicle
dynamics, which primarily refer to the vehicular handling 1.1. Literature Review. Several studies have investigated the
stability, sideslip caused by lateral tire forces, and yaw and effects of vehicle parameters on the lateral and handling
roll motions. Vehicular handling and stability are signifi- instabilities. Whitehead et al. [2] studied the impact of the
cantly affected by the inertial vehicle properties, including C.G. location on the lateral and roll instabilities when a vehicle
2 Shock and Vibration

is subjected to a fishhook maneuver. The correlation between size of a tire significantly affect the tire adhesion coefficient.
the C.G. location and the rollover resistance was determined Similarly, the tire adhesion coefficient is significantly
using a validated three-degree-of-freedom (3-DOF) model. In influenced by the tire parameters, where increasing the tire
another study by Marimuthu et al. [9], the sensitivity of the size and decreasing the aspect ratio leads to an increase in the
effect of critical vehicle parameters on the roll behavior was tire adhesion coefficient [29].
investigated for sport utility vehicles (SUVs) using a validated Conversely, increasing the tire pressure reduces the
nonlinear vehicle model. The investigated vehicle parameters adhesion coefficient of the tire by reducing the tire–road
included the C.G. height, track width, and wheelbase length surface contact area. Meanwhile, decreasing the tire pressure
during a fishhook steering maneuver. Many other scientific increases the adhesion coefficient by increasing the contact
articles have examined the lateral stability and rollover patch [30]. In addition, the adhesion coefficient is greatly
thresholds of heavy trucks in terms of the design parameters influenced by the tread pattern, which increases the adhesion
and operational factors, including the load distribution, trailer capacity of the tire by removing the moisture between the
spacing, payload density, and C.G. height [10, 11]. tread and the actual contact area on the road surface [31].
 In recent years, researchers have focused on the role of Vehicle speed also has a significant effect on the adhesion
suspension characteristics in vehicle dynamics. There are coefficient, which gradually decreases as the speed increases
many suspension types, including springs, shock absorbers, [28, 32]. Road surface conditions dominate the tire adhesion
and anti-roll bars; therefore, it is vital to understand their coefficient; these conditions are the most critical factors for
corresponding vehicular lateral stability and rollover resis- the tire adhesion coefficient, and the adhesion of the tire is
tance capabilities. Zhang et al. [12] developed a 9-DOF strongly affected by wet and snowy conditions [33, 34].
vehicle model to evaluate the vehicular rollover propensity. Wielenga [35] investigated the effect of the tire character-
The vehicle lateral acceleration, roll angle, roll rate, and yaw istics for different-sized tires, including the coefficients of
rate were obtained for different suspension stiffnesses during cornering, camber stiffness, and peak lateral friction. The
a fishhook maneuver. The study extended to the influences rollover resistance and lateral stability were examined under
of shock absorber damping and the anti-roll bar on the normal and extreme maneuvers. The effects of the tire
vehicular rollover resistance capability [7]. The rollover characteristics on vehicular rollover and lateral stability were
critical factor has also been evaluated with variations in the investigated using two tire types with different adhesions to
suspension characteristics using the fishhook and sine evaluate the relationship between the rollover propensity
maneuvers. The results indicate the strong effects of sus- and lateral stability [5]. The results confirmed that the ad-
pension properties, such as the roll center height, roll steer, hesion capacities of tires significantly influence the lateral
and roll camber on the vehicle dynamics. Hac [13, 14] in- vehicular stability and rollover propensity.
vestigated the effects of various suspension design param- Wang et al. [36] studied roll instability under various
eters that tend to increase the jacking forces and the vehicle road excitations and steering wheel inputs. In Ref. [37], the
rollover propensity using simple roll-plane and full-vehicle correlation between the vehicular rollover and lateral sta-
models. Shim and Velusamy [6, 15] studied the vehicle bilities and the impact of road excitations was considered to
dynamics while changing the suspension geometry, in- evaluate the overall vehicular rollover stability. The effects of
cluding the toe, camber, and roll center height for both the steering wheel inputs with different amplitudes and fre-
front and rear suspensions with variations in wheel travel. quencies on an untripped rollover were evaluated in Ref.
Several studies have investigated hydraulically inter- [38]. The results confirmed that, during an extreme ma-
connected suspension systems to enhance both the lateral neuver, steering frequencies ranging from 0.3 Hz to 0.8 Hz
and roll stabilities via suspension tuning [16–21]. are critical for untripped rollovers. Joshi et al. [39] studied
 To reduce lateral movement and ensure ride quality, a the effect of the steering input frequency on the transient
magnetorheological (MR) damper has been widely used to handling dynamics of SUVs. Their results indicate that the
connect the bogie and the vehicle body in practically all rail yaw rate and lateral acceleration responses are significantly
vehicles [22]. The MR damper was designed to be fitted into correlated with low-frequency steering inputs below 2 Hz.
the secondary lateral suspension system of railway vehicles The critical rollover factor was determined considering the
to improve ride quality through nonlinear stiffness and steering frequency with different steering amplitudes and
damping. Simulation results of different strategies for semi- vehicle speeds in Ref. [7]. The result revealed that rollovers
active controlled MR lateral dampers were compared with occur within a frequency range of 0.52–0.6 Hz.
the conventional passive lateral damper while the vehicle Recently, Monte Carlo simulations have been introduced
was excited at different running speeds and track irregu- to perform comprehensive parameter sensitivity analyses in
larities, including the effects of various braking phases on several automobile applications. Taghavifar and Rakheja
longitudinal train dynamics [23]. [40] presented a parametric sensitivity analysis of the po-
 Tire characteristics can provide improved interactions tential of energy harvesting, considering a four-wheeled
between the tire and the road surface [24–27]. Tire char- generic three-dimensional full-car using Monte Carlo
acteristics are influenced by several factors, including the tire simulations of different suspension characteristics, on-road
parameters (e.g., material, tire type, tire tread depth, and classes, and driving conditions. In another study, Zhang
internal pressure), vehicle parameters (e.g., speed and et al. [41, 42] conducted a comparative investigation of both
camber angle), vertical load, and road surface conditions direct and indirect drive vibratory energy harvesters con-
[28]. In terms of vehicle parameters, the cross-section and cerning regenerative shock absorbers to assess their energy
Shock and Vibration 3

harvesting abilities using Monte Carlo sensitivity simula- 2.1. Ride Comfort Model. Real suspensions have nonlinear
tions. Abdelkareem et al. [43] introduced a frequency springs and dampers, whose features cannot be reduced to a
sensitivity analysis based on Monte Carlo simulations to single number like the linear case. However, suspensions
perform a comprehensive bandwidth analysis of harvestable with linear behavior are an excellent introduction to the
power and suspension dynamics. Their sensitivity simula- study of the ride and vehicle stability in the literature due to
tions included the damping rate variation, spring stiffness, modeling simplicity [12, 44]. Inspired by this, our paper
tire stiffness, sprung mass, unsprung mass, and harmonic ignored the nonlinearity of suspension components. The
excitation amplitude. Their results demonstrated the effec- ride comfort model consists of 7-degree of freedom, con-
tiveness of Monte Carlo simulations when investigating sisting of the vehicle body bounce, pitch, roll, and four
vehicle dynamics, especially in the frequency domain. wheels vertical motions, as shown in Figure 1(a). It is worth
 mentioning that the lateral acceleration is brought into the
 vehicle body’s roll motion as illustrated in Figure 1(b).
 Moreover, the suspension model provides the tire model’s
1.2. Paper Contribution. Most of the conducted studies
 dynamic tire load, which plays a vital role. It is the major link
mainly addressed how the vehicle design parameters affect
 between the vertical and lateral forces exerted on the road,
vehicular lateral and roll stability, focusing only on time-
 which affects the vehicle’s lateral dynamics. The suspension
domain analysis, which does not precisely characterize the
 and roll motion models are subjected to sine-wave road
vehicle stability performance in terms of the frequency
 irregularities, as illustrated in Section 3.
bandwidth. Thus, it is necessary to design the vehicle ge-
 The equation of motion of the suspension system and
ometry and suspension parameters to improve vehicle
 roll motion can be developed as follows.
stability adequately during low-frequency and high-fre-
 The vertical vibration and pitch motion of the sprung
quency band scenarios. Frequency-based sensitivity sim-
 mass is expressed as
ulations aim to identify the least and most influential
parameters/variables to reveal correlations between the Mb z€b � Fsfr + Fsfl + Fsrr + Fsrl , (1)
parameters and the system performance. In this sense,
continued efforts are necessary to provide greater insight where the forces Fsrr , Fsrl , Fsfr , and Fsfl are the suspension
into the impacts of both low- and high-frequency road forces for each tire.
excitations on vehicular lateral stability and rollover pro-
 Iy €θb � Fsrr + Fsrl · lr − Fsfr + Fsfl · lf . (2)
pensity. Based on Monte Carlo simulations, the current
study conducted a complete frequency-based parametric The vertical vibration of unsprung masses is represented
bandwidth sensitivity analysis associated with vehicle lat- as follows:
eral and roll stability of a 9-DOF passenger vehicle model.
The sensitivity simulations included inertial vehicle mufr €zufr � ktfr zRfr − zufr − Fsfr ,
properties, suspension system characteristics, and har-
monic excitation parameters. The lateral and transverse mufl €zufl � ktfl zRfl − zufl − Fsfl ,
 (3)
dynamics of the vehicle, which primarily refer to vehicular murr €zurr � ktrr zRrr − zurr − Fsfrr ,
handling stability, front/rear tire sideslip caused by lateral
tire forces, lateral acceleration, roll angle, and yaw rate, murr €zurl � ktrl zRrl − zurl − Fsfrl .
were investigated. Furthermore, the contribution of this
paper also lies in identifying the parameters/variables that Then, the vehicle body roll motion can be expressed as
are either most or least important for vehicular lateral and follows:
rollover stabilities from a frequency-domain perspective.
 b
These frequency-based parametric bandwidth sensitivity € � Fsrr + Fsrl .br − Fsfr + Fsfl . f + Mb ay hc cos ϕ
 Ix ϕ
analyses also highlight the bandwidth change in the peak 2 2
amplitudes and resonant frequency bandwidths of the
lateral stability and rollover propensity. Thus, complete + Mb ghc sin ϕ.
frequency-based bandwidth sensitivity simulations would (4)
also provide insights into the on-resonance and off-reso-
nance performance of the lateral stability and rollover The dynamic suspension forces mentioned in the pre-
propensity. vious equations can be derived as follows:
 Fsfr � ksfr zufr − zbfr + csfr zufr − zbfr ,

2. Vehicle Modeling Fsfl � ksfl zufl − zbfl + csfl zufr − zbfl ,
 (5)
A 9-DOF nonlinear vehicle model is developed to describe Fsrr � ksrr zurr − zbrr + csrr zurr − zbrr ,
the vertical and lateral dynamics, including sprung mass Fsrl � ksrl zurl − zbrl + csrl zurr − zbrl .
lateral and vertical motions, roll and pitch rotations of the
sprung mass about the center of gravity axis, yaw rotation of According to geometry relations, body deflections can be
the total vehicle mass, and unsprung mass bounce motions. calculated as
4 Shock and Vibration

 br

 CG

 bf Lr φ

 hC
 θ Mb αy
 Mb
 Lf
 Mb g
 φ

 hCGM
 Ksrl Csrl
 Ksrr Csrr

 Zurr Zurl
 murr murl
 Ksfr Csfr Ksfl Csfl Fyrl
 Ktrl Fyrr
 Ktrr
 ZRrl Fzrl Fzrr
 ZRrr
 Zufr Zufl
 mufr mufl

 Ktfr Ktfl
 ZRfr ZRfl

 (a) (b)

 Figure 1: A seven-degree-of-freedom full-car model.

 bf ϕ bf ϕ Therefore, many empirical static tire models, such as the
 zbfr � zb − lf θ − · zbfl � zb − lf θ + , LuGre model, Burckhardt/Kiencke model, and the Dugoff
 2 2
 (6) model, were developed to describe nonlinear tire charac-
 bϕ bϕ teristics. To simulate a real vehicular response, Pacejka
 zbrr � zb + lr θ + r · zbfl � zb + lr θ − r . Magic Tire Formula (MTF) model is adopted to represent
 2 2
 the response of nonlinear tire forces instead of linear cor-
 Vertical tire forces at each tire, including both static and nering stiffness. In this Paper, the MTF models are easy to
dynamic tire load, can be determined as the following implement and have been widely proved to be accurate in
equation: many vehicle dynamics publications [45]. This tire model
 Mb lr was selected because of its ability to accurately simulate tire
 Fzfr � g + mufr g + ktfr zRfr − zufr , behavior in high lateral acceleration and large tire defa-
 lr + lf
 mation cases. Two tire types with different adhesive coef-
 Mb lr ficients were chosen to address the conflict between the
 Fzfr � g + mufl g + ktfl zRfl − zufl , vehicle rollover propensity and lateral stability. For pure
 lr + lf sideslip conditions, the nonlinear M.F. equations can be
 (7) described as
 Mb l f
 Fzrr � g + murr g + ktrr zRrr − zurr , Fyi � D sin C tan−1 (Bϕ) + Sv ,
 lr + lf
 (8)
 Mb l f E
 Fzrl � g + murl g + ktrr zRrl − zurl . ϕ � (1 − E) αi + Sh + tan−1 B αi + Sh ,
 B
 lr + lf
 where the unit of tire lateral force Fyi and vertical tire force
 In many studies, road input is used as a force directly Fzi is kN, the unit of tire sideslip angle αi is radian, and the
coupled with the tire model resulting from the road profile factors B, C, D, E, Sh , and Sv are stiffness factor, shape factor,
amplitude and the tire’s stiffness and damping [36, 37, 43]. peak value, curvature factor, horizontal shift, and vertical
Inspired by this, we have also considered the road input shift, respectively. The subindex (i) stands for tire left front,
excitation (road amplitude seen in equation (7)) into our left rear, right front, and right rear.
case study as a force resulting from the tire stiffness and
amplitude difference of the road amplitude and unsprung
mass displacement. 2.3. Steering Model. The steering model utilized in this paper
 is a 2-DOFs model, as shown in Figure 2. These 2-DOFs
 donate for the lateral and yaw motions of the vehicle. During
2.2. Tire Model. In the coupled lateral and vertical model, the the cornering conditions, the lateral force is applied to the
vehicle dynamics are caused by the forces and moments C.G. of the vehicle body and thus induced the rollover. The
generated between tires and road surface. It is known that equations of the steering model are given in equations (9)
the calculation of the tire-road friction force represents a and (10). The yaw equation of motion is governed in
great challenge due to its highly nonlinear dependence on equation (9), while the lateral motion equation is given in
many uncontrollable environmental characteristics. equation (10).
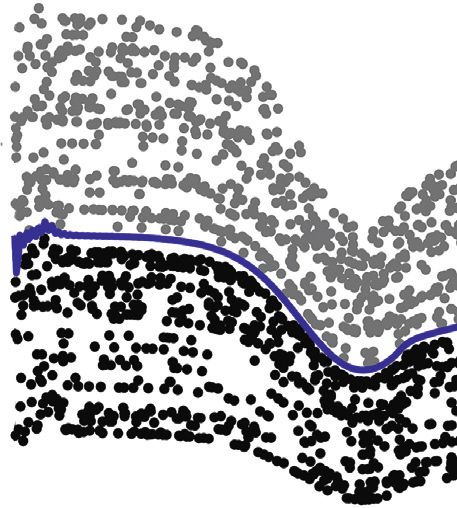
Shock and Vibration 5

 lf frequency and amplitude bandwidth sensitivity to the
 δf proposed parametric analysis. The lateral vehicle dynamic
 αf
 lr υ and roll stability responses were normalized by their ref-
 erence values recorded using the vehicle’s nominal values.
 υy Fundamentally, Monte Carlo simulations analyze uncer-
 F yf
 υx tainties in a probabilistic manner, in which the values of the
 αf CG specified parameters are sampled randomly during the
 simulation run depending on the input probability dis-
 tributions [42, 43]. Uniform, normal, and triangular
 F yr probability distributions are examples of input probability
 distributions. The Monte Carlo sensitivity approach, in
 Figure 2: Bicycle steering model. particular, allows for the simulation of real driving cir-
 cumstances in frequency domains [40].
 The conducted simulations started with a time-domain
 Iz r_ � Fyfr cos δf + Fyfl cos δf lf − Fyfr + Fyfl lr , (9)
 sensitivity change analysis of the automobile stability and
 rollover responses (lateral acceleration, roll angle, yaw angle,
Mtot v_y + vx r � Fyfr cos δf + Fyfl cos δf − Fyfr + Fyfl . and sideslip angles) with respect to a variation ratio of ±25%
 (10) of model parameters. During the simulations, a sine-wave
 signal was used with amplitudes of 10 and 20 mm for the left
 The slip angles of the front axle αf and rear axle αr can be and right sides, respectively, with a frequency range of
defined in terms of the variables vy and r and using the 0–30 Hz. During each simulation round for a single pa-
usually small-angle assumptions. rameter sensitivity plot, 1600 sample points are generated for
 vy + lf r randomization of each parameter with respect to the ran-
 αf � δf − , domly sampled frequency. The goal of these sensitivity
 vx
 simulations was to show how sensitive the 9-DOFs car
 (11)
 vy − lb r suspension model’s lateral acceleration, roll angle, yaw angle,
 αr � − . and sideslip angles are to parameter modifications in terms
 vx of the frequency domain.
 The lateral acceleration is Sensitivity simulations are conducted following the
 step-by-step simulation flowchart, as seen in Figure 4.
 ay � v_y + vx r, (12) Firstly, the reference values of the model parameters are
 used for obtaining the reference trends of the investigated
where vx is the straightforward vehicle speed, vy is the lateral model outputs (lateral acceleration, roll angle, and sideslip
vehicle speed, r is the yaw rate, Mtot is the vehicle mass angles). Thereafter, the Monte Carlo simulations are per-
including sprung and unsprung masses, and δf denotes the formed after setting and initializing the Monte Carlo al-
front wheel steering angle. gorithm parameters, including the sampling parameters of
 both the excitation frequency and the picked parameter.
3. Parametrical Sensitivity Simulation Setup During the proposed Monte Carlo trials, the input exci-
 tation frequency is uniformly sampled in the range of
From parameter sampling based on Monte Carlo principles 0–30 Hz to include the well-known modal resonant fre-
to results analysis, a comprehensive workflow diagram and quencies of the automobile stability and handling criteria.
modeling assembly are shown in Figure 3. To begin with, On the other hand, the investigated parameters are uni-
the Mote-Carlo technique was used to sample parameters. formly distributed with ±25% based on their reference
The input forces are then completed using the road exci- values. During the planned simulations, each investigated
tation and generated parameters. Following that, the parameter is sampled based on the uniform probability
Pacejika Magic tire model is used to bridge the gap between function with 40 samples per parameter, in which each
the vehicle handling model and the road input. The Magic investigated response has 1600 simulation results to gen-
Formula (MF) tire model is used because it is simple to use erate the plotted sensitivity figures. The selected parameters
and has been demonstrated to be accurate in several vehicle of the 7-DOFs vehicle suspension and roll model include
dynamics simulations. The dynamic tire load (DTL) plays a suspension stiffnesses (Ksf and Ksr), damping coefficients
vital role as it is the primary link between the vertical and (Csf and Csr), wheelbase (L), wheel track (B), and center of
lateral forces exerted on the road. The lateral acceleration, gravity height (hcg). Variation of parameters could be
which is the principal cause of the vehicle’s body roll physically achieved either by changes in materials,
motion, is calculated using the steering and yawing motion manufacturing processes, or vehicle type. The main reason
model. The steering model uses the lateral force provided for this is that vehicle initial parameters and suspension
by the tire model to predict lateral acceleration. The characteristics are the most effective parameters for de-
MATLAB/Simulink was used to run the vehicle model’s termining lateral stability and rollover behavior of the
equation of motion. The bandwidth sensitivity simulation vehicle and roll angle threshold, as mentioned in the pa-
results were recorded in RMS and Peak values to show the per’s literature section. Secondly, the majority of time-

6 Shock and Vibration

 f(x) Road Excitation
 (a)
 Frequency sampling
 (Zi) Steering wheel
 ×10–3 Lateral Roll Angle

 Amplitude (m)
 2 angle (δf)
 1 0 Acceleration
 b–a –2
 0 1 2 3 4 5
 Time

 x
 a b Fzi = Fsti + DTLi

 Vertical
 f(x) (b) Dynamics Lateral
 1 Front SS Angle Rear SS Angle
 σ 2π (vertical Dynamics
 parameter values
 Load of original

 oscillations, Fzi Pacejka Magic Fyi (Lateral,
 1 wheel motions, Tire Model Yawing, and
 σ 2πe rolling motions Steering
 and pitching motions)
 motions)
 x υx
 αf
 μ–σ μ μ+σ
 αr Record, plot and analysis of the results
 Parameters Sampling Step Assembly of Vehicle Model and Monte-Carlo Parameters

 Figure 3: Complete workflow diagram and modeling assembly from parameters sampling to results analysis.

domain parametric research has concentrated on these rollover responses until all defined model parameters
variables, which have a strong relationship with lateral and are investigated.
roll stability. In this regard, the aforementioned parame-
ters, which are the most influential, were also considered in 4. Results and Discussion
our frequency-domain parametric sensitivity simulations.
The concluded results of these parametrical bandwidth Speaking about the results’ correctness and model validity,
sensitivity simulations can also guide the control approach the primary simulation results and trends reported in Fig-
to enhance automobile handling, stability, and rollover ure 5 normally appeared and are in agreement with similar
responses. In Figure 4, the detailed schematic flow diagram results in Refs. [2, 12, 46]. Figure 5 depicts the vehicle’s
of the conducted bandwidth parametrical sensitivity sim- lateral acceleration, roll angle, roll rate, and yaw rate during
ulation is clarified. The simulation procedures can be the fishhook maneuver. These initial findings are essentially
highlighted as follows: identical and in good agreement with those found in the
 (1) In the first simulation step, the reference parameters literature, indicating that the models used are valid for
 are loaded, and after that, the typical trends of the further study and simulation.
 lateral acceleration, roll angle, front sideslip angle, The time-domain-based correlation sensitivity results for
 and rear sideslip angle are calculated with respect to the automobile handling and stability responses, including
 the excitation frequency in the range of 0–30 Hz. lateral acceleration, roll angle, yaw rate, and front and rear
 sideslip angles, are presented in Figure 6 with respect to ±25%
 (2) In the second phase, the Monte Carlo sampling
 variations in each of the chosen parameters based on the
 parameters are initialized with respect to the uniform
 reference parameter value. It is apparent from Figure 6 that
 probability distribution with a sampling of 40
 the lateral acceleration of a vehicle is strongly correlated with
 samples for each selected parameter. In this manner,
 the wheelbase length of the vehicle with a reverse pro-
 the excitation frequency was randomly sampled in
 portionality, i.e., an increase in the wheelbase length reduces
 the range of 0–30 Hz and a sampling of 40 samples.
 the lateral acceleration and thereby enhances the stability of
 The remaining parameters were randomly sampled
 the vehicle. When the wheelbase length decreases by 25%, the
 with a variation of ±25% based on the reference
 lateral acceleration increases by nearly 2%, while a 5% de-
 parameter’s value and 40 samples sampling.
 crease in the lateral acceleration corresponds to a 25% in-
 (3) In this stage, during each simulation round, the crease in the wheelbase length. It can also be concluded from
 lateral acceleration, roll angle, front sideslip angle, Figure 6(a) that the lateral acceleration presents similar
 and rear sideslip angle indexes are calculated and correlations with both the wheel track length and the C.G.
 stored to perform the parametric sensitivity analysis height. These sensitivity correlations and outputs are in good
 in the frequency domain considering the Monte agreement with the results published in Ref. [3].
 Carlo simulations. Conversely, the lateral acceleration responded weakly to
 (4) In the final step, the implemented algorithm picks up ±25% variations in the suspension stiffness [12], damping
 a new parameter to investigate its correlation sen- rate, and tire stiffness, as revealed in Figure 6(a). An analysis
 sitivity versus the defined automobile stability and of how sensitive the roll angle is to the model parameters is
Shock and Vibration 7

 Start

 Step No. #1

 Load reference values of model’s
 parameters

 Calculate the original trends of the automobile's handling
 and stability responses
 (Lateral acceleration; Roll angle; Side slip angles; Yaw rate)

 Step No. #2

 Initialization of Monte Carlo parameters
 Choose parameter to test its sensitivity
 Freq_Samples = 40 , Parameter_Samples = 40
 F_sample = 0, P_sample = 0

 Parameters { Damping coefficients, Spring stiffnesses, Tire stiffnesses, CG positions, and Wheelbase length }
 Random sampling of excitation frequency
 ( Uniform Distribution Function)
 Frequency range = (0-30) Hz,
 F_sample = F_sample +1

 Random sampling of model parameter
 (Uniform Distribution Function)

 Pick the next parameter in the parametrical sensitivity simulations
 Orig_val = Original value & ±25% of Orig_val
 P_sample = P_sample +1

 Calculate the defined output performance,
 including automobile's handling and stability
 responses
 (LAccRMS, RARMS, YRRMS, FSSARMS, RSSARMS)

 P_sample =
 Parameter_Samples No
 ?

 Yes

 F_sample =
 No
 Freq_Samples?

 Yes
 Step No. #3

 Parametrical sensitivity assessment of
 the model outputs versus the model’s
 investigated parameter

 All parameters No
 have been Step No. #4
 investigated?

 Yes
 End

Figure 4: Step-by-step simulation flowchart of the conducted sensitivity simulations (LAccRMS: lateral acceleration RMS; RARMS: role
angle RMS; YRRMS: yaw rate RMS; FSSARMS: front sideslip angle RMS; RSSARMS: rear sideslip angle RMS).

given in Figure 6(b). In Figure 6(b), the vehicle roll angle is wheelbase length. In other words, when the vehicle wheel
strongly correlated first to the wheel track and second to the track length decreases by 25%, the roll angle increases by
C.G. height of the vehicle. The roll angle response presents a nearly 88%, while a 38% decrease in the roll angle is observed,
slight increase with +25% variations in the suspension stiff- corresponding to a 25% increase in the wheel track length.
nesses and damping rates. Conversely, the results show a weak Referring to Figures 6(c)–6(e), an analysis of how sensitive the
correlation and sensitivity to the variation in the vehicle sideslip and yaw angles are to the model parameters indicates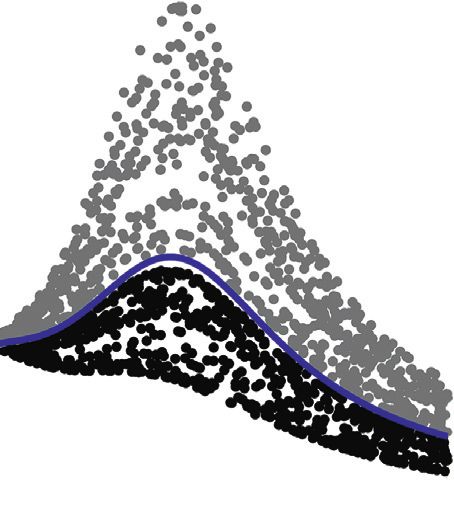
8 Shock and Vibration

 10 10

 Lateral Acc. (m/s2)

 Roll Angle (deg)
 0 0

 -10 -10
 0 5 10 0 5 10
 Time (s) Time (s)

 50 50
 Roll Rate (deg/s)

 Yaw Rate (deg/s)
 0 0

 -50 -50
 0 5 10 0 5 10
 Time (s) Time (s)
 Figure 5: Primary results of the assembled 9-DOF nonlinear vehicle model under Fishhook Maneuver.

that both the sideslip and yaw angles are robustly correlated factor for the other variations. It can also be seen that ve-
with the vehicle wheelbase length. Conversely, the results hicles with increased front damping present lower lateral
indicate that the damping coefficients and suspension stiff- and roll stabilities during a fishhook maneuver than a
nesses hardly influence the sideslip and yaw angles. When the standard vehicle.
vehicle wheelbase length decreases by 25%, the front sideslip,
rear sideslip, and yaw angles increase by nearly 30, 18, and 3%,
respectively. In comparison, these responses decrease by 28, 4.2. Rear Damping Coefficient. The sensitivity results for
19, and 6%, respectively, for a 25% increase in the vehicle the automobile handling and stability responses (lateral
wheelbase length. These results are similar to Ref. [3], who acceleration, roll angle, and front and rear sideslip angles)
also found that vehicles with narrower wheel track widths with respect to the rear suspension damping coefficient
have an increased rollover propensity. are shown in Figure 8. In terms of the lateral acceleration
 response in Figure 8(a), the lateral acceleration root mean
 square (RMS) peak magnitude drops by nearly 2%,
4.1. Front Damping Coefficient. Figure 5 shows the Monte corresponding to a 25% increase in the rear damping,
Carlo parametric sensitivity results for the lateral accel- which infers that the lateral acceleration responds slightly
eration, roll angle, and sideslip angles with respect to the to the variation in the rear damping coefficient. Referring
front damping rate parameter. The front damping coef- to Figures 8(c) and 8(d), the variation in the rear sus-
ficient is varied using its nominal value and a standard pension damping rate (±25% of the reference value)
deviation of 25%. Changing the front damping results in indicates higher sensitivity changes in the magnitudes of
significant variations in the abovementioned responses. the front and rear sideslip angles. Conversely, the RMS
However, the modal resonant frequencies are hardly trends of both the lateral acceleration and the roll angle
changed. In Figures 7(a) and 7(b), in terms of the peak present lower sensitivities than the sideslip angles, as
amplitude, the lateral acceleration and roll angle indicated in Figures 8(a) and 8(b). When the rear
responded remarkedly to the tuning of the front sus- damping coefficient drops to 25% of its nominal value, the
pension damping at a modal-resonant frequency of ap- peak amplitudes of the front and rear sideslip angles
proximately 11 Hz. The resonance of the front and rear increase by 20% and 27%, respectively, without a sig-
sideslip angles is located at nearly 20 Hz, as shown in nificant shift in their resonant frequencies.
Figures 7(c) and 7(d). However, when the rear damping parameter increases by
 In Figure 7(a), it is inferred that the peak value of the 25%, the sideslip angles of the front and rear tires decrease by
lateral acceleration drops from 5.11 m/s2 at the reference 19% and 28%, respectively. Therefore, the sideslip angles are
damping value to 4.64 m/s2, showing a reduction ratio of remarkedly correlated with the suspension damping pa-
10% when the front damping rate decreases by 25%. The rameter and are inversely proportional to the damping
peak value decreases from 2.1° at the nominal damping to coefficient variation. The modal resonant frequencies of the
1.7° in the roll angle, resulting in a reduction ratio of 20%, as front and rear sideslip angles shift forward somewhat by
seen in Figure 7(b). The sideslip angles present approxi- almost 1.3 and 0.7 Hz, respectively, as seen in Figures 8(c)
mately similar sensitivities with respect to the front damping and 8(d), with a ±25% variation in the rear damping rate.
Shock and Vibration 9

 1.04 2.2
 Lateral Acceleration Sensitivity Change

 Deterioration

 Deterioration
 Stability
 1.8

 Rollover
 1.02

 Roll Angle Sensitivity change
 1 1.4

 0.98 1
 Enhancing
 Stability

 Enhancing
 Rollover
 0.96
 0.6
 Parameter Parameter Parameter Parameter
 Decreasing Increasing Decreasing Increasing
 0.94
 0.2
 0.7 0.8 0.9 1 1.1 1.2 1.3 0.7 0.8 0.9 1 1.1 1.2 1.3
 Change In Parameter Percent Change In Parameter Percent

 CSF KSF KTF CSF KSF KTF
 CSR KSR KTR CSR KSR KTR
 hcgm L B hcgm L B

 (a) (b)

 1.4 1.2
 Deterioration

 Deterioration
 Front SS Angle Sensitivity Change

 Rear SS Angle Sensitivity Change
 Stability

 1.3 Stability
 1.1
 1.2

 1.1
 1
 1

 0.9
 Enhancing

 Enhancing

 0.9
 Stability

 Stability

 0.8
 Parameter Parameter Parameter Parameter
 0.7 0.8
 Decreasing Increasing Decreasing Increasing

 0.7 0.8 0.9 1 1.1 1.2 1.3 0.7 0.8 0.9 1 1.1 1.2 1.3
 Change In Parameter Percent Change In Parameter Percent
 CSF KSF KTF CSF KSF KTF
 CSR KSR KTR CSR KSR KTR
 hcgm L B hcgm L B

 (c) (d)
 Figure 6: Continued.
10 Shock and Vibration

 1.05

 Deterioration
 Rollover
 1.03

 Yaw Rate Sensitivity Change
 1.01

 0.99

 Enhancing
 Rollover
 0.97

 0.95
 Parameter Parameter
 0.93 Decreasing Increasing

 0.7 0.8 0.9 1 1.1 1.2 1.3
 Change In parameter percent
 CSF KSF KTF
 CSR KSR KTR
 hcgm L B
 (e)

Figure 6: Simulation results for the automobile handling and stability response sensitivities with respect to the time-domain results.
(a) Lateral acceleration response; (b) roll angle response; (c) front sideslip angle response; (d) rear sideslip angle response; (e) yaw rate
angle response.

 5.8 3.5

 5.6
 Lateral Acceleration (m/s2)

 3
 5.4
 Roll Angle (deg)

 5.2 2.5

 5
 2
 4.8

 4.6 1.5
 0 5 10 15 20 25 30 0 5 10 15 20 25 30
 Road Input Excitation Frequency (Hz) Road Input Excitation Frequency (Hz)
 Original Value (CF) Original Value (CF)
 -25% of Ref. value -25% of Ref. value
 +25% of Ref. value +25% of Ref. value
 (a) (b)
 Figure 7: Continued.
Shock and Vibration 11

 10 8
 Front Side Slip Angle (deg)

 6

 Rear Side Slip Angle (deg)
 8

 4

 6
 2

 4 0
 0 5 10 15 20 25 30 0 5 10 15 20 25 30
 Road Input Excitation Frequency (Hz) Road Input Excitation Frequency (Hz)
 Original Value (CF) Original Value (CF)
 -25% of Ref. value -25% of Ref. value
 +25% of Ref. value +25% of Ref. value
 (c) (d)

Figure 7: Sensitivity simulation results for the automobile handling and stability responses with respect to the front damping coefficient
parameter. (a) Lateral acceleration response; (b) roll angle response; (c) front sideslip angle response; (d) rear sideslip angle.

 5.8 3.5
 Lateral Acceleration (m/s2)

 5.6
 3
 Roll Angle (deg)

 5.4

 2.5
 5.2

 5 2
 0 5 10 15 20 25 30 0 5 10 15 20 25 30
 Road Input Excitation Frequency (Hz) Road Input Excitation Frequency (Hz)
 Original Value (CR) Original Value (CR)
 -25% of Ref. value -25% of Ref. value
 +25% of Ref. value +25% of Ref. value
 (a) (b)
 Figure 8: Continued.
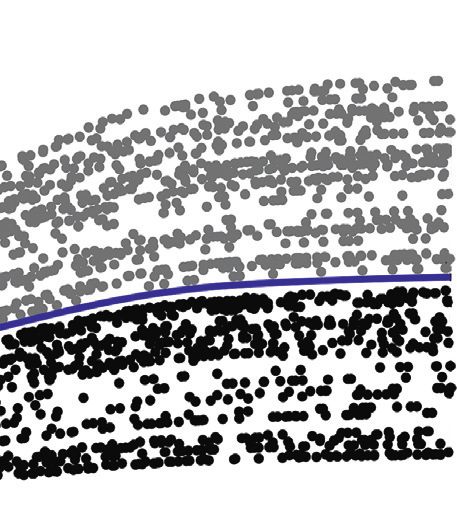
12 Shock and Vibration

 10 9

 8
 Front Side Slip Angle (deg)

 Rear Side Slip Angle (deg)
 8
 6

 6
 4

 4 2
 0 5 10 15 20 25 30 0 5 10 15 20 25 30
 Road Input Excitation Frequency (Hz) Road Input Excitation Frequency (Hz)
 Original Value (CR) Original Value (CR)
 -25% of Ref. value -25% of Ref. value
 +25% of Ref. value +25% of Ref. value
 (c) (d)

Figure 8: Sensitivity simulation results for the automobile handling and stability responses with respect to the rear damping coefficient
parameter. (a) Lateral acceleration response; (b) roll angle response; (c) front sideslip angle response; (d) rear sideslip angle.

4.3. Front Suspension Spring Stiffness. In Figure 9, the front when the rear suspension stiffness (Ksr) increases by 25% with
suspension spring stiffness was randomly sampled with respect to the reference stiffness. Conversely, when the refer-
respect to the reference stiffness value and the ±25% vari- ence spring stiffness (Ksr) is reduced by 25%, the roll angle
ation to investigate the sensitivity of the automobile stability magnitude increases by nearly 15%, deteriorating the auto-
and rollover responses in the frequency domain. Based on mobile rollover performance. Unlike the roll angle correlation
the frequency response amplitude in Figure 9(a), with a with respect to the rear spring stiffness coefficient, both the
±25% variation in the front axle spring stiffness, the lateral front and rear sideslip angles present an inverse correlation
acceleration bandwidth is not significantly influenced by the with respect to the spring stiffness variation. The sideslip angle
variation in the front suspension spring rate. However, as increases when the stiffness value increases and vice versa, and
indicated in Figures 9(b)–9(d), the bandwidths of both the the automobile stability is inversely proportional to the sus-
roll and sideslip angles are influenced by the ±25% sampled pension stiffness coefficient. Figures 8(c) and 8(d) show that the
spring stiffness. The peak amplitudes of the roll and front frequency response magnitudes of the front and rear sideslip
and rear sideslip angles increase by 13, 21, and 28%, re- angles increase by approximately 15 and 20%, respectively,
spectively. Note that increasing the spring stiffness decreases when the stiffness value (Ksr) increases by 25% with respect to
the roll and sideslip angles, which enhances the automobile the reference. Conversely, when the reference spring stiffness
rollover and stability and vice versa. It can also be inferred (Ksr) is reduced by 25%, the front and rear sideslip angles’ peak
that changing the suspension stiffness, which can be magnitudes decrease by nearly 13 and 17%, respectively.
achieved by variations in the materials, manufacturing
processes, and vehicle type, has nearly no apparent effect on
the modal resonant frequencies of the automobile stability 4.5. Front Tire Stiffness. Figure 11 reports a complete
and rollover responses. bandwidth sensitivity analysis of the sensitivities of the
 lateral acceleration, roll angle, and front and rear sideslip
 angle with respect to the front tire stiffness variation. In these
4.4. Rear Suspension Spring Stiffness. Bandwidth analyses of simulation analyses, the front tire stiffness (Ktf ) was ran-
how sensitive the automobile stability and rollover attitudes are domly sampled with respect to the reference Ktf value and
regarding the rear suspension stiffness parameter are high- the ±25% variation to investigate the bandwidth sensitivity
lighted in Figure 10. In general, the automobile stability in response of the automobile rollover stability in the frequency
terms of the lateral vehicle acceleration presents a low corre- domain. In general, all the automobile stability and rollover
lation and bandwidth sensitivity with respect to the ±25% responses present higher bandwidth sensitivities in terms of
randomly sampled stiffness (Ksr). Otherwise, the bandwidth the amplitude and modal resonant frequency bandwidths
analyses in Figures 10(b)–5(d) illustrate the precise bandwidth correlated to the tire stiffness variation, highlighting the
sensitivity of the roll and sideslip angles’ magnitudes, dem- significant influence of the tire stiffness on automobile
onstrating a slight shift in their modal resonant frequencies. In stability and rollover.
Figure 10(b), the frequency response magnitude of the roll The lateral acceleration bandwidth sensitivity analysis in
angle presents a nearly 9% drop in the peak magnitude value Figure 11(a) indicates that the lateral acceleration is highly
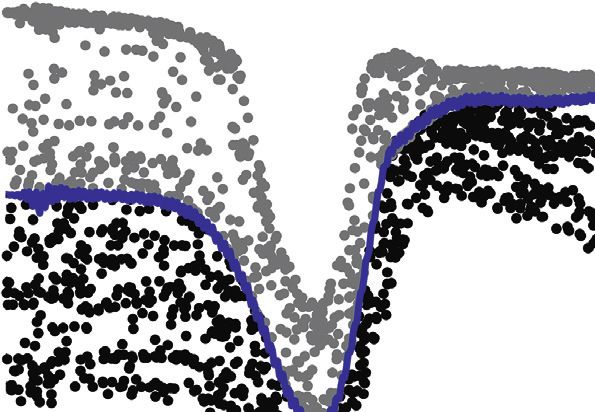
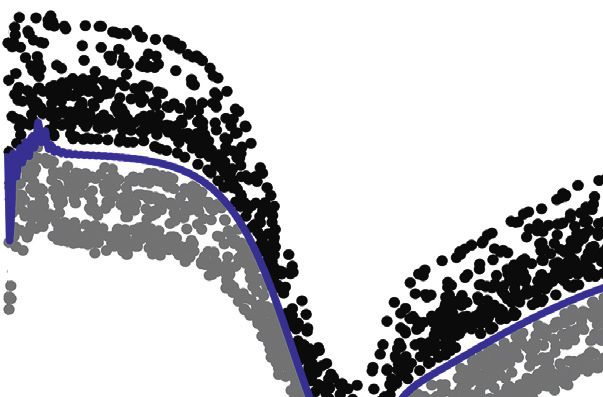
Shock and Vibration 13

 5.8 4

 3.5
 Lateral Acceleration (m/s2)

 5.6

 Roll Angle (deg)
 3
 5.4
 2.5

 5.2
 2

 5 1.5
 0 5 10 15 20 25 30 0 5 10 15 20 25 30
 Road Input Excitation Frequency (Hz) Road Input Excitation Frequency (Hz)
 Original Value (KSF) Original Value (KSF)
 -25% of Ref. value -25% of Ref. value
 +25% of Ref. value +25% of Ref. value
 (a) (b)
 11 10

 10
 8
 Front Side Slip Angle (deg)

 Rear Side Slip Angle (deg)

 9

 6
 8

 7
 4

 6
 2
 5

 4
 0 5 10 15 20 25 30 0 5 10 15 20 25 30
 Road Input Excitation Frequency (Hz) Road Input Excitation Frequency (Hz)
 Original Value (KSF) Original Value (KSF)
 -25% of Ref. value -25% of Ref. value
 +25% of Ref. value +25% of Ref. value
 (c) (d)

Figure 9: Sensitivity simulation results for automobile handling and stability responses with respect to the front spring stiffness coefficient
parameter. (a) Lateral acceleration response; (b) roll angle response; (c) front sideslip angle response; (d) rear sideslip angle.

correlated to the vehicle tire stiffness. The lateral vehicular frequency. The automobile roll angle appears to have an
stability is inversely proportional to the vertical tire stiffness inversely proportional correlation with the tire stiffness, as
coefficient (Ktf ). The lateral acceleration magnitude de- seen in Figure 11(b). When Ktf is decreased by 25%, the roll
creases from 5.11 m/s2 to 4.55 m/s2, a nearly 11% drop in the angle’s peak amplitude increases by nearly 26%, accompa-
peak magnitude value, when the front tire stiffness (Ktf ) is nied by a 1.32 Hz rearward shift in its modal resonant
increased by 25%. The model resonant frequency corre- frequency. Conversely, when the reference value of Ktf is
sponding to the lateral vehicle acceleration’s peak magnitude increased by 25%, the magnitude of the roll angle response
is straightforwardly shifted from 10.52 to 12.77 Hz. Con- decreases by approximately 33%, accompanied by a 0.93 Hz
versely, when the reference tire stiffness (Ktf ) is reduced by forward shift in its resonant frequency. Identical to the
25%, the lateral acceleration magnitude increases by nearly correlations of both the lateral acceleration and the roll angle
3%, deteriorating the automobile lateral stability. Similar to with respect to the ±25% randomly sampled tire stiffness, the
the lateral acceleration sensitivity performance, the roll angle sideslip angles and the tire stiffness coefficient are inversely
response is strongly correlated with the tire stiffness vari- proportional, as confirmed in Figures 11(c) and 11(d).
ation, including an apparent shift in its modal resonant However, when Ktf is decreased by 25%, the first modal peak
14 Shock and Vibration

 5.8 4
 Lateral Acceleration (m/s2)

 5.6
 3.5

 Roll Angle (deg)
 5.4

 2.5
 5.2

 5 1.5
 0 5 10 15 20 25 30 0 5 10 15 20 25 30
 Road Input Excitation Frequency (Hz) Road Input Excitation Frequency (Hz)
 Original Value (KSR) Original Value (KSR)
 -25% of Ref. value -25% of Ref. value
 +25% of Ref. value +25% of Ref. value
 (a) (b)
 10 9

 8
 Front Side Slip Angle (deg)

 Rear Side Slip Angle (deg)

 8
 6

 6
 4

 4 2
 0 5 10 15 20 25 30 0 5 10 15 20 25 30
 Road Input Excitation Frequency (Hz) Road Input Excitation Frequency (Hz)

 Original Value (KSR) Original Value (KSR)
 -25% of Ref. value -25% of Ref. value
 +25% of Ref. value +25% of Ref. value
 (c) (d)

Figure 10: Sensitivity simulation results for automobile handling and stability responses with respect to the rear spring stiffness coefficient
parameter. (a) Lateral acceleration response; (b) roll angle response; (c) front sideslip angle response; (d) rear sideslip angle.

magnitudes of the front and rear sideslip angles increase by 4.6. Rear Tire Stiffness. The sensitivities of the automobile
nearly 31 and 53%, respectively. Meanwhile, the second- stability and rollover attitudes to the rear tire stiffness (Ktr)
modal-peak magnitudes of the front and rear sideslip angles are presented in Figure 12. Here, Ktr was randomly sampled,
increase by nearly 256 and 376%, respectively, deteriorating similar to the parameters mentioned above, based on a ±25%
the automobile stability. variation rate and the reference tire stiffness (Ktr) with re-
 This is related to the tire contact patch, which de- spect to a randomly sampled excitation frequency.
creases with higher tire stiffnesses, leading to a decrease According to the frequency/amplitude response bandwidth
in the tread’s cornering stiffness. If the front cornering plots provided in Figure 12, the automobile stability and
stiffness of the vehicle is smaller, the vehicle will expe- rollover responses, except the roll angle response, indicate a
rience understeering behavior, making the vehicle exhibit clear sensitivity to the amplitude and the modal resonant
a broader understeer tendency [47]. We can infer that frequency bandwidth correlated with the variation in the
better vehicular directional stability is provided by a rear tire stiffness. In Figure 12(a), in the model resonant
larger restoring moment coefficient and a smaller steering frequency range, the magnitude of the lateral acceleration
stiffness, and vice versa. decreases from 5.128 to 5.04 m/s2, a nearly 2% drop
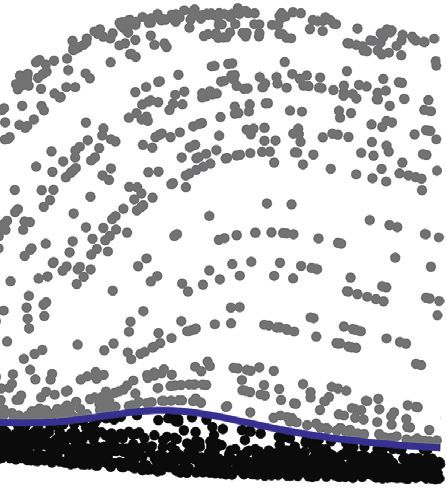
Shock and Vibration 15

 6 3.5

 3
 Lateral Acceleration (m/s2)

 5.6

 Roll Angle (deg)
 2.5
 5.2
 2

 4.8
 1.5

 4.4 1
 0 5 10 15 20 25 30 0 5 10 15 20 25 30
 Road Input Excitation Frequency (Hz) Road Input Excitation Frequency (Hz)
 Original Value (KTF) Original Value (KTF)
 -25% of Ref. value -25% of Ref. value
 +25% of Ref. value +25% of Ref. value
 (a) (b)
 40 40
 Front Side Slip Angle (deg)

 30 30
 Rear Side Slip Angle (deg)

 20 20

 10 10

 0 0
 0 5 10 15 20 25 30 0 5 10 15 20 25 30
 Road Input Excitation Frequency (Hz) Road Input Excitation Frequency (Hz)
 Original Value (KTF) Original Value (KTF)
 -25% of Ref. value -25% of Ref. value
 +25% of Ref. value +25% of Ref. value
 (c) (d)

Figure 11: Sensitivity simulation results for automobile handling and stability responses with respect to the front tire stiffness coefficient
parameter. (a) Lateral acceleration response; (b) roll angle response; (c) front sideslip angle response; (d) rear sideslip angle.

corresponding to a 25% increase in Ktr, and from 5.128 to construction, and manufacturing processes, and vehicle type
4.84 m/s2, a nearly 4% drop corresponding to a 25% decrease has a clear and significant effect on the automobile stability
in Ktr. Unlike the roll angle’s sensitivity to the front tire and rollover responses in terms of the bandwidth of both the
stiffness variation, the roll angle barely responds to the magnitudes and modal resonant frequencies.
variation in the rear tire stiffness during the sensitivity
simulations (see Figure 12(b)).
 As illustrated in Figures 12(c) and 12(d), when Ktr is 4.7. Longitudinal C.G. Position. Figures 13 and 14 illustrate
increased by 25%, the front and rear sideslip angles’ modal bandwidth sensitivity analyses of the automobile stability
peak magnitudes increase by nearly 24 and 36%, respec- and rollover attitudes versus longitudinal and vertical
tively. However, when Ktr is decreased by 25%, the front and C.G. positions. The magnitude bandwidth of the lateral
rear sideslip angles’ peak magnitudes decreased by nearly 51 acceleration, roll angle, and sideslip angles present higher
and 72%, respectively, deteriorating automobile stability. sensitivity correlations than the longitudinal C.G. posi-
 In conclusion, it is inferred that changing the tire tion and the C.G. height. Figure 13 shows the effect of
stiffness, which could be done by the variations of materials, shifting C.G. either forward or rearward by ±25% with
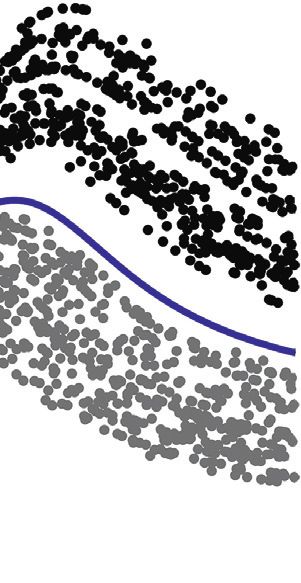
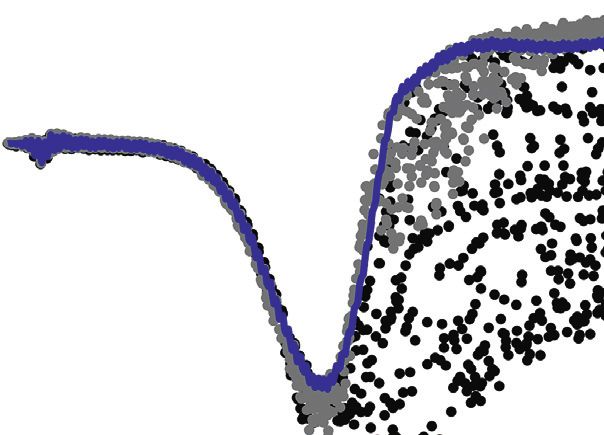
16 Shock and Vibration

 6 3.5

 5.8
 Lateral Acceleration (m/s2)

 5.6 3

 Roll Angle (deg)
 5.4

 5.2 2.5

 5

 4.8 2
 0 5 10 15 20 25 30 0 5 10 15 20 25 30
 Road Input Excitation Frequency (Hz) Road Input Excitation Frequency (Hz)
 Original Value (KTR) Original Value (KTR)
 -25% of Ref. value -25% of Ref. value
 +25% of Ref. value +25% of Ref. value
 (a) (b)
 18 20

 16
 Front Side Slip Angle (deg)

 16
 Rear Side Slip Angle (deg)

 12
 12
 8

 8
 4

 4 0
 0 5 10 15 20 25 30 0 5 10 15 20 25 30
 Road Input Excitation Frequency (Hz) Road Input Excitation Frequency (Hz)
 Original Value (KTR) Original Value (KTR)
 -25% of Ref. value -25% of Ref. value
 +25% of Ref. value +25% of Ref. value
 (c) (d)

Figure 12: Sensitivity simulation results for automobile handling and stability responses with respect to the rear tire stiffness coefficient
parameter. (a) Lateral acceleration response; (b) roll angle response; (c) front sideslip angle response; (d) rear sideslip angle.

respect to its reference position for randomly sampled position of a vehicle. Conversely, when C.G. is rearward
excitation frequencies. In simulations, a +25% variation shifted (+25% with respect to the reference C.G. posi-
implies the C.G. is shifted rearward to the rear axle, while tion), the lateral acceleration, roll angle, and front and
a −25% means that the C.G. is shifted toward the front rear sideslip angles increase, deteriorating the automobile
axle. According to the frequency/amplitude response stability and rollover dynamics. Figures 13(c) and 13(d)
bandwidth plots provided in Figure 13, the automobile correspond to a 25% rearward shift in C.G., the peak
stability and rollover responses exhibited an apparent magnitudes of the front and rear sideslip angles increase
sensitivity to the longitudinal C.G. distance variation. by nearly 255 and 478%, respectively. Conversely, with a
Moving C.G. forward (−25% with respect to the reference 25% forward shift in C.G., the front and rear sideslip
C.G. position) resulted in superior stability and rollover angles’ peak magnitudes decrease by nearly 24 and 35%,
dynamics because all automobile stability and rollover respectively, improving the automobile stability. The
responses decrease with the forward shifting of the C.G. investigated automobile stability and rollover responses
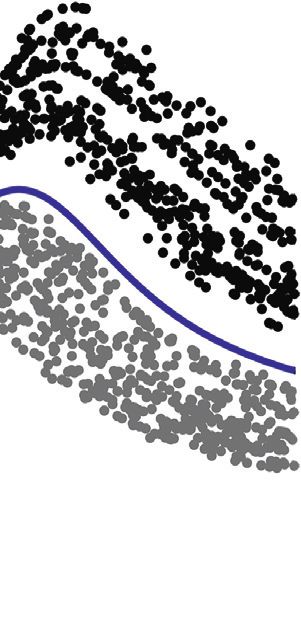
Shock and Vibration 17

 6 3.6

 5.8
 3.2
 Lateral Acceleration (m/s2)

 5.6

 Roll Angle (deg)
 2.8
 5.4
 2.4
 5.2

 2
 5

 4.8 1.6
 0 5 10 15 20 25 30 0 5 10 15 20 25 30
 Road Input Excitation Frequency (Hz) Road Input Excitation Frequency (Hz)
 Original Value (CG Location) Original Value (CG Location)
 -25% of Ref. value -25% of Ref. value
 +25% of Ref. value +25% of Ref. value
 (a) (b)
 40 40

 35
 Front Side Slip Angle (deg)

 Rear Side Slip Angle (deg)

 30 30

 25

 20 20

 15

 10 10

 5

 0 0
 0 5 10 15 20 25 30 0 5 10 15 20 25 30
 Road Input Excitation Frequency (Hz) Road Input Excitation Frequency (Hz)
 Original Value (CG Location) Original Value (CG Location)
 -25% of Ref. value -25% of Ref. value
 +25% of Ref. value +25% of Ref. value
 (c) (d)

Figure 13: Sensitivity simulation results for automobile handling and stability responses with respect to the longitudinal C.G. position
parameter. (a) Lateral acceleration response; (b) roll angle response; (c) front sideslip angle response; (d) rear sideslip angle.

illustrate no apparent effects of the frequency bandwidth sideslip angles in Figures 14(c) and 14(d), the closer C.G.
of the model resonant frequencies on the lateral accel- is to the ground, the better the rollover stability and vice
eration, roll angle, and front and rear sideslip angles. versa. When the vehicular C.G. height is increased by
 +25% related to the reference vertical C.G. position, the
 peak magnitudes of the front and rear vehicle sideslip
4.8. C.G. Height. The sensitivities of the automobile sta- angles increase by approximately 30 and 40%, respec-
bility and rollover dynamics versus the C.G. height of the tively. Conversely, when the vehicular C.G. height is
vehicle are shown in Figures 14. Figure 14 demonstrates decreased by −25%, the peak magnitudes of the front and
the inconsistent effects of the C.G. height, where the rear sideslip angles decrease by nearly 15 and 18%, re-
lateral acceleration trend decreases with respect to the spectively, improving the automobile stability. Note that
increasing C.G. height of the vehicle, in opposition to the there is no significant or apparent change in the model
roll angle trends and front and rear sideslip angles. resonant frequencies of the sideslip angles’ peak
According to the magnitude bandwidth of the vehicle magnitudes.
18 Shock and Vibration

 5.8 6

 5
 Lateral Acceleration (m/s2)

 5.6
 4

 Roll Angle (deg)
 5.4 3

 2
 5.2
 1

 5 0
 0 5 10 15 20 25 30 0 5 10 15 20 25 30
 Road Input Excitation Frequency (Hz) Road Input Excitation Frequency (Hz)
 Original Value (hcg) Original Value (hcg)
 -25% of Ref. value -25% of Ref. value
 +25% of Ref. value +25% of Ref. value
 (a) (b)
 12 10
 Front Side Slip Angle (deg)

 Rear Side Slip Angle (deg)

 10 8

 8 6

 6 4

 4 2
 0 5 10 15 20 25 30 0 5 10 15 20 25 30
 Road Input Excitation Frequency (Hz) Road Input Excitation Frequency (Hz)
 Original Value (hcg) Original Value (hcg)
 -25% of Ref. value -25% of Ref. value
 +25% of Ref. value +25% of Ref. value
 (c) (d)

Figure 14: Sensitivity simulation results for the automobile handling and stability responses with regard to the C.G. height parameter.
(a) Lateral acceleration response; (b) roll angle response; (c) front sideslip angle response; (d) rear sideslip angle.

4.9. Wheelbase Length. Figure 15 illustrates the sensitivities is increased by 25% with respect to its reference value, the
of the automobile stability and rollover dynamics to the peak magnitudes of the front and rear vehicle sideslip angles
wheelbase parameter. According to the sensitivity results decrease by approximately 25 and 17%, respectively.
provided in Figure 15, the vehicle wheelbase length exerts a Conversely, when the vehicle wheelbase length is de-
considerable influence on the lateral acceleration and creased by 25%, the peak magnitudes of the front and rear
sideslip angles. Meanwhile, the wheelbase length variation sideslip angles increase by nearly 31 and 29%, respectively,
only slightly influences the vehicular rollover response, as improving the automobile stability. These results confirm
shown in Figure 15(b). In Figure 15(a), the lateral accel- the association between the wheelbase length and the overall
eration trend decreases with respect to increasing wheelbase vehicular lateral and roll stabilities. Therefore, vehicles with
length, particularly at low frequencies. However, the front longer wheelbase lengths provide better overall stability than
and rear sideslip angles decrease significantly at high fre- those with comparatively short wheelbase lengths.
quencies with higher wheelbase lengths, as shown in Figure 16 summarizes the bandwidth sensitivity results
Figures 15(c) and 15(d). When the vehicle wheelbase length for the automobile handling and stability criteria with ±25%
You can also read