Analysis of Effects of Rock Physical Properties Changes from Freeze-Thaw Weathering in Ny-Ålesund Region: Part 1-Experimental Study
←
→
Page content transcription
If your browser does not render page correctly, please read the page content below
applied
           sciences
Article
Analysis of Effects of Rock Physical Properties
Changes from Freeze-Thaw Weathering in
Ny-Ålesund Region: Part 1—Experimental Study
Keunbo Park 1 , Kiju Kim 2 , Kichoel Lee 3, *        and Dongwook Kim 3, *
 1    Division of Polar Climate Sciences, Korea Polar Research Institute, Incheon 21990, Korea; kbstar@kopri.re.kr
 2    Geophysical and Geotechnical Engineering Research Division, BEarth, Inc., Chuncheon 24341, Korea;
      kiju7330@gmail.com
 3    Department of Civil and Environmental Engineering, Incheon National University, Incheon 22012, Korea
 *    Correspondence: wlq4619@inu.ac.kr (K.L.); dwkim@inu.ac.kr (D.K.); Tel.: +82-32-835-8461 (D.K.)

 Received: 5 February 2020; Accepted: 27 February 2020; Published: 2 March 2020

 Abstract: In order to investigate the weathering characteristics of rocks in response to freeze-thaw
 conditions in northern latitudes, we analysed meteorological data from the Ny-Ålesund region
 in Norway, and observed changes in the physical and mechanical properties of rocks of dolomite
 and quartzite. To assess the effects of freeze-thaw weathering on these rock properties, 900 cycles
 of long-term freeze-thaw tests were conducted for the sampled rocks in two locations. P-wave
 velocity, absorption, shore hardness, and the uniaxial compressive strength of the sampled rocks
 were measured at every 150 cycles in order to analyse physical and mechanical mediator variables
 of freeze-thaw weathering. It was found that an increasing number of freeze-thaw cycle on the
 sampled rocks decreases uniaxial compressive strength, shore hardness, and P-wave velocity and
 increases absorption.

 Keywords: air temperature; freezing-thaw cycle; rock weathering; dolomite; quartzite; rock
 physical property

1. Introduction
      The repetition of freeze and thaw of rocks is largely governed by the local climate. In order to
investigate rock weathering mechanisms due to freeze-thaw cycles, it is important to reflect the unique
properties of the climate and rocks in the region of interest. In addition to reduced strength of the
rock structures themselves, the function of rock structures can also be impaired by weathering [1].
Rocks exposed to extremely low temperature environments in northern latitudes are frozen for a
considerable time of the year. An accurate assessment of the physical and mechanical properties of
these rocks is very important for the evaluation of structural stability to preserve the function of the
rock structure. For example, rock weathering from freeze-thaw induces malfunction or instability
issues in rock related structures.
      Weathered rocks exhibit changes of mechanical, physical, and mineral properties, and more
advanced rock weathering results in even significant changes to structure safety. Thus, the extent of
rock weathering can be evaluated based on factors such as degradation of the actual mineral particles
constituting the rock or weakening of the bonding strength at interface on rocks. Weathering resistance
is a form of durability that influences the lifespan of rocks, and as a major mechanical mediator variable,
durability is an important physical property for determining the structural stability [2]. At high latitude
areas, rocks are exposed to an excessive freezing and thawing environment throughout the year, and
this causes gradual freeze-thaw damage. Rock materials used in cold regions are exposed to at least one

Appl. Sci. 2020, 10, 1707; doi:10.3390/app10051707                                   www.mdpi.com/journal/applsci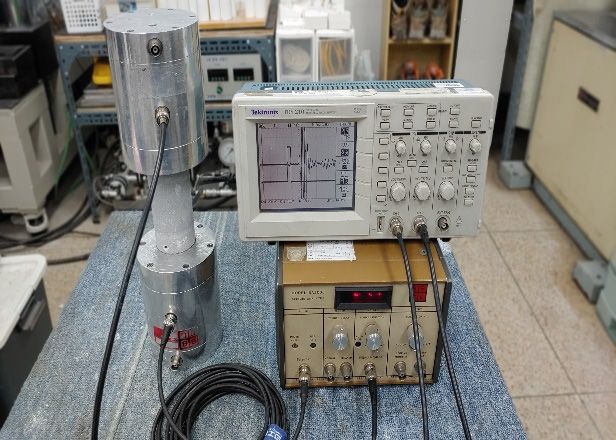
Appl. Sci. 2020, 10, 1707                                                                           2 of 18

cycle of freeze-thaw every year [3]. In particular, freeze-thaw action is one of the strongest mechanisms
of physical weathering, and can rapidly change the physical and mechanical characteristics of rocks
and reduce their durability [4–8].
      Most previous research on the freeze-thaw effects on the mechanical behaviour of rocks has
been conducted on rocks with low-to-moderate hardness [7–10]. The response of harder rocks to
regular freeze-thaw weathering has generally been ignored due to their high strengths or hardnesses.
Meanwhile, freeze-thaw tests have generally been conducted over short periods of time, and researchers
have not been interested in long-term freeze-thaw tests due to various difficulties in testing for long
time under rigorous control of test environments [11]. Therefore, to evaluate the long-term durability
of rock-built structures and to determine suitable maintenance and repair cycles in high northern
latitudes, further research is required on the influences of prolonged exposure to freeze-thaw cycles.
      Many researchers examined changes of various physical and mechanical properties of rocks in a
view of durability with increasing freeze-thaw cycles [7–9,12,13]. Binal and Kasapoglu [7] explored
changes of uniaxial compressive strength (UCS) of Selime (Aksaray) ignimbrite resulting from repetition
of freeze and thaw. Khanlari and Abdilor [8] conducted research on the effect of freeze and thaw
on sand stones. Yavuz et al. [9] developed a model for estimation of rock index characteristics of
carbonate rocks after experiencing freeze and thaw cycles. Jamshidi et al. [12] investigated the effect of
freeze-thaw cycles on long-term durability of various rock building materials.
      Nicholson and Nicholson [14] insisted reduction of strength of 10 different sedimented rocks due
to increased freeze-thaw cycle, and Bortz et al. [15] presented correlations among weathered properties
of limestone, granite, and marble under freeze-thaw cycles from natural and artificial environments. It
was found that the freeze-thaw cycles of 12–16 under artificial condition are equivalent to freeze-thaw
effect of one year under natural condition. However, changes of weathered rock properties became
obvious after 200, 300, and 500 freeze-thaw cycles for limestone, granites, and marble, respectively.
      Other studies also confirmed the changes of rock properties due to freeze-thaw weathering;
therefore, further research is necessary to examine long-term rock durability in high latitude regions
for effective estimation of maintenance and repair time against freeze-thaw cycles in nature [2,16,17].
The researchers emphasized that experience of freeze-thaw cycles of rocks is one of the most significant
physical weathering factors. Therefore, changes of durability and mechanical properties of the rocks
were examined with time. Rock weathering from freeze-thaw cycles also induced many engineering
problems in roads, railways, energy pile lines, building constructions in cold regions [17,18]. For these
reasons, an accurate assessment of durability against rock freeze-thaw weathering is important [4].
      Evaluation of reasonable freeze-thaw rock weathering properties are prerequisite for maintain
important functions of cultural heritages; and it will bring us many benefits in terms of maintenance of
repair of these structures [19]. Especially, protection of cultural heritage sites from freeze-thaw rock
weathering is very important to prevent further deterioration of the heritage structures [16]. Most of
the heritage structures are made of rocks, and understanding of material properties’ changes with time
is essential to protect these heritage structures [20]. Hall [21] claimed that main factors influencing
freeze-thaw rock weathering are freezing strength, velocity, maintained freeze time, and repetitive
actions of freeze and thaw.
      In this study, we aimed to investigate the behaviour of rocks collected from Ny-Ålesund, a
high latitude region, with changes in rock and air temperatures simulating the Ny-Ålesund region
in a laboratory. We collected relatively fresh rock specimens exposed to the surface, and examined
changes in their physical and mechanical rock properties of uniaxial compressive strength (UCS), shore
hardness, absorption, and P-wave velocity with increasing freeze-thaw cycle.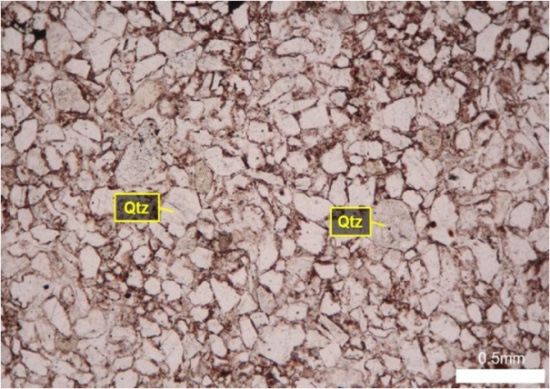
Appl. Sci. 2020, 10, 1707 3 of 18
Appl. Sci. 2020, 10, x FOR PEER REVIEW 3 of 18
2. Topology
2. Topology of
of the
the Survey
Survey Area
Area
The survey
The surveyregionregionis Ny-Ålesund
is Ny-Ålesund (11◦ 54(11°54′41.23″
0 41.23” E, 78◦ 550 31.65” N), in the northwest of Spitsbergen
E, 78°55′31.65″ N), in the northwest of
Island, in theIsland,
Spitsbergen Svalbard Archipelago,
in the Norway, located
Svalbard Archipelago, Norway,approximately 1000 km from
located approximately thekm
1000 North
fromPole
the
(Figure 1). This region consists of a peninsula to the northwest and a bay to
North Pole (Figure 1). This region consists of a peninsula to the northwest and a bay to the east, and the east, and the mean
altitude ◦ C,
−4.1−4.1
the meanisaltitude
8 m. The mean
is 8 m. Theannual precipitation
mean annual and airand
precipitation temperature are 364.6
air temperature mm mm
are 364.6 and and
respectively.
°C, Temperate
respectively. Temperate summers can be
summers canexperienced
be experienced due to thetonorthward
due the northwardpassage of theofwarm
passage Gulf
the warm
Stream,
Gulf but the
Stream, butwinters are very
the winters arecold.
veryThe Ny-Ålesund
cold. The Ny-Ålesund region region
used toused
be a coal-mining region, and
to be a coal-mining the
region,
major rock types consist of sandstone, shale, and coal [22]. In order to assess
and the major rock types consist of sandstone, shale, and coal [22]. In order to assess freeze-thawfreeze-thaw characteristics
of rocks in the Arctic
characteristics of rocksCircle, specimens
in the were collected
Arctic Circle, specimens from Locations
were A and
collected from B in Figure 1, A
Locations using
androcks
B in
that had fallen from rocky outcrops protruding over the shore or rock block
Figure 1, using rocks that had fallen from rocky outcrops protruding over the shore or rock block specimens taken from
the outcrops.
specimens taken from the outcrops.
Freeze-thaw actions
Freeze-thaw actionsare aremost
mostactive at cold
active regions,
at cold such as
regions, high
such aslatitude areas including
high latitude Norway,
areas including
Alaska,
Norway, Alaska, or Canada. Therefore, the study area is selected based on the literature[22]
or Canada. Therefore, the study area is selected based on the literature by Dallmann by
and Buggisch
Dallmann [22] et
andal. Buggisch
[23]. It was reported
et al. [23]. It that,
was at the region
reported that,ofatNy-Ålesund,
the region ofdolomite
Ny-Ålesund,and quartzite
dolomite
are widely
and quartzite distributed
are widelyatdistributed
ground surfaces
at groundandsurfaces
are easilyandsampled
are easilyminimizing destroy ofdestroy
sampled minimizing nature
environments. Dolomite and quartzite are formed at the geographical
of nature environments. Dolomite and quartzite are formed at the geographical age of middle age of middle and upper
and
carboniferous period [23]. There is limited research on these
upper carboniferous period [23]. There is limited research on these rocks. rocks.
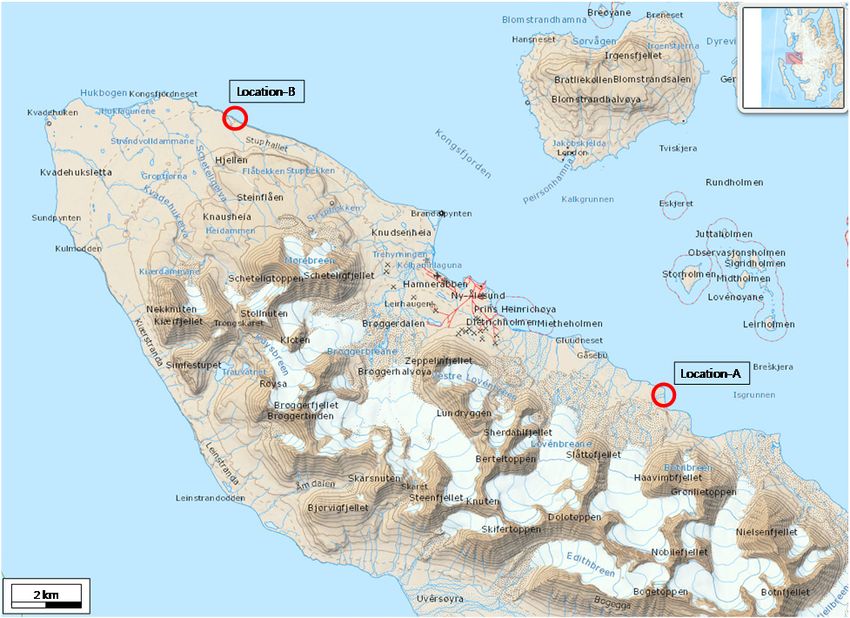
Figure 1. Location
Figure 1. Location of
of the
the study
study area and topographic
area and topographic map
map in
in Ny-Ålesund
Ny-Ålesund (map
(map reproduced
reproduced from
from the
the
original source [24] with courtesy of the Norwegian Polar Institute)
original source [24] with courtesy of the Norwegian Polar Institute).
3. Preparation
3. Preparation of
of Rock
Rock Specimens
Specimens
Several types
Several typesofofrock
rockmineral heterogeneity,
mineral heterogeneity,such as
suchfissures and cracks
as fissures andincluded
cracks in the specimens,
included in the
influence the mechanical properties of rocks [25–27]. In order to analyse
specimens, influence the mechanical properties of rocks [25–27]. In order to analyse quantitativequantitative changes in
rock properties during a freeze-thaw tests, the rocks need to be classified into
changes in rock properties during a freeze-thaw tests, the rocks need to be classified into weathering weathering grades.
Rock weathering
grades. classification
Rock weathering has been
classification suggested
has by a number
been suggested of researchers
by a number [28–30],[28–30],
of researchers and canand be
broadly divided into two methods; qualitative and quantitative methods.
can be broadly divided into two methods; qualitative and quantitative methods. In the present In the present study, before
specimen
study, preparation,
before we classifiedwe
specimen preparation, the sampled
classified therocks based
sampled on the
rocks weathering
based grades using
on the weathering gradesa
qualitative
using method based
a qualitative method onbased
relativeonhardness, extent of discoloration,
relative hardness, and the state
extent of discoloration, andof the
weathering
state of
of the constituent minerals proposed by Irfan and Dearman [30]. Rock weathering
weathering of the constituent minerals proposed by Irfan and Dearman [30]. Rock weathering grades grades were
determined
were from macroscopy
determined from macroscopyproposed by Irfan and
proposed Dearman
by Irfan and [30]. The relative
Dearman hardness
[30]. The presented
relative hardness in
Irfan and Dearman [30] indicates difference in hardness between rock surface (weathered
presented in Irfan and Dearman [30] indicates difference in hardness between rock surface (weathered portion) and
inner rock
portion) and(unweathered portion). The
inner rock (unweathered prepared
portion). Thesample
prepared rock surfaces
sample dosurfaces
rock not exhibit large
do not cracks
exhibit or
large
pores
cracksthat may that
or pores significantly reduce rock
may significantly strength.
reduce The surface
rock strength. The colors
surfaceofcolors
the sample rocks were
of the sample similar
rocks were
to their inner colors. Therefore, the rocks immediately after sampling are classified
similar to their inner colors. Therefore, the rocks immediately after sampling are classified as fresh as fresh rocks.
rocks.A laboratory moulding device was used to create cylindrical specimens from rock blocks collected
for the
A freeze-thaw tests. Theredevice
laboratory moulding are difficulties
was used in moulding
to create the specimens
cylindrical due to internal
specimens fissures
from rock that
blocks
collected for the freeze-thaw tests. There are difficulties in moulding the specimens due to internal
fissures that can develop during fabrication. To measure the porosity, absorption, and P-wave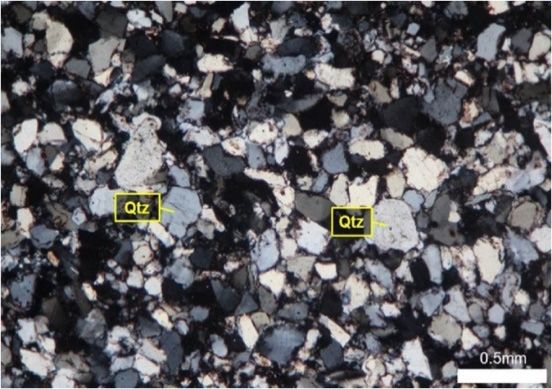
Appl. Sci. 2020, 10, 1707 4 of 18
Appl. Sci. 2020, 10, x FOR PEER REVIEW 4 of 18
can develop
velocity during
of the rocks,fabrication.
3 specimens To measure
of each rockthe porosity,
type were absorption,
fabricatedand to aP-wave velocity
size of 49.5 mmof the rocks,×
(diameter)
3 100
specimens of each rock type were fabricated to a size of 49.5 mm (diameter)
mm (length). To measure shore hardness of the rock surface, 3 disk-shaped specimens of each × 100 mm (length). To
measure
rock type shore
were hardness
fabricated of the
to rock surface,
a size of 49.63 mm
disk-shaped
(diameter) specimens
× 60.0 mm of each rock type
(length). were fabricated
To measure uniaxial
tocompressive
a size of 49.6strength
mm (diameter) × 60.0 mm (length). To measure uniaxial compressive
(UCS), 3 specimens of each rock type and every 150 cycles were fabricated strength (UCS),to a
3 size
specimens of each rock type and every 150 cycles were fabricated to a
of 24.7 mm (diameter) × 50.1 mm (length). The surfaces of all specimens used in the freeze-thawsize of 24.7 mm (diameter)
×tests
50.1 were
mm (length).
moulded The surfaces
to flatness of allofspecimens
errors less than 0.02 used mm in for
the the
freeze-thaw
upper and tests were
lower moulded
surfaces [ISRM]to
flatness errors of less than 0.02 mm for the upper and lower surfaces [ISRM]
using a surface grinding machine. In each test, 3 specimens were used in each round of testing (a using a surface grinding
machine.
triplicateIn eachand
test), test, 3 specimens
physical were used mediator
and mechanical in each round of testing
variables were(a triplicate test), and physical
calculated.
and mechanical mediator variables were calculated.
4. Mineralogy of Rock Samples in the Survey Area
4. Mineralogy of Rock Samples in the Survey Area
For mineralogical and textural studies of the sampled rocks, the results of petrographic studies
For
and X-ray mineralogical
diffraction (XRD) and textural studies
analysis of the
of rocks sampled
collected from rocks, the results
the study of petrographic
area are summarized studies
in Table
and X-ray diffraction (XRD) analysis of rocks collected from the
1 and shown in Figure 2. Samples for XRD tests were prepared from rock powders from thestudy area are summarized in Table
samples 1
and shown in Figure 2. Samples for XRD tests were prepared from rock powders
used for uniaxial compressive strength (UCS) tests after their failures. The XRD analysis equipment is from the samples
used for uniaxial
XPERT-PRO from compressive strength (UCS)
Malvern Panalytical tests after
Ltd. (located in their failures.
Malvern, TheKingdom).
United XRD analysis equipment
Scanning intervalis
XPERT-PRO from Malvern Panalytical Ltd. (located in Malvern, United Kingdom).
of XRD tests was 0.02° (2θ), and scanning range is from 5° to 80°. Post processing of the XRD results is Scanning interval
ofconducted
XRD testsusing
was 0.02 ◦ (2θ), and scanning range is from 5◦ to 80◦ . Post processing of the XRD results is
Siroquant program (version 4.0) from Sietronics Pty Ltd. (located in Perth, Australia)
conducted using inspection
In thin section Siroquant program
of rocks (version 4.0) from
from Location A, Sietronics
the major Pty Ltd. (located
constituent in Perth,
minerals wereAustralia)
dolomite,
Incalcite,
thin section inspection of rocks from Location A, the major constituent
quartz, and opaque minerals were observed. The main rock texture consisted of fine-grained minerals were dolomite,
calcite, quartz,
crystals, whileand opaque
there wereminerals were
also calcite observed.
crystals Themm
of 0.5 main in rock
size. texture consisted
Equigranular of fine-grained
dolomite was also
crystals, while there were also calcite crystals of 0.5 mm in size. Equigranular
observed as the result of diagenesis or alteration. Some calcite crystals showed cleavage planes. dolomite was alsoFine
observed as theshowing
quartz grains result of straight
diagenesis or alteration.
extinction Some calcite
were observed. Due crystals showed cleavage
to diagenesis, planes.
some calcite hadFine
been
quartz grains
replaced withshowing
dolomite. straight
Some extinction werearound
calcite crystals observed. 0.3 mmDue into size
diagenesis,
showedsome calcite
twinning had been
(Figure 2). In
replaced with dolomite. Some calcite crystals around 0.3 mm in size showed
XRD analysis (Table 1), the rocks in Location A were classified as calcareous dolomite, consisting twinning (Figure 2). Inof
XRD
31.3%analysis
calcite,(Table
44.5%1), the rocks
dolomite, in 24.2%
and Location A were classified as calcareous dolomite, consisting of
quartz.
31.3% calcite, 44.5% dolomite, and 24.2% quartz.
Table 1. Results of X-ray diffraction (XRD) in Ny-Ålesund.
Table 1. Results of X-ray diffraction (XRD) in Ny-Ålesund.
Constituents
Specimen Constituents
Specimen Calcite Dolomite Quartz Dickite
Calcite Dolomite Quartz Dickite
Dolomite (Location A) 31.3% 44.5% 24.2% -
Dolomite
Quartzite(Location
(LocationA)B) 31.3% - 44.5% - 24.2%
95.3% - 4.7%
Quartzite (Location B) - - 95.3% 4.7%
(a)
Figure 2. Cont.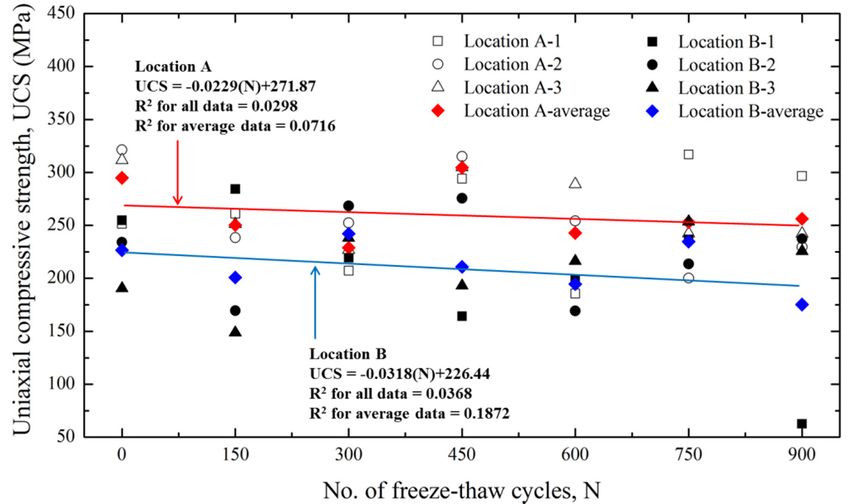
Appl.
 Appl.Sci.  2020,10,
       Sci.2020,  10,1707
                      x FOR PEER REVIEW                                                                        5 5ofof1818

                                                         (b)

      Figure2. 2.Petrographic
     Figure        Petrographic  images
                              images      of the
                                      of the     sample
                                             sample  rocksrocks
                                                            from from  (a) Location
                                                                 (a) Location A and A(b)and       B (Qtz =Bquartz,
                                                                                             (b) Location
                                                                                         Location           (Qtz =
     Do = Dolomite, and Cal = Calcite; left-hand images = crossed polars, right-hand images = parallel =
      quartz,  Do    = Dolomite,  and  Cal  = Calcite; left-hand  images   = crossed  polars, right-hand  images
      parallel polars).
     polars).

     TheTherocks
            rocksininLocation
                       LocationBBconsisted
                                    consistedofofquartz
                                                  quartzcrystals,
                                                          crystals,a asmall
                                                                        smallamount
                                                                              amountofofdiopside,
                                                                                           diopside,and
                                                                                                     andopaque
                                                                                                           opaque
minerals.
 minerals.Mineral
             Mineralcrystals
                       crystalswere
                                 weremostly
                                      mostlyquartz
                                              quartzcrystals
                                                       crystalsofof0.2–0.3
                                                                    0.2–0.3mm
                                                                            mmon onaverage,
                                                                                     average,and
                                                                                              andthe
                                                                                                   theremaining
                                                                                                       remaining
space
 spacewaswasfilled
              filledwith
                     withfine-grained
                           fine-grainedcrystals.
                                        crystals.Quartz
                                                   Quartzcrystals
                                                           crystalsshowing
                                                                      showingstraight
                                                                               straightextinction
                                                                                        extinctionand
                                                                                                   andundulose
                                                                                                         undulose
extinction
 extinctionwere
              wereboth
                     bothobserved.
                           observed.The
                                      Thequartz
                                           quartzcrystals
                                                    crystalsshowed
                                                             showedaasutured
                                                                          suturedappearance,
                                                                                   appearance,while
                                                                                                 whilethere
                                                                                                        therewas
                                                                                                              was
also
 alsoa asmall
         smallamount
                amountofoffine-grained,
                             fine-grained,poikilitic
                                           poikiliticdiopside.
                                                      diopside.InInXRD
                                                                     XRDanalysis,
                                                                           analysis,the
                                                                                     therocks
                                                                                         rockswere
                                                                                                wereclassified
                                                                                                     classifiedasas
quartzite,
 quartzite,consisting
             consistingofof95.3%
                             95.3%quartz
                                    quartzand
                                           and4.7%
                                                 4.7%dickite.
                                                       dickite.

5.5.Changes
     ChangesininRock
                 RockProperties
                      Propertieswith
                                 withIncreasing
                                      IncreasingFreeze-Thaw
                                                 Freeze-ThawCycle
                                                             Cycle

5.1. Air Temperature Analysis
  5.1. Air Temperature Analysis
      In order to examine the freeze-thaw weathering effects on rock properties in the Arctic Circle
        In order to examine the freeze-thaw weathering effects on rock properties in the Arctic Circle
environment, we collected meteorological field data from Ny-Ålesund and analysed the annual
  environment, we collected meteorological field data from Ny-Ålesund and analysed the annual air
air temperature distribution between 2012 and 2017. We used data measured at an Italian base
  temperature distribution between 2012 and 2017. We used data measured at an Italian base in
in Ny-Ålesund. Given the latitude of the study area (78◦ 550 31.65” N), the summer season in the
  Ny-Ålesund. Given the latitude of the study area (78°55′31.65″ N), the summer season in the
Ny-Ålesund region is very short and relatively temperate, due to the northward movement of the
  Ny-Ålesund region is very short and relatively temperate, due to the northward movement of the
warm Gulf Stream, and the winter season is very cold and long. Between April and August, the Sun
  warm Gulf Stream, and the winter season is very cold and long. Between April and August, the Sun
does not set, and between November and January, the Sun does not rise. The reason for analysing this
  does not set, and between November and January, the Sun does not rise. The reason for analysing
meteorological data is because the change in air temperature is the most important factor increasing
  this meteorological data is because the change in air temperature is the most important factor
physical and mechanical damages to rocks due to freeze-thaw cycles [31].
  increasing physical and mechanical damages to rocks due to freeze-thaw cycles [31].
      The most basic mediator variable in freeze-thaw damages to rocks is the number of freeze-thaw
        The most basic mediator variable in freeze-thaw damages to rocks is the number of freeze-thaw
cycles. This can be determined by the simple method of counting the number of points in a given time
  cycles. This can be determined by the simple    method of counting the number of points in a given
interval when the temperature rises above 0 ◦ C [32]. Alternatively, the number of freeze-thaw cycles
  time interval when the temperature rises above 0 °C [32]. Alternatively, the number of freeze-thaw
can be counted by assuming that rocks only freeze when the mean daily temperature is below –3 ◦ C
  cycles can be counted by assuming that rocks only freeze when the mean daily temperature is below
and only thaw when the mean daily temperature is above +1 ◦ C [33]. However, recently, a method has
  –3 °C and only thaw when the mean daily temperature is above +1 °C [33]. However, recently, a
been introduced in which meteorological data is used to analyse the maximum and minimum daily
  method has been introduced in which meteorological data is used to analyse the maximum and
temperatures, and to count the number of freeze-thaw cycles where the temperature goes from above
  minimum daily temperatures, and to count the number of freeze-thaw cycles where the temperature
to below 0 ◦ C or below to above 0 ◦ C [31].
  goes from above to below 0 °C or below to above 0 °C [31].
      In the present study, we used meteorological measurement data to identify cycles in which
        In the present study, we used meteorological measurement data to identify cycles in which
condensation occurred inside the rocks (the temperature inside the rocks became 0 ◦ C) [31]. We
  condensation occurred inside the rocks (the temperature inside the rocks became 0 °C) [31]. We
analysed the daily freeze-thaw cycles in terms of minimum and maximum daily air temperatures
  analysed the daily freeze-thaw cycles in terms of minimum and maximum daily air temperatures
between 2012 and 2017 and found that freeze-thaw cycles in terms of minimum and maximum daily
  between 2012 and 2017 and found that freeze-thaw cycles in terms of minimum and maximum daily
air temperatures occurred on around 33–62 cycles per year (Figure 3).
  air temperatures occurred on around 33–62 cycles per year (Figure 3).
      Figure 4 shows the curves of minimum and maximum daily air temperatures in the study area for
        Figure 4 shows the curves of minimum and maximum daily air temperatures in the study area
year 2015 (at which maximum annual number of freeze-thaw cycle was observed) and year 2017 (at
  for year 2015 (at which maximum annual number of freeze-thaw cycle was observed) and year 2017
which minimum annual number of freeze-thaw cycle was observed). There are several discontinuities
  (at which minimum annual number of freeze-thaw cycle was observed). There are several
  discontinuities in air temperature measurements. The main reasons of the air temperature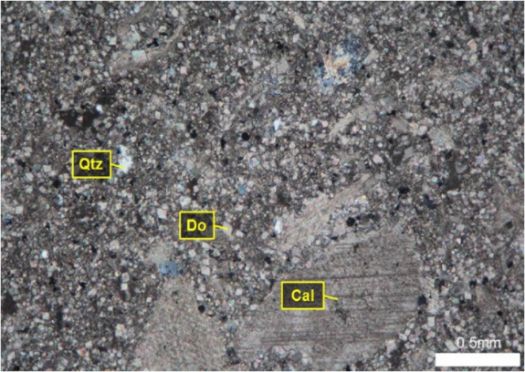
Appl. Sci. 2020, 10, x FOR PEER REVIEW 6 of 18
Appl. Sci. 2020, 10, x FOR PEER REVIEW 6 of 18
measurement
Appl. discontinuities identified
Sci. 2020, 10, 1707 in the sites were shortage of power supply and loss 6 of 18or
destruction ofdiscontinuities
measurement sensors due to identified
animal trespass.
in theHowever,
sites were weshortage
believe thatof thepower missing
supplytemperature
and loss data or
do not highly influence on estimation of appropriate annual freeze-thaw
destruction of sensors due to animal trespass. However, we believe that the missing temperature cycles. As shown in Figure
data4,
inthe
air change
temperature measurements. Theminimum
main reasons oftemperatures
the air temperature measurement discontinuities
do not highlyininfluence
mean maximum and
on estimation of appropriatedaily annual freeze-thaw betweencycles.aboveAs and
shown below zero was
in Figure 4,
identified
most severein the
in sites were
April–May shortage
and of power
September–October.supply and
In loss
the or destruction
freeze-thaw of
process sensors
for due the
rocks, to animal
surface
the change in mean maximum and minimum daily temperatures between above and below zero was
trespass.
of the However,
rock freezes we(orbelieve
thaws) that
whenthe the
missing
minimumtemperature
and data do not
maximum highly
daily influence on
temperatures estimation
alternate from
most severe in April–May and September–October. In the freeze-thaw process for rocks, the surface
ofabove
appropriate
to freezesannual
below zero freeze-thaw
(or below cycles. As shown in Figure 4, the change in mean maximum and
of the rock (or thaws) whento theabove
minimum zero).and Therefore,
maximum based
dailyon the method
temperatures proposed
alternate from by
minimum
Al-Omari daily
et al.temperatures
[31], we between
defined one above and below
freeze-thaw cycle zero
of was
the most
rock severeasinthe
surface April–May
process and
of the
above to below zero (or below to above zero). Therefore, based on the method proposed by
September–October.
minimumetand In the daily
freeze-thaw process for rocks, thebelow
surface of the rock freezes (ortothaws)
Al-Omari al. maximum
[31], we defined temperature
one freeze-thaw changingcyclefromof the rocktosurface
above zero
as the or process
above ofbelow
the
when
zero. the minimum and maximum daily temperatures alternate from above to below zero (or below
minimum and maximum daily temperature changing from below to above zero or above to below
to above zero). Therefore, based on the method proposed by Al-Omari et al. [31], we defined one
zero. However, freeze-thaw cycles of rock may different from that in terms of daily air temperature.
freeze-thaw
slight cycle
For However, changes of the ofrock surface
air cycles as the process
temperature 0 of
°Cthe
near different may minimum
not lead andtomaximum
freeze-thaw daily temperature
freeze-thaw of rock may from that in terms of daily aircycles of rock.
temperature.
changing
Brimblecombe from below
et al. to above
[32] also zero or
mentionedabove to
that below
air zero.
temperature does not exactly represent the rock
For slight changes of air temperature near 0 °C may not lead to freeze-thaw cycles of rock.
However,
surface freeze-thaw
temperature; cycles of air
however, rocktemperature
may differentcan frombe thatapproximately
in terms of dailyused air temperature.
to estimate For
the
Brimblecombe et al. [32] also mentioned ◦ C that air temperature does not exactly represent the rock
slight changes
approximate of air temperature
number however, near
of freeze-thaw 0 may not
cycles at the can lead to
rock be freeze-thaw
surface. cycles
Freeze-thaw of rock.
of the Brimblecombe
surface temperature; air temperature approximately used to rock surface
estimate theis
etdependent
al. [32] alsoon mentioned
the durationthat air
of temperature
the rock’s does not
internal exactly represent
temperature and theair
the rock surface temperature;
temperature. Based on
approximate number of freeze-thaw cycles at the rock surface. Freeze-thaw of the rock surface is
however,
changes air
in temperature
the air can be approximately
temperature in the study used to freeze-thaw
region, estimate the approximate
cycles for thenumber
rock of freeze-thaw
surface occurred
dependent on the duration of the rock’s internal temperature and the air temperature. Based on
cycles at thecycles
on 33–62 rock surface. year,Freeze-thaw of the rock surface is dependent on the duration of the rock’s
changes in the air per temperature andinthethemean
studynumber
region, of cycles
freeze-thaw was calculated
cycles for thetorock be surface
52. Therefore,
occurred we
internal
could temperature and
conservatively the airthat
surmise temperature.
freeze-thaw Based on changes
weathering in the at
occurred airthetemperature
surface ofinthetherocks
studyat
on 33–62 cycles per year, and the mean number of cycles was calculated to be 52. Therefore, we
region,
least 33 freeze-thaw
times per year. cycles for the rock surface occurred on 33–62 cycles per year, and the mean
could conservatively surmise that freeze-thaw weathering occurred at the surface of the rocks at
number of cycles was calculated to be 52. Therefore, we could conservatively surmise that freeze-thaw
least 33 times per year.
weathering occurred at the surface of the rocks at least 33 times per year.
Figure 3. Number of freeze-thaw cycles in terms of minimum and maximum daily air temperature
Figure 3. Number
measured of station
at Dasan freeze-thaw cycles in terms of minimum and maximum daily air temperature
at Ny-Ålesund.
Figure 3. Number of freeze-thaw cycles in terms of minimum and maximum daily air temperature
measured at Dasan station at Ny-Ålesund.
measured at Dasan station at Ny-Ålesund.
(a)
(a)4. Cont.
Figure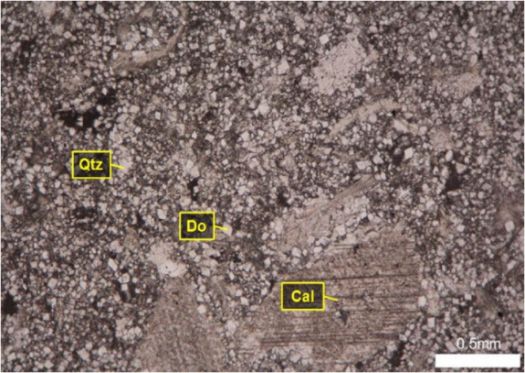
Appl.
Appl. Sci.
Sci. 2020,
2020, 10,10, x FOR PEER REVIEW
1707 7 of
7 of 1818
(b)
Figure 4. Minimum and maximum daily air temperature variation measured at Dasan station at
Figure 4. Minimum and maximum daily air temperature variation measured at Dasan station at
Ny-Ålesund of years (a) 2015 (maximum freeze-thaw cycles of 62) and (b) 2017 (minimum freeze-thaw
Ny-Ålesund of years (a) 2015 (maximum freeze-thaw cycles of 62) and (b) 2017 (minimum
cycles of 33).
freeze-thaw cycles of 33).
5.2. Determination of Freeze-Thaw Temperature and Time
5.2. Determination of Freeze-Thaw Temperature and Time
The freeze-thaw test is an artificial weathering test to reproduce the physical weathering caused by
tensileThe
forcesfreeze-thaw
that occur testduringis antheartificial
formationweathering test towithin
of ice crystals reproduce rocks.theThephysical weathering
freeze-thaw caused
temperature
by tensile forces that occur during the formation of ice crystals
range and time cycle can be applied differently depending on the study objectives and target region. within rocks. The freeze-thaw
temperaturetest
Freeze-thaw range and time
methods cycle can of
for durability be rocks
applied aredifferently
described in depending
ASTM D5312 on the study
[34]. Theobjectives
temperature and
targetfor
range region. Freeze-thaw
the freeze-thaw testproposed
tests methodsby forASTM
durability
D5312 of[34]
rocks are described
is from −18 ± 2.5in◦ CASTM to +32D5312
± 2.5 [34].
◦ C.
Nicholson and Nicholson [14] and Baek and Kwak [27] performed freeze-thaw tests using a temperature°C
The temperature range for the freeze-thaw tests proposed by ASTM D5312 [34] is from −18 ± 2.5
to +32of±−20
range 2.5 °C. Nicholson
◦ C–+20 and et
◦ C. Bortz Nicholson
al. [15] and[14]Bortz
and Baekand and Kwak [27][35]
Wonneberger performed
conducted freeze-thaw
freeze-thaw tests
tests with a range of −22 C–+77 C, and Park [36] conducted a test with a range of −10 C–+150 ◦[35]
using a temperature range
◦ of −20
◦ °C–+20 °C. Bortz et al. [15] and Bortz and Wonneberger
◦ C.
conducted
Recently, freeze-thaw
freeze-thaw teststests
havewith beenaperformed
range of −22 °C–+77 °C,
to compare and conditions
climatic Park [36] conducted
at regions wherea test rocks
with a
range
have beenof collected
−10 °C–+150 [10]. °C.
FookesRecently, freeze-thaw
and Hawkins tests have
[37] observed thebeen
largestperformed to compare
effect of decreased climatic
hardness
conditions at regions where
due to freezing at a temperature of −20 C. rocks have◦ been collected [10]. Fookes and Hawkins [37] observed the
largest effect of decreased hardness due to freezing at a temperature
For the freeze-thaw temperature range in the present study, we applied a range of of −20 °C.
−25 ± For the freeze-thaw
2 ◦ C–+27 ± 2 ◦ C for temperature
the temperature rangeinside
in thethepresent
rocks, study, we applied
accounting a range
for the of −25 ± 2 °C–
air temperatures
in the Ny-Ålesund region in the last 5 years (the maximum of 14 C and the minimum of −24in◦ C).
+27 ± 2 °C for the temperature inside the rocks, accounting ◦ for the air temperatures the
Ny-Ålesund
The region inthe
reason of applying thehigher
last 5 maximum
years (the temperature
maximum of(+27 14 °C ± 2and
◦ C) the minimum
compared withofthe −24five-year
°C). The
reason of applying the higher ◦ maximum temperature (+27
maximum temperature (+14 C) is to consider possible heat transferred from ground and solar ± 2 °C) compared with the five-year
maximum
radiation to temperature
the rock surface. (+14 °C) is to consider
In order to determine possible heat transferred
the freeze-thaw time,from ground and
temperature changessolar
radiation
inside to the
the rock rock surface.
specimens were Inmeasured.
order to determine the freeze-thaw
For the measurement time,temperature,
of rock temperature changes
small hole inside
of
the rock specimens were measured. For the measurement of rock
5 mm (diameter) × 25 mm (depth) is drilled at both ends of cylindrical rock samples with dimension temperature, small hole of 5 mm
of(diameter) × 25 mm×(depth)
50 mm (diameter) 100 mmis(length).
drilled atThe both endsthermocouple
t-type of cylindrical rock samples
is firmly with to
attached dimension
center of of the50
mmbottom.
hole (diameter) × 100 mm
Thermal (length).
isolation wasThe donet-type thermocouple
by inserting bonding is firmly attached
chemicals intotothecenter of the
drilled hole
holes.
bottom. Thermal isolation was done by inserting bonding chemicals
After drilling to the centers of the largest freeze-thaw specimens (diameter of 49.5 mm and length into the drilled holes. After
ofdrilling
100 mm), to thewecenters
inserted of athe largest freeze-thaw
temperature sensor tospecimens (diameter ofchanges
monitor temperature 49.5 mmon andthelength
insideofthe 100
mm), we inserted a temperature sensor to monitor temperature
rock specimens. After saturating the test specimens in a vacuum chamber for 24 h, the specimens changes on the inside the rock
specimens.
were submerged Afterinsaturating
individualthe test specimens
containers filled within a tap
vacuumwaterchamber for 24 h,Figure
for freeze-thaw. the specimens
5 shows were the
submergedcurves
temperature in individual
inside thecontainers
rock whenfilled with tap water
the temperature for freeze-thaw.
in the freezing chamber Figure
was changed 5 shows in thethe
temperature curves
◦
range −25 ± 2 C–+40 ± 2 C. inside◦ the rock when the temperature in the freezing chamber was changed in
the range −25 ± 2 °C–+40 ± 2 °C.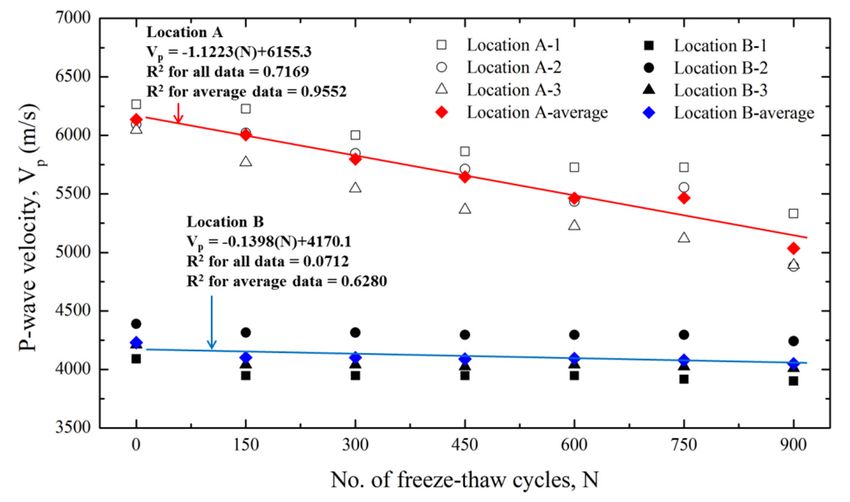
Appl. Sci. 2020, 10, 1707 8 of 18
Appl. Sci. 2020, 10, x FOR PEER REVIEW 8 of 18
Figure 5. Temperature change
change test
test inside
inside the
the rock
rock during
during freeze-thaw
freeze-thaw cycles.
cycles.
Although
Although the the change
change in in temperature
temperature inside inside the
the rock
rock sample
sample exhibited
exhibited somesome small
small changes
changes with
with
each
each freeze-thaw
freeze-thaw cycle, it took approximately
approximately 30 min for the the rock
rock temperature
temperature to descend
descend from from airair
temperature (+15 ◦ C) to 0 ◦ C, and the freezing temperature (−25 ◦ C) was maintained for around 2 h.
temperature (+15 °C) °C, (−25 °C) was maintained for around
The
The time
time for
for the
the temperature
temperatureinside insidethe therock
rockto torecover from−25
recoverfrom −25 ◦°C to +27
C to ◦ C was around
+27 °C was around 2 h 30 min.
By
By measuring
measuringthethe change
changein temperature
in temperature insideinside
the rocks,
the we determined
rocks, the duration
we determined theof duration
freeze-thaw of
cycles. For the freezing phase, in order for the rock temperature to remain at −25 ◦ C for more than 2 h,
freeze-thaw cycles. For the freezing phase, in order for the rock temperature to remain at −25 °C for
the specimens frozen at −25 ◦ C for 5 h. For the thawing phase, the specimens were placed in a
more than 2 h,were the specimens were frozen at −–25 °C for 5 h. For the thawing phase, the specimens
chamber
were placed for 3inhawhile
chamberthe temperature
for 3 h whilewas thelowered
temperatureat a constant
was lowered rate from +40 ◦ C torate
at a constant +25from
◦ C.
+40 °C
to +25For°C.the freeze-thaw tests, after sample fabrication, all specimens were first subjected to forced
saturation
For thein water for at least
freeze-thaw tests,24after
h using a vacuum
sample chamber.
fabrication, Full saturation
all specimens wereoffirst
rocks makes for
subjected to aforced
more
severe freeze-thaw environment, as the saturation accelerates freeze-thaw
saturation in water for at least 24 h using a vacuum chamber. Full saturation of rocks makes for weathering. Therefore, thea
freeze-thaw
more severeweathering
freeze-thaw of rock in sites mayas
environment, be the
less significant
saturation than those in freeze-thaw
accelerates laboratory. With the rock
weathering.
specimens
Therefore, submerged
the freeze-thaw in water in individual
weathering containers,
of rock in sitesthemay
freeze-thaw
be less process wasthan
significant repeated.
thoseFor in
every 150 freeze-thaw cycles, hardness in terms of UCS and shore hardness
laboratory. With the rock specimens submerged in water in individual containers, the freeze-thaw and physical properties of
absorption
process was and P-wave velocity
repeated. For every were150measured
freeze-thaw following
cycles,the methodsinproposed
hardness terms ofby UCSthe ISRM
and shore[38].
For the UCS
hardness andand shore hardness
physical properties tests, their valuesand
of absorption wereP-wave
measured after drying
velocity the specimens
were measured for more
following the
than 12 h at
methods +105 C. by
proposed ◦ To measure
the ISRM specific gravity,
[38]. For the absorption,
UCS and shore and porosity,
hardness thetests,
saturated
theirweight
valuesbefore
were
removing
measured surface waterthe
after drying andspecimens
the weightfor after
moredrying
thanfor12 more than °C.
h at +105 12 hTo +105 ◦ C specific
at measure were measured.
gravity,
P-wave
absorption,velocity was also the
and porosity, measured
saturated in aweight
dry state.
beforeAfter measuring
removing surfacethe water
physical
andproperties
the weightofafter the
rocks,
dryingthe forsame
morespecimens
than 12 hwere at +105submerged
°C were within flexible
measured. plastic
P-wave container
velocity wasusing
also tap water and
measured in afully
dry
saturated
state. After at vacuum
measuring chamber at least for
the physical 24 h. Theofimplemented
properties the rocks, the method
same in this studywere
specimens is more rigorous
submerged
than
within theflexible
method proposed
plastic by ISRM
container using[38],
tap which
water andsaturates rock samples
fully saturated for 12 chamber
at vacuum h under atmospheric
at least for 24
pressure followed bymethod
h. The implemented an additional 1 h in is
in this study a vacuum chamber.
more rigorous thanThen, the saturated
the method proposedspecimens
by ISRMwere [38],
subjected to another
which saturates rock150 freeze-thaw
samples for 12 hcycles.
under atmospheric pressure followed by an additional 1 h in a
vacuum chamber. Then, the saturated specimens were subjected to another 150 freeze-thaw cycles.
5.3. Changes in Physical and Mechanical Properties of Rocks
5.3. Changes in Physical and Mechanical Properties of Rocks
5.3.1. Baseline Physical Properties of Rocks
5.3.1.The
Baseline Physical
physical Properties
properties of theofinitially
Rocks sampled rocks are important reference data to provide
the criteria for physical changes according to the freeze-thaw process and weathering grade. Baseline
The physical properties of the initially sampled rocks are important reference data to provide
properties are defined in this study as reference rock sample properties prior to implement freeze-thaw
the criteria for physical changes according to the freeze-thaw process and weathering grade.
cycles in laboratory. Table 2 shows the baseline (initial) values for porosity, absorption, P-wave velocity,
Baseline properties are defined in this study as reference rock sample properties prior to implement
shore hardness, and UCS of rocks in the northern region of Ny-Ålesund. In order to determine the
freeze-thaw cycles in laboratory. Table 2 shows the baseline (initial) values for porosity, absorption,
physical and mechanical properties of rocks, the methods proposed by the ISRM [38] are implemented.
P-wave velocity, shore hardness, and UCS of rocks in the northern region of Ny-Ålesund. In order to
Figure 6 shows pictures of the measurement system for the tested samples. The physical and mechanical
determine the physical and mechanical properties of rocks, the methods proposed by the ISRM [38]
properties of three rock specimens from each location in the Ny-Ålesund region are summarized
are implemented. Figure 6 shows pictures of the measurement system for the tested samples. The
physical and mechanical properties of three rock specimens from each location in the Ny-Ålesund
region are summarized in Table 2. The rocks sampled at Location A relatively show lower porosity,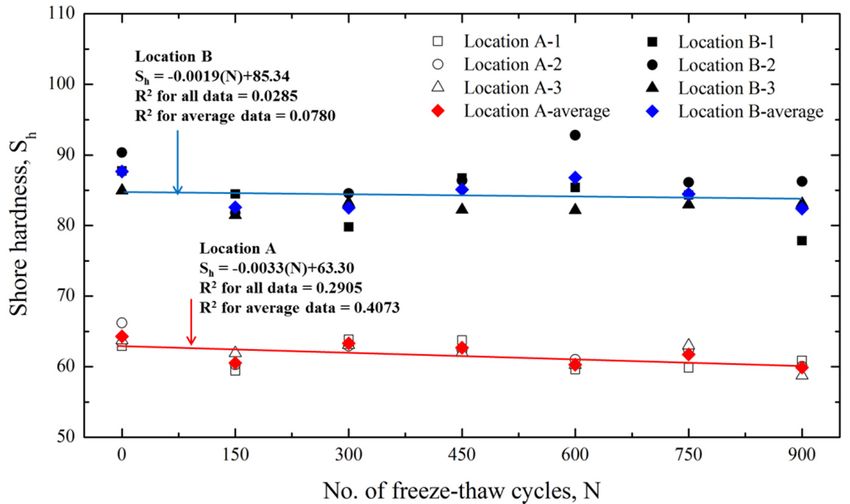
Appl. Sci. 2020, 10, 1707                                                                                 9 of 18
 Appl. Sci. 2020, 10, x FOR PEER REVIEW                                                                    9 of 18

 absorption,
in           androcks
   Table 2. The   shoresampled
                         hardness
                               at and higher
                                  Location A UCS   and P-wave
                                             relatively        velocity
                                                        show lower      than those
                                                                    porosity,      properties
                                                                              absorption,      of the
                                                                                          and shore
 rocks sampled  at Location B.
hardness and higher UCS and P-wave velocity than those properties of the rocks sampled at Location B.

                           (a)                                                    (b)

                           (c)                                                    (d)

     Figure 6. Photographs of measurement systems of rock properties: (a) Uniaxial compressive strength;
      Figure 6. Photographs of measurement systems of rock properties: (a) Uniaxial compressive strength;
     (b) shore hardness; (c) absorption; (d) P-wave velocity.
      (b) shore hardness; (c) absorption; (d) P-wave velocity.
                      Table 2. Range of rock properties of the pre-test sample specimens.
                       Table 2. Range of rock properties of the pre-test sample specimens.
                                                Location A                            Location B
               Property
                                        A-1         A-2 Location A-3A         B-1         Location BB-3
                                                                                          B-2
                   Property
            Porosity (%)                  0.291    A-1
                                                    0.415    A-2
                                                               0.536    A-33.332 B-1 2.855 B-2     3.039B-3
          Absorption (%)                  0.106     0.151       0.195       1.298       1.136      1.184
                Porosity (%)                      0.291      0.415      0.536     3.332      2.855    3.039
       P-wave velocity (m/s)              6266      6094        6048         4091       4390       4211
              Absorption
          Shore hardness (%)               62.9   0.106
                                                     66.2    0.151
                                                                 63.8   0.19587.7 1.298 90.3 1.136 85.0
                                                                                                      1.184
   UniaxialP-wave
            compressive  strength
                    velocity  (m/s)               6266       6094       6048254.8 4091 234.24390 190.6
                                                                                                    4211
                                          251.6    321.4       311.7
               (MPa)
                Shore hardness                    62.9       66.2       63.8       87.7       90.3       85.0
   Uniaxial compressive strength (MPa)             251.6      321.4      311.7      254.8       234.2     190.6
      The extent of weathering of each specimen prior to application of freeze-thaw cycles was classified
according to the existing grading method of Irfan and Dearman [30]. The weathering grade proposed
      Theand
by Irfan    extent of weathering
               Dearman               of each
                         [30] classified       specimen
                                         rock grading       prior
                                                         into      to application
                                                              six categories (Tableof
                                                                                    3).freeze-thaw    cycles was
                                                                                        When rock weathering
 classified  according  to  the existing   grading   method    of  Irfan and  Dearman     [30].  The
was observed under a microscope, the rocks at Locations A and B showed relatively good preservation   weathering
 grade
of       proposed
   texture and loss by  Irfan and
                    or change        Dearman
                                of colour,      [30]
                                           and so, in classified  rock grading
                                                      terms of weathering        into
                                                                             grade, thesix categories
                                                                                         rocks         (Table 3).
                                                                                                were determined
 When
to       rock weathering was observed under a microscope, the rocks at Locations A and B showed
   be fresh.
 relatively good preservation of texture and loss or change of colour, and so, in terms of weathering
 grade, the rocks were determined to be fresh.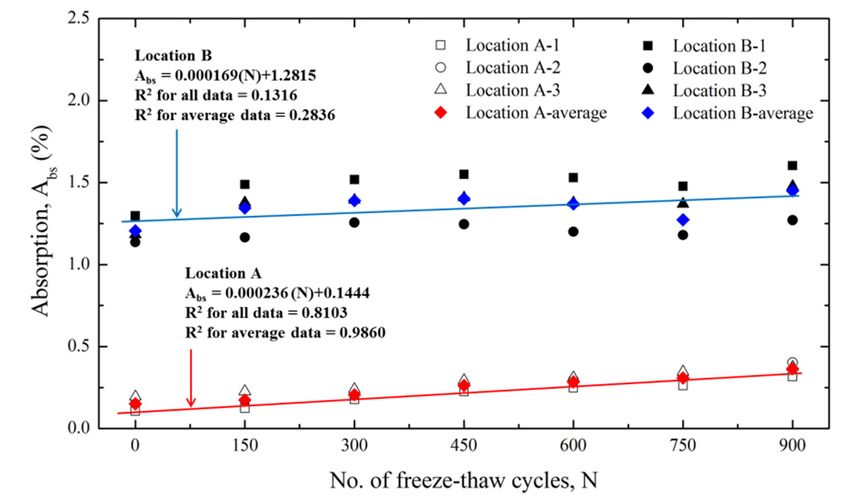
Appl. Sci. 2020, 10, 1707                                                                                   10 of 18

             Table 3. Scale of weathering grades of rock mass (modified from Irfan and Dearman [30]).

             Term              Grade     Abbreviation                           Description
                                                           Rock mass shows no loss of strength, discoloration or
                                                           other effects due to weathering. There may be slight
             Fresh                I            F
                                                           discoloration on major rock mass defect surfaces or
                                                                                 on clasts.
                                                           The rock mass is not significantly weaker than when
     Slightly Weathered          II           SW           fresh. Rock may be discoloured along defects, some
                                                                 of which may have been opened slightly
                                                           The rock mass is significantly weaker than the fresh
                                                              rock and part of the rock mass may have been
                                                           changed to a soil. Rock material may be discoloured
   Moderately Weathered          III          MW             and defect and clast surfaces will have a greater
                                                           discoloration, which also penetrates slightly into the
                                                            rock material. Increase in density of defects due to
                                                                          physical disintegration
                                                           Most of the original mass strength is lost. Material is
                                                              discoloured and more than of half the mass is
                                                             changed to a soil by chemical decomposition or
                                                                   disintegration (increase in density of
     Highly Weathered            IV           HW                             defects/fractures).
                                                           Decomposition adjacent to defects and at the surface
                                                            of clasts penetrates deeply into the rock material.
                                                              Lithorelicts or core stones of fresh or slightly
                                                                     weathered rock may be present.
                                                             Original rock strength is lost and the rock mass
                                                           changed to a soil either by decomposition (with some
   Completely Weathered          V            CW
                                                           rock fabric preserved) or by physical disintegration
                                                                                 (e.g., talus).
                                                              Rock is completely changed to a soil with the
         Residual Soil           VI           RW
                                                               original fabric destroyed (pedological soil).

     Although the rocks (prior to implement freeze-thaw cycles) in Locations A and B have the same
weathering grade of “fresh” based on the methods of Irfan and Dearman [30], porosity and P-wave
velocity were significantly different between the samples from Locations of A and B. Figure 7 shows
the relationship between porosity and P-wave velocity in the specimens used in the freeze-thaw test.
As shown in Figure 7, there exist clear differences in the physical properties in the relationship between
porosity and P-wave velocity. This difference results from the different rock origins, internal structures,
properties of minerals. There exists significant difference in porosity and P-wave velocity between
rocks from Locations A and B. Figure 7 is provided to show a graphical view of the relationship
between porosity and P-wave velocity. Dolomite, which is the smaller porosity, has the denser rock
structure compared with quartzite. Therefore, the P-wave of dolomite is higher than that of quartzite.
Appl. Sci. 2020, 10, 1707 11 of 18
Appl. Sci. 2020, 10, x FOR PEER REVIEW 11 of 18
Figure 7.
Figure Distribution patterns
7. Distribution patterns of
of samples
samples collected
collected Locations
Locations A
A and
and BB in
in Ny-Ålesund.
Ny-Ålesund.
5.3.2. Changes in Rock Strength
5.3.2. Changes in Rock Strength
In order to obtain the standardized strengths of the rocks, samples need to be prepared in a
In order to obtain the standardized strengths of the rocks, samples need to be prepared in a
standard size, such as core or block samples. The preparation of homogeneous rock blocks or cores is
standard size, such as core or block samples. The preparation of homogeneous rock blocks or cores is
almost impossible due to their inherent heterogeneous properties formed in nature. Especially, the
almost impossible due to their inherent heterogeneous properties formed in nature. Especially, the
weathered rocks are more difficult to fabricate into homogeneous standardized block or core sizes
weathered rocks are more difficult to fabricate into homogeneous standardized block or core sizes
compared with less-weathered rocks.
compared with less-weathered rocks.
In reality, measurement of rock strength inherently has a high uncertainty because of flaws or
In reality, measurement of rock strength inherently has a high uncertainty because of flaws or
small cracks inside the rock and relative orientations between major flaws and loading directions. The
small cracks inside the rock and relative orientations between major flaws and loading directions.
extent of weathering, fissures, and the distribution of minerals act as factors introducing uncertainty
The extent of weathering, fissures, and the distribution of minerals act as factors introducing
to rock hardness [25–27]. Many researchers found the decrease of rock strength reduction with
uncertainty to rock hardness [25–27]. Many researchers found the decrease of rock strength
increasing freeze-thaw weathering from different experiments [6,39–42]. However, because there are
reduction with increasing freeze-thaw weathering from different experiments [6,39–42]. However,
large deviations in rock strength also depending on the sampling location, a large number of repetitive
because there are large deviations in rock strength also depending on the sampling location, a large
experiments of rocks is required to estimate the general UCS of rocks. Consequently, it is not easy to
number of repetitive experiments of rocks is required to estimate the general UCS of rocks.
investigate changes in rocks in their natural state by studying artificial changes in rock strength due to
Consequently, it is not easy to investigate changes in rocks in their natural state by studying artificial
freeze-thaw. However, to minimize the effect of inherent non-homogeneity on rock characteristics of
changes in rock strength due to freeze-thaw. However, to minimize the effect of inherent
freeze-thaw tests, rock samples with relatively consistent mineral composition and extent of fissures
non-homogeneity on rock characteristics of freeze-thaw tests, rock samples with relatively consistent
were collected for experiments in this study. Specifically, in order to minimizing uncertainty factors of
mineral composition and extent of fissures were collected for experiments in this study. Specifically,
the uniaxial compression test, we prepared test samples by moulding rocks that were homogeneous
in order to minimizing uncertainty factors of the uniaxial compression test, we prepared test
and, as far as possible, from nearby locations. Because samples after failure cannot be reused in the
samples by moulding rocks that were homogeneous and, as far as possible, from nearby locations.
uniaxial compression test, we fabricated a large number of samples with similar baseline properties.
Because samples after failure cannot be reused in the uniaxial compression test, we fabricated a large
To reduce the uncertainties of UCS, we measured UCSs of three rock specimens for each freeze-thaw
number of samples with similar baseline properties.
cycle and use their average to capture changes in UCS with increasing freeze-thaw cycle. Figure 8
To reduce the uncertainties of UCS, we measured UCSs of three rock specimens for each
shows the changes in UCS during 900 freeze-thaw cycles of rocks in the study area. UCS measurements
freeze-thaw cycle and use their average to capture changes in UCS with increasing freeze-thaw
were taken from three rock specimens in each group every 150 cycles, and the coloured points on the
cycle. Figure 8 shows the changes in UCS during 900 freeze-thaw cycles of rocks in the study area.
graph show the mean UCS of the three specimens. As mentioned earlier, due to the high uncertainty in
UCS measurements were taken from three rock specimens in each group every 150 cycles, and the
UCS of rock, it is hard to capture clear decrease of UCS with increasing freeze-thaw cycle. The main
coloured points on the graph show the mean UCS of the three specimens. As mentioned earlier, due
reason would be the fact that identical rock specimens could not be used in UCS measurement.
to the high uncertainty in UCS of rock, it is hard to capture clear decrease of UCS with increasing
freeze-thaw cycle. The main reason would be the fact that identical rock specimens could not be
used in UCS measurement.Appl. Sci. 2020, 10, 1707 12 of 18
Appl.
Appl. Sci.
Sci. 2020,
2020, 10,
10, xx FOR
FOR PEER
PEER REVIEW
REVIEW 12
12 of
of 18
18
Figure
Figure 8.
8. Uniaxial
Uniaxial compressive
compressive strength
strength changes
changes with
with increasing
increasing freezing-thaw
freezing-thaw cycle
cycle of
of Locations
Locations A
A
and
and B.
B.
The results
results show
showan anoverall
overalldecreasing
decreasingtrend
trendfor
for hardness
hardness as as freeze-thaw
freeze-thaw progresses,
progresses, butbut there
there are
are large
large deviations
deviations in some
in some measurement
measurement cycles.
cycles. TheseThese deviations
deviations in UCS in can
UCSbecan be considered
considered the
the result
result of inhomogeneity
of inhomogeneity on theon the inside
inside of the of the [25–27].
rocks rocks [25–27]. TheofUCS
The UCS the of the from
rocks rocksLocations
from Locations
A and A B
and B decreased from 295 MPa at baseline to 256 MPa (reduction of approximately
decreased from 295 MPa at baseline to 256 MPa (reduction of approximately 13%) and from 227 MPa 13%) and from
227 MPa atto
at baseline baseline
175 MPa to (reduction
175 MPa (reduction of approximately
of approximately 13%), respectively,
13%), respectively, after 900
after 900 cycles. The cycles. The
rocks from
rocks from
Location A Location
showed aAdecrease
showed in
a decrease
hardnessin ofhardness of −0.0229
−0.0229 MPa MPa per freeze-thaw
per freeze-thaw cycle,
cycle, and the andfrom
rocks the
rocks from
Location LocationaBdecrease
B showed showedof a decrease of −0.0318
−0.0318 MPa MPa per cycle.
per cycle.
Changes in
5.3.3. Changes in Rock
Rock Shore
Shore Hardness
In
In order
order to
to investigate
investigate the
the resistance
resistance of
of the
the rocks
rocks to changes in
to changes in elasticity
elasticity due
due to
to freeze-thaw,
freeze-thaw, the
the
shore hardness was measured on the rock surface.
the rock surface. Figure 9 is a graph showing the changes in shore
hardness
hardness with
with increasing
increasing freeze-thaw
freeze-thaw weathering. The rocks
weathering. The rocks from
from Locations
Locations A A and
and BB showed
showed mean
mean
shore hardnesses of 64.3 and 87.7 at baseline, respectively. Thus, the rocks from Location A, mainly
consisting of
ofcarbonate
carbonateminerals, showed
minerals, the higher
showed rebound
the higher than the
rebound rocks
than thefrom Location
rocks B, primarily
from Location B,
consisting of metamorphic quartz.
primarily consisting of metamorphic quartz.
Figure
Figure 9.
Figure 9. Shore
9. Shore hardness
Shore hardness changes
hardness changes with
changes with increasing
with increasing freezing-thaw
increasing freezing-thaw cycle
freezing-thaw cycle of
cycle of Locations
of A
Locations A
Locations and
A and B.
and B.
B.You can also read