Velocity structure and the role of fluids in the West Bohemia Seismic Zone
←
→
Page content transcription
If your browser does not render page correctly, please read the page content below
Solid Earth, 5, 863–872, 2014
www.solid-earth.net/5/863/2014/
doi:10.5194/se-5-863-2014
© Author(s) 2014. CC Attribution 3.0 License.
Velocity structure and the role of fluids in the
West Bohemia Seismic Zone
C. Alexandrakis1 , M. Calò2 , F. Bouchaala3 , and V. Vavryčuk4
1 Institute of Geophysics and Geoinformatics, TU Bergakademie Freiberg, Freiberg, Germany
2 Berkeley Seismological Laboratory, Berkeley, USA
3 The Petroleum Institute, Abu Dhabi, United Arabic Emirates
4 Institute of Geophysics, Czech Academy of Science, Prague, Czech Republic
Correspondence to: C. Alexandrakis (catherine.alexandrakis@geophysik.tu-freiberg.de)
Received: 27 January 2014 – Published in Solid Earth Discuss.: 11 February 2014
Revised: 14 July 2014 – Accepted: 15 July 2014 – Published: 27 August 2014
Abstract. In this study, we apply the double-difference to- (mainly He3/He4) indicates that the fluids released from gas
mography to investigate the detailed 3-D structure within vents and springs within and around the Cheb Basin are mag-
and around the Nový Kostel Seismic Zone, an area in the matic in nature (Bräuer et al., 2005; Weise et al., 2001). This
Czech Republic known for frequent occurrences of earth- has led to the hypothesis that migrating fluids play a major
quake swarms. We use data from the 2008 swarm since role in the swarm activity (Bräuer et al., 2005; Geissler et al.,
it has already been analysed in terms of earthquake focal 2005; Hainzl et al., 2012; Špičák and Horálek, 2001).
mechanisms, principal faults, tectonic stress and foci migra- Seismic swarms in the Nový Kostel area occur at the junc-
tion. We selected about 500 microearthquakes recorded at 22 tion of the Mariánské-Lázně Fault and the Počátky-Plesná
local seismic stations of the West Bohemia seismic moni- Fault Zone (Bankwitz et al., 2003; Peterek et al., 2011; Fis-
toring network (WEBNET). Applying double-difference to- cher et al., 2014). The 2008 swarm had two dominant focal
mography, combined with weighted average model (WAM) mechanisms with principal fault planes oriented at 169◦ and
post-processing to correct for parameter dependence effects, 304◦ (Vavryčuk, 2011). The 169◦ principal fault corresponds
we produce and interpret 3-D models of the Vp-to-Vs ra- well to the Počátky-Plesná Fault segments in the Nový Kos-
tio (Vp / Vs) in and around the focal zone. The modelled tel Zone (Bankwitz et al., 2003), and the 304◦ principal fault
Vp / Vs ratio shows several distinct structures, namely an is approximately parallel to the Gera-Jáchymov Fault Zone
area of high Vp / Vs ratio correlating with the foci of the mi- (Švancara et al., 2008). The 2008 swarm shows many sim-
croearthquakes, and a layer of low values directly above it. ilarities to swarms which occurred in 1985–1986 and 2000.
These structures may reflect changes in lithology and/or fluid These three swarms all activated the same fault planes and
concentration. The overlaying low Vp / Vs ratio layer coin- the foci occurred in the same depth range (Fischer et al.,
cides with the base of the Fichtelgebirge (Smrčiny) granitic 2010, 2014). Also, the focal mechanisms were similar. How-
intrusion. It is possible that the base of the layer acts as a ever, the magnitudes of the strongest events were different:
fluid trap and an upper limit to the seismicity, resulting in 4.6, 3.4 and 3.8 for the 1985–1986, 2000 and 2008 swarms,
observed periodic swarms. respectively. As with most of the Nový Kostel earthquake
swarms, the 2008 swarm displayed an upward migration pat-
tern, meaning that the hypocentres occurred at progressively
shallower depths over the course of the swarm (Fischer et al.,
1 Introduction 2010).
Several studies have produced models of the crustal struc-
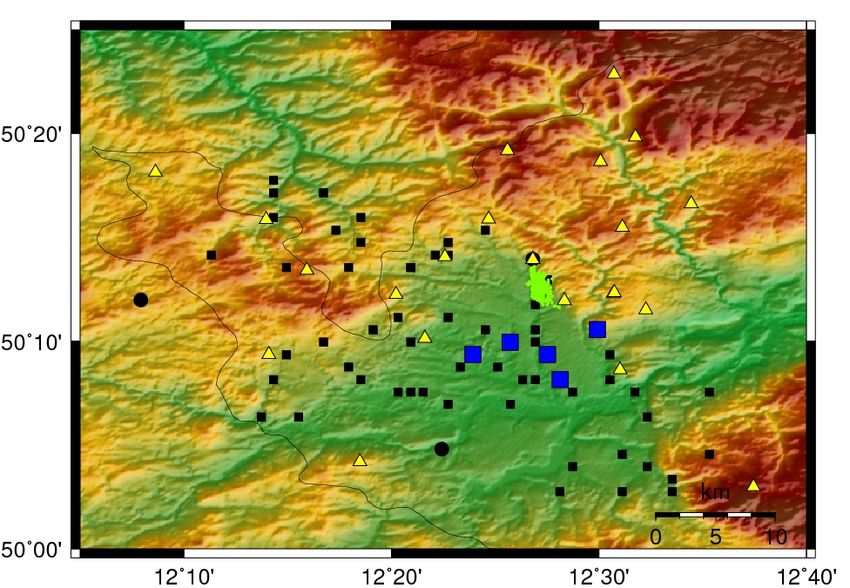
The Nový Kostel Seismic Zone is the most seismically ac- ture using a variety of geophysical methods and data (e.g.
tive area in West Bohemia (Czech Republic), a region known Hrubcová et al., 2005, 2013; Málek et al., 2001; Mlčoch and
for frequent earthquake swarms (Fig. 1). Isotope analysis
Published by Copernicus Publications on behalf of the European Geosciences Union.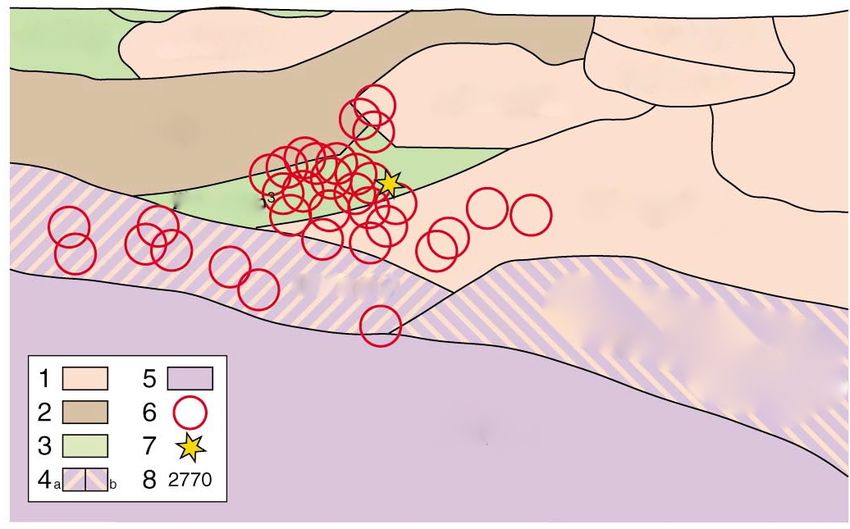
864                                                                    C. Alexandrakis et al.: Velocity structure and the role of fluids

                                                                               Analysis of the model focuses on the rupture zone and the
                               C       B                                    area directly above it. Structures observed in the Vp-to-Vs
         Germany                                                            ratio (Vp / Vs) model are assessed in terms of local geology
                                             PPFZ                           and the potential role of fluids in the swarm cycle.
              Czech                                              A´
               Rep.                          Nový Kostel
                                      MLF
       Selb
                                                                            2     Data
                       A                                   Eger Rift
                                                                            In this study, we use earthquakes that occurred during the
                                                                            2008 Nový Kostel earthquake swarm (Fischer et al., 2010).
                              Cheb                                          This swarm had the fastest (∼ 4 weeks) and largest total
                                                    B´     C´               seismic moment (4 × 10¹⁶ Nm) released in over 20 years
                                                                            (Fischer et al., 2010). About 25 000 earthquakes with local
                                                                            magnitude greater than −0.5 were recorded by 23 WEB-
          WEBNET Stations      City                                         NET seismic stations (Fig. 1) and located using the pro-
          Springs              Earthquakes                                  gram FASTHYPO (Herrmann, 1979). The epicenters form
          Gas Vents            Fault Zone                                   an elongated cluster (∼ 4 km long) and hypocentres ranged
                                                                            between 7 and 11 km depth (Fischer et al., 2010). Bouchaala
Figure 1. Topographic map showing the Nový Kostel Seismic Zone.
Inset shows location within Europe. Black box shows inversion area
                                                                            et al. (2013) used manually-picked P -wave and S-wave ar-
and lines A-A0 , B-B0 and C-C0 note profiles shown in other fig-            rival times and waveform cross-correlated times to relo-
ures. Abbreviations: MLF – Mariánské-Lázně Fault Zone, PPFZ –              cate 483 selected events using HypoDD, a double-difference
Počátky-Plesná Fault Zone. Mineral spring and gas vent locations           hypocentre location program (Waldhauser and Ellsworth,
digitized from Heinicke et al. (2009).                                      2000). The events were selected to lie in a broad magnitude
                                                                            range and the foci to cover the entire active area. The picked
                                                                            arrival times had an error of ±4 ms for the P waves and
                                                                            ±10 ms for the S waves, and only waveform cross-correlated
                                                                            times with a correlation coefficient of at least 0.8 were used.
Skácelová, 2009; Růžek et al., 2007; Tomek et al., 1997).
                                                                            The HypoDD-relocated events are more clustered and clearly
Most of these studies were aimed at investigating the deeper
                                                                            define the fault plane (Bouchaala et al., 2013). The new lo-
parts of the crust or the crust on the regional scale and
                                                                            cations differ from the FASTHYPO locations by a maximum
therefore did not resolve the focal zone structures. In this
                                                                            of 1140 m in east–west, 880 m in north–south and 560 m in
study, double-difference tomography is used to investigate
                                                                            depth. Overall, the relocated data has an average location er-
the velocity structure in the focal zone. It is able to image
                                                                            ror of 17 m and an average RMS of 4.8 ms (Bouchaala et al.,
small-scale velocity heterogeneities near a focal zone which
                                                                            2013). In this study, we select 473 events from the Bouchaala
contains numerous closely-spaced earthquakes recorded at
                                                                            et al. (2013) data set for the P -wave and S-wave velocity
seismic stations with good azimuthal coverage (Zhang and
                                                                            model tomography inversion. Over 8500 P -wave and S-wave
Thurber, 2003). These conditions are met by the clustered
                                                                            arrivals were manually picked, resulting in 73 028 P -wave
nature of the swarm and the West Bohemia seismic monitor-
                                                                            and 72 967 S-wave differential times and 63 656 P -wave and
ing network (WEBNET).
                                                                            59 069 S-wave cross-correlated times.
   As with other seismic tomography methods, the start-
ing model and inversion parameters may lead to artefacts
(Kissling et al., 1994). Checkerboard and other synthetic                   3     Methodology
tests are often used to determine the model resolution. How-
ever, it is difficult to deduce which features are artefacts of             3.1    Double-difference tomography
the parameterization. To address this problem, the weighted
average model (WAM) method is applied to the 2008 swarm                     Double-difference tomography is an adaptation of local
data set (Calò et al., 2011). In this method, a suite of tomogra-           earthquake tomography (LET). Typically, LET is used to
phy models is calculated using a variety of reasonable input                characterize structures between the source locations and the
parameters, such as the starting velocity model and inver-                  receivers. This method is most effective when the events are
sion parameterization. These models are averaged together,                  widely spread. Double-difference tomography is ideal for re-
using a weighting factor defined by each model’s Deriva-                    gions where the events are clustered closely together and can
tive Weight Sum (weighted hit count; Toomey and Foulger,                    image the velocity structures immediately surrounding the
1989). This process reduces bias and artefacts introduced by                cluster (Zhang and Thurber, 2003). This method is termed a
the a priori parametrization. Finally, extensive synthetic and              “double-difference” tomography because the algorithm min-
resolution tests are used to confirm if the imaged velocity                 imizes the modelled and observed travel time difference be-
perturbations are resolved structures or artefacts.                         tween two earthquakes recorded at a single station. As a con-

Solid Earth, 5, 863–872, 2014                                                                          www.solid-earth.net/5/863/2014/
C. Alexandrakis et al.: Velocity structure and the role of fluids                                                                         865

            (a)               P-Wave Velocity                                  Weighted Standard Deviation

                                                              ΔVp
                                                              (%)                                                      WSTD
                                                                  14                                                      0.05

                                                                  0                                                          0.025
            (b)

                                                                  -14                                                        0

Figure 2. P -wave weighted average model (WAM) and weighted standard deviation (WSTD) for profile A-A0 for (a) all stations and (b)
selected stations. Bold arrow indicates the region of high WSTD present when all stations are used, and suppressed when the problematic
station (indicated in b) is removed from the data set. Only areas constrained by the data are shown. P -wave velocities are shown as percentage
difference from the regional model of Málek et al. (2001).

sequence, any influence from velocity anomalies or hetero-                of the starting parametrization (Calò et al., 2011, 2012). In
geneities near the stations is suppressed due to the converg-             order to apply the WAM method, the basic seismic wave
ing raypaths. Detailed knowledge of the near-surface geol-                velocity model is defined on a 3-D Cartesian grid. The
ogy is not required, but no shallow structures are determined.            model parametrization was then perturbed by shifting the
We use the program TomoDD (Zhang and Thurber, 2003) to                    nodes, changing node spacing and rotating the grid. Slightly
jointly invert both P -wave and S-wave velocity models and                faster and slower P -wave velocity models were also used
hypocentre parameters. The P and S travel time catalogues                 by shifting the velocities in depth by ±300 m. In total, 12
are of comparable quality, size and raypath coverage (Sup-                unique starting velocity model parameterizations were de-
plement Fig. S1), allowing for the determination of the P -               fined and applied to the FASTHYPO and HypoDD-located
wave to S-wave velocity ratio (Vp / Vs) calculated by direct              data sets (Supplement Fig. S2). The resulting 24 models were
division of the P -wave and S-wave velocity models.                       then used in the WAM calculation. We also calculated the
   The basic model for this study is the regional gradient P -            weighted standard deviation (WSTD) for both the P - and S-
wave velocity model of Málek et al. (2001) with a uniform                 wave velocity WAMs. The WSTD can indicate the stability
Vp / Vs of 1.70 (Fig. 6). In the shallow part of the model                of structures within the model. A high WSTD indicates that
(down to 4 km), layer thicknesses vary in order to maintain               the velocity field calculated at that location depends on the
the velocity gradient. Below 4 km, the model is defined in                starting parametrization and could therefore be affected by
1 km thick layers. The surface datum coincides with station               artefacts.
NKC’s elevation (609.94 m above sea level) and is centered
at the swarm centroid (50.2105◦ N and 12.4508◦ E).
   To reduce bias from the starting earthquake locations, both            4   Model resolution and synthetic tests
the FASTHYPO- and the HypoDD-located data sets are used
in the WAM calculation.                                                   A first analysis of the velocity models and WAM showed a
                                                                          region with anomalously high P -wave velocities to the east
3.2   Weighted average model analysis                                     of the focal zone, which also corresponds to an area of high
                                                                          WSTD (Fig. 2a). This region has P -wave velocities more
As with many tomography algorithms, artefacts and model                   than 15 % greater than the regional model. Further examina-
bias associated with the starting parametrization are diffi-              tion showed that it correlates to the raypath volume between
cult to quantify. The WAM method reduces the influence                    the hypocentres and a single station. Synthetic tests con-

www.solid-earth.net/5/863/2014/                                                                            Solid Earth, 5, 863–872, 2014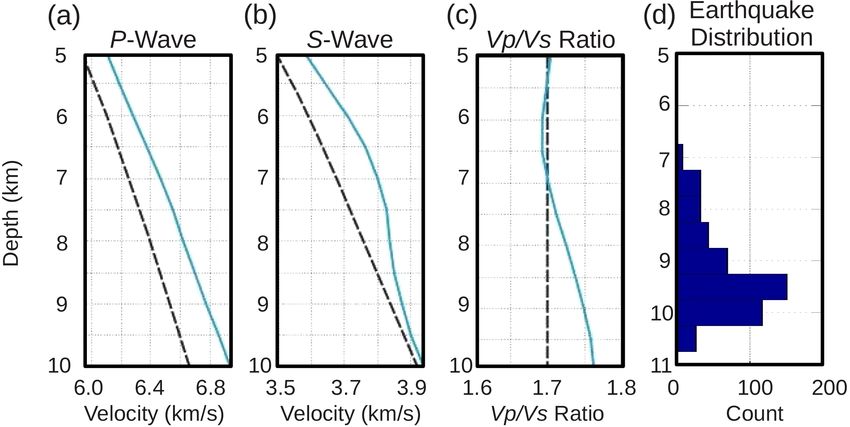
866                                                            C. Alexandrakis et al.: Velocity structure and the role of fluids

firmed that local changes in the surface geology would not          wave velocities are strongly influenced (Fig. 3d). This indi-
produce such an anomaly (Supplement Fig. S3). To test if the        cates that the recovered anomalous P -wave velocities might
anomaly was indeed related to the single station, the WAM           be artefacts if areas display high or low Vp / Vs. However,
analysis was repeated, having removed the data from this sta-       the Vp / Vs ratio itself is properly resolved and can be con-
tion, resulting in reduced WSTD (Fig. 2b). When other sta-          sidered robust.
tions were removed, the resulting models all contained the             In the next test, we add a 2 km thick contrasting layer
same high WSTD region as the WAM calculated with all of             above the blocks (Supplement Fig. S5). For example, in the
the stations included. Based on these tests, the raw data from      model with high P -wave velocity along the fault plane, the
this station were investigated and an error in the onset time       velocities in the overlaying 2 km are decreased by 5 % (Sup-
was found (A. Boušková, personal communication, 2012).              plement Fig. S5a), and in the model with the low Vp / Vs ra-
Therefore, data from this station are excluded from the re-         tio block, the overlaying 2 km have a 5 % higher Vp / Vs ra-
maining tests and interpretations.                                  tio (Supplement Fig. S5c). As above, P and S synthetic travel
   In order to further assess the model resolution, a series        times for each of the synthetic models were calculated using
of synthetic and resolution tests were conducted. The first         the WEBNET earthquake locations and no cross-correlated
test assesses the dependence of the calculated models on the        times are used.
starting velocity model. This was accomplished by running              As with the previous test, the recovered models show that
the tomography with four perturbations of the starting model.       the P -wave velocities are influenced by the Vp / Vs ratio
The first two models were uniformly 0.5 km s−1 faster or            (Supplement Fig. S5b and d). The influence of P -wave ve-
slower than the regional model (Supplement Fig. S4). The            locity changes on the Vp / Vs ratio is minor. These tests show
Vp / Vs was not changed (i.e. Vp / Vs = 1.7), meaning both          that some structures observed in the P -wave velocity model
P -wave and S-wave velocities were perturbed. In the last           may be linked to changes in the Vp / Vs ratio. The calculated
two models, the regional model’s P -wave velocity was un-           Vp / Vs models resolve structures directly above the focal
changed, but the S-wave velocities were perturbed by in-            zone very well. These models are more reliable and can be
creasing or decreasing the Vp / Vs ratio by 0.05 (Supple-           interpreted without consideration of P -wave velocity pertur-
ment Fig. S4). The resulting models show that the calculated        bations.
P -wave velocity is influenced by the starting model. How-             As a final test, we conduct a classical checkerboard for
ever, the Vp / Vs models all show similar structures and val-       each model perturbation used in the WAM, and we then cal-
ues below 5 km, regardless of the starting model (Supplement        culate a checkerboard WAM. The regional model is used to
Fig. S4). This indicates that the resultant Vp / Vs model is        create a checkerboard model with the P -wave velocities al-
stable and independent of the starting model.                       ternating ±5 % within the layers. The Vp / Vs is kept con-
   The next set of tests investigates whether isolated veloc-       stant at 1.7. The checkerboard cell sizes are two horizontal
ity perturbations are recovered. This test is motivated by          nodes wide and one vertical node deep. Consequently, the
strong velocity and Vp / Vs perturbations observed along the        cell volumes are not constant throughout the model. Within
fault plane and directly above the focal zone (see Sect. 5 for      the focal zone, the cells cover a 4 km2 area and are 1 km
details). In the first four models (Fig. 3), a block mimick-        deep (Fig. 4a). Synthetic P and S travel times were calcu-
ing the fault plane is perturbed. This block is 3 km wide in        lated from the WEBNET earthquake locations. Randomly
the x direction, 6 km wide in the y direction, 5 km deep,           distributed errors (±0.01 s for P times and ±0.02 s for S
and all earthquakes lie in this block. Two models have              times) were added to the synthetic times. As with the pre-
the P -wave velocities within the block perturbed by ±5 %           vious synthetic tests, no synthetic cross-correlated times are
(Vp / Vs = 1.7) (Fig. 3a). In the next two models, the Vp / Vs      used. The checkerboard WAM is calculated using the same
ratio is perturbed by ±5 % within the block (Fig. 3c). All          model parameterizations as for the observed data WAM. The
velocities and ratios outside the block correspond to the re-       resulting model (Fig. 4b) is well resolved within the focal
gional model of Málek et al. (2001). P and S synthetic              zone. As expected, velocities near the surface (top 5 km) are
travel times were calculated for the synthetic models using         not resolved.
the WEBNET earthquake locations and the pseudo-bending                 A comparison of the checkerboard WAM with the WSTD
ray tracing algorithm (Um and Thurber, 1987) that tomoDD            values obtained from the observed data (Fig. 4c) shows that
uses to calculate the travel times (Zhang and Thurber, 2003).       the well resolved focal zone corresponds to low experi-
In these tests, the synthetic data are limited to P and S cat-      mental WSTD (WSTD < 0.02 km s−1 ). Regions with high
alogue times and do not include a cross-correlation times.          WSTD show smearing and poor resolution in the checker-
Therefore, these tests represent a “worst case” result.             board WAM. The maximum WSTD is less than 0.03 km s−1
   The models show very good recovery in both shape and             in the focal zone is less and 0.05 km s−1 outside of the focal
magnitude for the Vp / Vs ratios. The models with only P -          zone. These maximum values are significantly lower than ve-
wave velocity perturbation have well-restored P -wave veloc-        locity variations observed in the focal zone. Even considering
ities and Vp / Vs models (Fig. 3b). However, for the models         an error bar of 2σ (∼ 95 % confidence interval), the reliabil-
with Vp / Vs perturbations, it is evident that the recovered P -    ity of the anomalies remains very high. Furthermore, there is

Solid Earth, 5, 863–872, 2014                                                                  www.solid-earth.net/5/863/2014/
C. Alexandrakis et al.: Velocity structure and the role of fluids                                                                        867

                        Input Model                                P-Velocity Perturbation                Vp/Vs Perturbation
      (a)                                                    (b)

                                                ΔVp
                                                (%)
                                                   5

                                                    0

                                                    -5

       (c)              Input Model                          (d)   P-Velocity Perturbation                Vp/Vs Perturbation

                                              ΔVp/Vs
                                               (%)
                                                  5

                                                    0

                                                    -5

                                                                                ΔVp (%)                           ΔVp/Vs (%)
                                                                           -5      0      5                      -5      0      5

Figure 3. Anomaly restoration synthetic test. A block 3 km wide in the x direction, 6 km wide in the y direction, 5 km deep and enclosing
all earthquakes is perturbed. Within the block, (a) P wave velocities are modified by ±5 % or (c) Vp / Vs ratio is perturbed by ±5 %. All
velocities and ratios outside the block correspond to the regional model of Málek et al. (2001). The recovered models – (b) and (d) – all show
that the Vp / Vs is well recovered. The recovered P -wave velocity models show some smearing and are also influenced by fluctuation in the
Vp / Vs ratio.

no spatial correlation between the highest WSTDs and sig-                (Scarfi et al., 2007), volcanoes (Agostinetti and Chiarabba,
nificant velocity anomalies indicating a low dependence on               2008) and hydrocarbon exploration (Zhang et al., 2009). Sev-
the initial parameters. Since the focus of the discussion is on          eral studies have indicated that fluids may also play a role
the Vp / Vs model, the interpretation will be constrained to             in the periodic swarms in Nový Kostel (Bräuer et al., 2005;
regions where the observed WSTD values for both the P and                Geissler et al., 2005; Heinicke et al., 2009; Hainzl et al.,
S model are 0.02 km s−1 or less.                                         2012; Špičák and Horálek, 2001).
                                                                            There are two main structures in the Vp / Vs WAM: the
                                                                         high Vp / Vs concentrated along the fault plane and the
5   Results and interpretation                                           low Vp / Vs layer directly above the focal zone (Fig. 5).
                                                                         The Nový Kostel focal zone has a mean Vp / Vs ratio of
In crustal rocks, compressional and shear wave velocities                1.73 ± 0.04, indicating a clear increase from the regional
(and thus Vp / Vs) are dependent on several factors, such as             value of 1.70 (Málek et al., 2001). These high values are
composition, temperature, pressure, microcrack density, pore             concentrated around the relocated hypocentres, which also
pressure and fracture density. The Vp / Vs has been used as              correlate with the 169◦ principal fault (Vavryčuk, 2011). The
an indicator of fluids within many earthquake settings, such             base of the overlaying layer with low Vp / Vs corresponds to
as subduction zones (Husen and Kissling, 2001; Calò et al.,              the depth of the shallowest relocated earthquakes. This over-
2012), shear zones (McLaren et al., 2008), collision zones

www.solid-earth.net/5/863/2014/                                                                           Solid Earth, 5, 863–872, 2014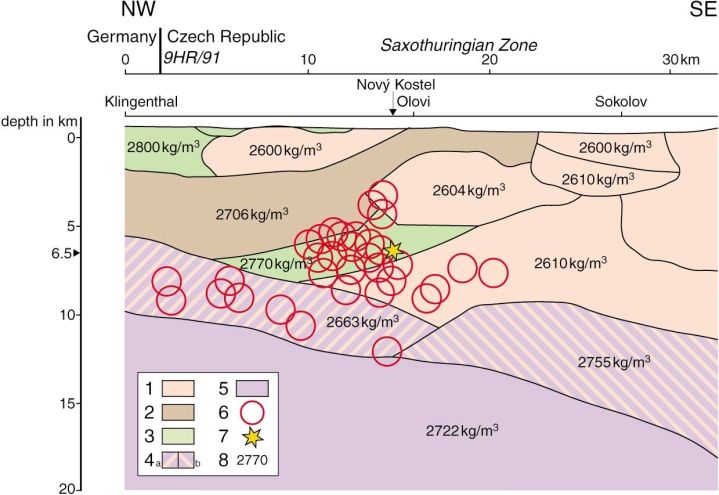
868 C. Alexandrakis et al.: Velocity structure and the role of fluids
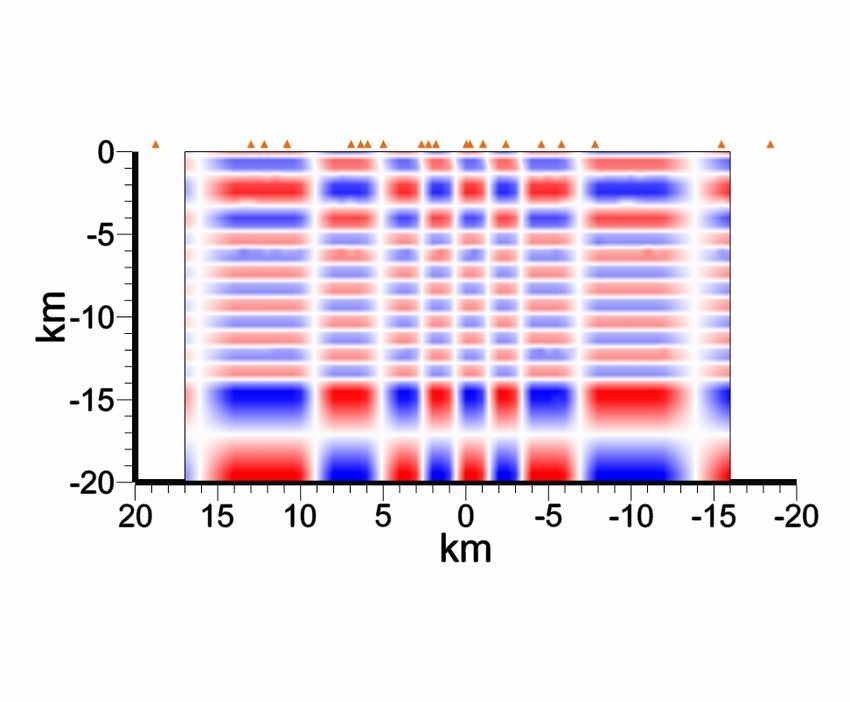
(a) (b) (c)
-5 0 5 -5 0 5 0 0.025 0.05
ΔVp (%) ΔVp (%) WSTD
Figure 4. Checkerboard resolution test. North–south and east–west profiles (top and bottom, respectively) showing (a) the starting checker-
board model with a ±5 % variation in P -wave velocity, (b) the recovered weighted average model (WAM) and (c) the weighted standard
deviation (WSTD) from the observed data. Shallow areas (depth less than 5 km) are not resolved. Within the focal zone, areas with poor
checkerboard resolution coincide with WSTD values greater than 0.03 km s−1 . Only areas constrained by the data are shown.
(a) (b)
A A´ B B´
(c) 8 km (d) 9 km
Vp/Vs
1.85 8.8 %
1.70 0%
1.55 -8.8 %
Figure 5. Vp / Vs ratio weighted average model. In the across-strike (a) and along-strike (b) profiles, the focal zone is characterized by high
Vp / Vs values. Depth slices through the hypocentres at 8 km (c) and 9 km (d) show that these higher values concentrate along the fault plane.
An almost-continuous layer of low Vp / Vs overlays the hypocentres between 5 and 7 km. Grey mask shows areas with WSTD greater than
0.03 km s−1 . Only areas constrained by the data are shown. Earthquake hypocentres are projected onto the profiles and depth slices.
Solid Earth, 5, 863–872, 2014 www.solid-earth.net/5/863/2014/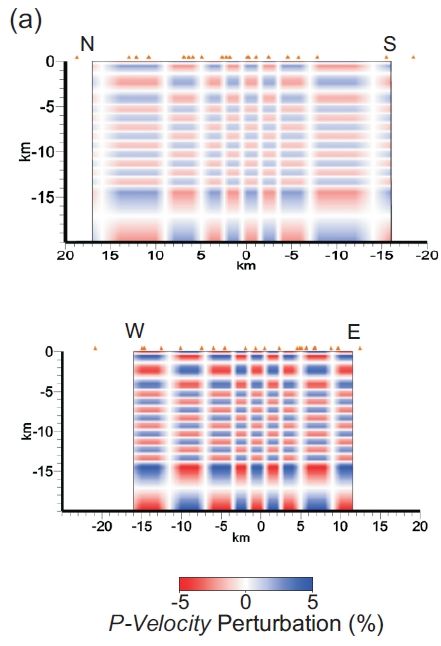
C. Alexandrakis et al.: Velocity structure and the role of fluids                                                                   869

Table 1. Average seismic velocities within the Nový Kostel focal
zone calculated from the weighted average model (WAM).

       Depth    Mean P -wave      Mean S-wave      Mean
                     velocity         velocity    Vp / Vs
        (km)        (km s−1 )        (km s−1 )      ratio
            5             6.10             3.58       1.70
          5.5             6.19             3.64       1.70
            6             6.28             3.71       1.69
          6.5             6.37             3.76       1.69
            7             6.46             3.80       1.70
          7.5             6.55             3.83       1.71           Figure 6. Average P -wave velocities (a), S-wave velocities (b), and
            8             6.62             3.84       1.73           Vp / Vs ratio values (c) within the focal zone. The average WAM
          8.5             6.69             3.85       1.74           values (solid lines) are calculated for all resolved nodes within
            9             6.77             3.87       1.75           ±4 km from the grid origin and in 0.5 km thick layers. The distri-
          9.5             6.86             3.90       1.76           bution of earthquake source in depth (d) is also shown. Please note
           10             6.94             3.94       1.76           the different depth scale in (d). Dashed lines indicate the regional
                                                                     model from Málek et al. (2001).

laying layer (∼ 5–7 km) has a mean Vp / Vs ratio value of
1.70 ± 0.03. These structures are interpreted in terms of lo-        has indicated tensile fracturing during the 1997 and 2008
cal geology and the potential role of fluids in the Nový Kostel      swarms (Vavryčuk, 2002; Vavryčuk et al., 2013). This type of
Seismic Zone. For comparison, the P -wave and S-wave ve-             fracturing may relate to high pore fluid pressure (Vavryčuk,
locity WAM is shown in Supplement Fig. S6.                           2002). The area of high Vp / Vs values does not extend past
   First, we look at the average values within the focal zone        the shallowest hypocentre, indicating that any fractures and
(Fig. 6 and Table 1). This is calculated over a lateral extent       fluids are limited to the rupture zone (Fig. 6d).
of ±4 km in x and y and 0.5 km depth intervals. As was                  Beneath the Cheb Basin, the shallow and mid-crust geol-
also seen in the profiles (Fig. 5), the transition between the       ogy is dominated by the Fichtelgebirge (Smrčiny) granitic
layer exhibiting low Vp / Vs ratio and the focal zone fea-           complex (Hecht et al., 1997). The geological structures un-
turing high Vp / Vs ratio values occurs at a depth of 7 km.          derlying the Nový Kostel Seismic Zone are derived mainly
Within the fault zone (7–10 km depth) and overlaying layer           from surface geology, gravity modelling (Hecht et al., 1997;
(5–7 km depth), the mean Vp / Vs ratio is 1.73 ± 0.04 and            Nehybka and Skácelová, 1997) and the 9HR/91 reflection
1.70 ± 0.03, respectively. The range of Vp / Vs values within        seismic survey (Tomek et al., 1997). Gravity studies have
the fault zone and overlaying layer are all in the documented        shown that the Fichtelgebirge granitic complex correlates to
range for igneous and metamorphic rocks, including gran-             a large, low-gravity anomaly which extends down to a depth
ites and gneisses (Gercek, 2007). These ratio values are con-        of at least 6 km beneath Nový Kostel, and has its root along
sistent with measurements of granite, gneiss and schist at           the Mariánské-Lázně Fault (Hecht et al., 1997). Throughout
200 MPa. The higher ratios within the focal zone also cor-           the rest of the basin, the granitic complex is thin and has its
relate with phyllite measurements at 200 MPa (Christensen,           base at 2–3 km. Nový Kostel is located less than 2 km from
1996).                                                               the northern edge of the granitic complex, so the base de-
   Studies of wet and dry granitic and gneissic samples have         creases very rapidly from a depth of ∼ 6 to ∼ 2 km (Hecht et
shown that the P -wave velocity increases with saturation            al., 1997). The remaining upper crust is composed of various
(Kahraman, 2007). This has also been shown for saturated             granites, metasediments and metabasites (Fig. 7; Hecht et al.,
rocks under overpressured conditions (Ito et al., 1979; Popp         1997; Nehybka and Skácelová, 1997).
and Kern, 1994). Even if the calculated velocity model val-             In Fig. 7, the structures observed in the Vp / Vs WAM are
ues are dependent on the starting model, the average P -wave         compared to a model derived from the 9HR/91 seismic pro-
velocity gradient increases with depth and a distinct decrease       file and gravity modelling (Nehybka and Skácelová, 1997;
in average S-wave velocity occurs at 7 km. The resulting high        Tomek et al., 1997). The most prominent feature in this pro-
Vp / Vs ratio values observed along the fault plane may in-          file is the region of low Vp / Vs, directly above the focal zone
dicate that the rupture area consists of fluid-filled, fractured     (between 5 and 7 km deep). The transition from low to high
rock under overpressured conditions, which can be caused by          Vp / Vs (with respect to the regional value of 1.70) corre-
fluids or their migration in the presence of a structural barrier.   lates with the base of the Fichtelgebirge granitic complex
This is consistent with previous results showing overpres-           in this area (Hecht et al., 1997). Also, when the earthquake
sured conditions during the 2008 swarm (Hainzl et al., 2012).        foci are projected onto the geological section from Weise et
In addition, moment tensor analysis of swarm earthquakes             al. (2001), as shown in Fig. 7, they concentrate within the

www.solid-earth.net/5/863/2014/                                                                       Solid Earth, 5, 863–872, 2014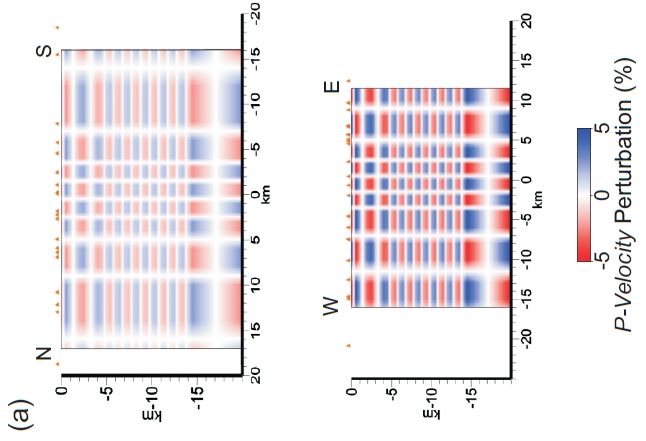
870                                                                      C. Alexandrakis et al.: Velocity structure and the role of fluids

                    NW                                              SE               NW                              SE     Vp/Vs
                0                                                                0                                        1.85   8.8 %
                     M        G                                G
                                             G             G         G
                          F
               -5                                                               -5
                                         M             G

                                                                           km
                                                                                                                          1.70   0%
          km

            -10                    CU                                       -10
                                                       CU
            -15                                                                                                           1.55   -8.8 %
                                                                            -15
                                             CU                                      -10   -5    0        5     10   15
            -20                                                                                      km
                    0             10             20                30 km
                         2008 Swarm                   Earthquake hypocenters (1991-1994)                      1994 Swarm centroid

                    G – Granites
                    M - Metasediments and Metabasites
                    CU - Crust units with no surface reference
                    F - Fichtelgebirge (Smrčiny) and Erzgebirge (Krušné hory) Crystalline Unit

Figure 7. Comparison between a geological interpretation of the Nový Kostel Seismic Zone (left), based on the 9HR/91 seismic profile and
gravity modelling (Nehybka and Skácelová, 1997; Tomek et al., 1997) and the Vp / Vs weighted average model (right). The Vp / Vs model
profile is parallel to 9HR/91 and passes through the focal zone (profile C-C’ in Fig. 1). Only areas constrained by the data are shown. Dashed
lines show the layer exhibiting low Vp / Vs values, black circle shows the location of the 2008 swarm, red circles show past earthquake
hypocentres (1991–1994) and yellow star shows the 1994 swarm centroid. Crust Units: G – granites, M – metasediments and metabasites,
CU – crustal units with no surface reference, F – Fichtelgebirge and Erzgebirge crystalline unit. Geological profile (left) modified from Weise
et al. (2001).

granites. However, it should be noted that earthquakes occur-                    there. The fluids migrate along the base of the Fichtelgebirge
ring on the northern section of the Nový Kostel fault plane                      granitic complex, which results in the observed trend of shal-
(mainly inactive during the 2008 swarm) tend to occur at                         lower foci towards the end of the swarm period, and the shal-
overall shallower depths (Fischer et al., 2010), such as the                     lower seismic activity to the north. The newly formed cracks
1991–1994 hypocentres. We suggest that the transition from                       provide new pathways for fluids. As the pore pressure de-
low to high Vp / Vs values denotes the base of the Fichtelge-                    creases, the cracks and fractures close and the system returns
birge granitic complex, and that it bounds the seismic activity                  to the initial conditions. This cycle of pore pressure increase
to certain depths. Furthermore, the granitic intrusion may be                    and decrease may explain the periodic nature of the swarm
a boundary blocking uprising magmatic fluids.                                    seismicity in Nový Kostel.
   To investigate the possibility of the Fichtelgebirge granitic                    A recently published study by Růžek and Horálek (2013)
complex acting as a rupture boundary and possibly even a                         presented P -wave and S-wave velocity tomography models
fluid trap, we calculate the brittleness index (Rickman et al.,                  for the West Bohemia area. These models were further inter-
2008) for the focal zone and overlaying layer. The brittleness                   preted to provide Poisson’s ratio, bulk modulus and Vp / Vs
index is a relative measure of the ease with which a material                    models for the region. These models cannot be directly com-
will fracture, calculated from its Poisson ratio and Young’s                     pared to the P -wave velocity or the Vp / Vs WAM model
modulus. A low index value indicates that a rock is resistant                    presented here due to significant differences in resolution.
to fracturing. Assuming a uniform density within the focal                       According to Růžek and Horálek (2013), their models can
zone and for the overlaying layer, we find that the brittle-                     resolve structures with a minimum size of 15 km laterally
ness index for the overlaying layer (36.41) is indeed lower                      and 6 km vertically. The entire resolved area of our model
than the index for the focal zone (41.94). The lack of seismic                   is only slightly larger than these dimensions. Our synthetic
activity within this layer confirms its lower brittleness and                    tests show that the resolved area in our model can reliably
resistance to fracturing. In addition to its lower brittleness,                  image structures which extend in the order of 2–3 km later-
the Fichtelgebirge granitic complex may also have a lower                        ally and 2 km vertically. Our interpretation is based on these
porosity and/or permeability. As the upper mantle-derived                        fine-scale structures. In order to compare the models in a gen-
fluids migrate towards the surface, they are trapped below                       eral sense, we analysed the images of the Vp / Vs ratio depth
this layer, the pore pressure increases and causes changes to                    slices provided by Růžek and Horálek (2013) as supplemen-
the local stress field, facilitating slip-along pre-existing frac-               tary data. These images show an increase in Vp / Vs near
tures or even allowing new fractures to form. Since the under-                   Nový Kostel. However, the colour scale does not allow for a
lying rock is more brittle, the fractures preferentially occur                   precise comparison of the values. For this reason, we look to-

Solid Earth, 5, 863–872, 2014                                                                                  www.solid-earth.net/5/863/2014/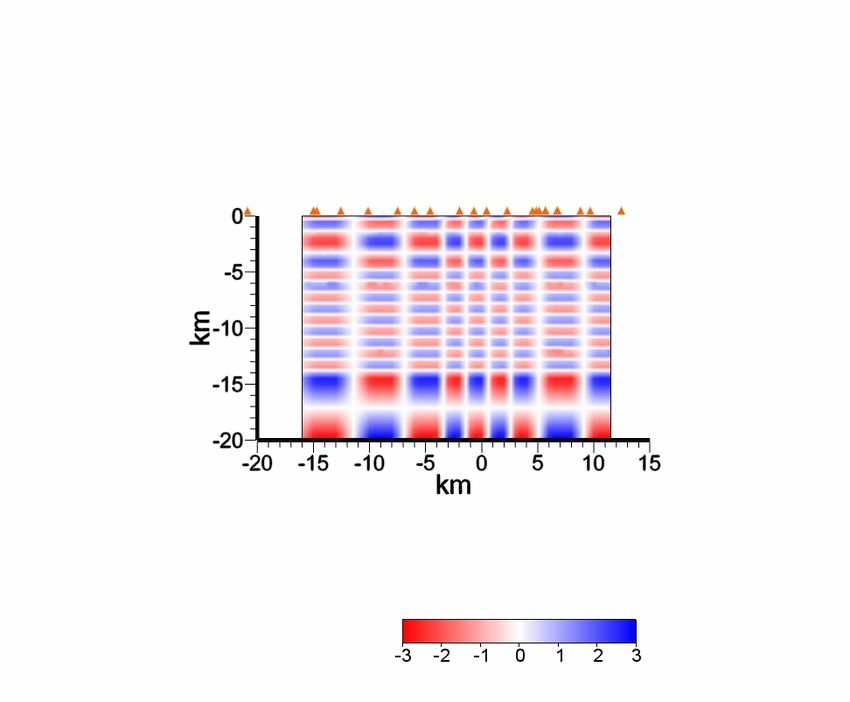
C. Alexandrakis et al.: Velocity structure and the role of fluids                                                                   871

wards the average Vp / Vs values calculated directly from the      The Supplement related to this article is available online
average P -wave and S-wave velocity (digitized from their          at doi:10.5194/se-5-863-2014-supplement.
Fig. 7). It is evident that the average Vp / Vs values are over-
all greater than ours, but they show a similar trend towards
higher values with depth. Finally, the authors also note that
the Poisson’s ratio at 3 km below station NKC is low and thus
                                                                   Acknowledgements. This study was funded through the European
shows a tendency towards increased brittleness. This contra-
                                                                   Community’s FP7 Consortium Project AIM “Advanced Industrial
dicts our interpretation of low brittleness in the shallow ar-     Microseismic Monitoring”, Grant Agreement no. 230669 and by
eas and higher brittleness deeper, and within, the focal zone.     the Grant Agency of the Czech Republic, Grant no. 210/12/1491.
However, since the depth commented on is not resolved in           We thank J. Horálek, T. Fischer, A. Boušková and the WEBNET
our analysis, we therefore cannot exclude this interpretation.     group for providing the earthquake travel times and locations.
                                                                   V. Babuška, J. Plomerová, P. Hrubcová, W. Geissler, S. Buske,
                                                                   S. Shapiro and C. Langenbruch are thanked for the stimulating
6    Conclusions                                                   discussions. D. Kuehn, E. Korger and an anonymous reviewer are
                                                                   thanked for their insightful reviews which improved the quality of
Past studies of the Nový Kostel Seismic Zone have indicated        this manuscript.
that fluids may be an important component of the swarm cy-
cle. This hypothesis is addressed here by analysing the first      Edited by: W. Geissler
detailed Vp / Vs model of the focal zone. The results of this
study can be summarized by the following points:
                                                                   References
    – The Nový Kostel focal zone is characterized by high
      Vp / Vs values which concentrate along the 2008 swarm        Agostinetti, N. P. and Chiarabba, C.: Seismic structure beneath Mt
      principal fault plane.                                          Vesuvius from receiver function analysis and local earthquake
                                                                      tomography: evidences for location and geometry of the magma
    – A layer of low Vp / Vs directly overlays the fault zone.        chamber, Geophys. J. Int., 175, 1298–1308, 2008.
                                                                   Bankwitz, P., Schneider, G., Kämpf, H., and Bankwitz, E.: Struc-
    – Earthquakes in this swarm only occur below 7 km depth,
                                                                      tural characteristics of epicentral areas in Central Europe: study
      which correlates with the boundary between the low and          case Cheb Basin (Czech Republic), J. Geodynam., 35, 5–32,
      high Vp / Vs regions.                                           2003.
                                                                   Bouchaala, F., Vavryčuk, V., and Fischer, T.: Accuracy of the
    – The low Vp / Vs layer correlates to modelled estimates
                                                                      master-event and double-difference locations: synthetic tests and
      of the base of the Fichtelgebirge granitic complex in this
                                                                      application to seismicity in West Bohemia, Czech Republic, J.
      area.                                                           Seismol., 17, 841–859, 2013.
    – The high Vp / Vs region correlates with the 2008 swarm       Bräuer, K., Kämpf, H., Niedermann, S., and Strauch, G.: Ev-
                                                                      idence for ascending upper mantle-derived melt beneath the
      seismicity.
                                                                      Cheb basin, central Europe, Geophys. Res. Lett., 32, L08303,
    – A comparison of the brittleness index for the metamor-          doi:10.1029/2004GL022205, 2005.
      phic and granite units indicates that fractures will pref-   Calò, M., Dorbath, C., Cornet, F., and Cuenot, N.: Large-scale aseis-
      erentially occur below the Fichtelgebirge granites. This        mic motion identified through 4-D P-wave tomography, Geo-
      is confirmed by the earthquake source locations.                phys. J. Int., 186, 1295–1314, 2011.
                                                                   Calò, M., Dorbath, C., Luzio, D., Rotolo, S. G., and D’Anna, G.:
    – The low brittleness index of the overlaying layer indi-         Seismic velocity structures of southern Italy from tomographic
      cates that it may bound the seismicity to certain depths        imaging of the Ionian slab and petrological inferences, Geophys.
      and may also act as a fluid trap.                               J. Int., 191, 751–764, 2012.
                                                                   Fischer, T., Horálek, J., Michálek, J., and Boušková, A.: The 2008
From these results, we hypothesize that the layer of low              West Bohemia earthquake swarm in the light of the WEBNET
Vp / Vs marks the upper boundary of the seismogenic zone              network, J. Seismol., 14, 665–682, 2010.
and may also block uprising fluids. Over time, the pore pres-      Fischer, T., Horálek, J., Hrubcová, P., Vavryčuk, V., Bräuer, K.,
sure increases and the focal zone preferentially fractures due        and Kämpf, H.: Intra-continental earthquake swarms in West-
to its higher brittleness.                                            Bohemia and Vogtland: a review, Tectonophysics, 611, 1–27,
                                                                      2014.
   Given the large number of earthquakes recorded in the
                                                                   Geissler, W. H., Kämpf, H., Kind, R., Bräuer, K., Klinge, K., Plene-
2008 swarm, a follow-up study using the full event cata-              fisch, T., Horálek, J., Zedník, J., and Nehybka, V.: Seismic struc-
logue and 4-D tomography may image changes in the veloc-              ture and location of a CO2 source in the upper mantle of the
ity structure throughout the proposed cycle. Also, an analysis        western Eger (Ohře) rift, central Europe, Tectonics, 24, TC5001,
of other well-documented swarms will further illuminate the           doi:10.1029/2004TC001672, 2005.
structures within the Nový Kostel Seismic Zone and the role
of fluids in the swarm activity.

www.solid-earth.net/5/863/2014/                                                                      Solid Earth, 5, 863–872, 2014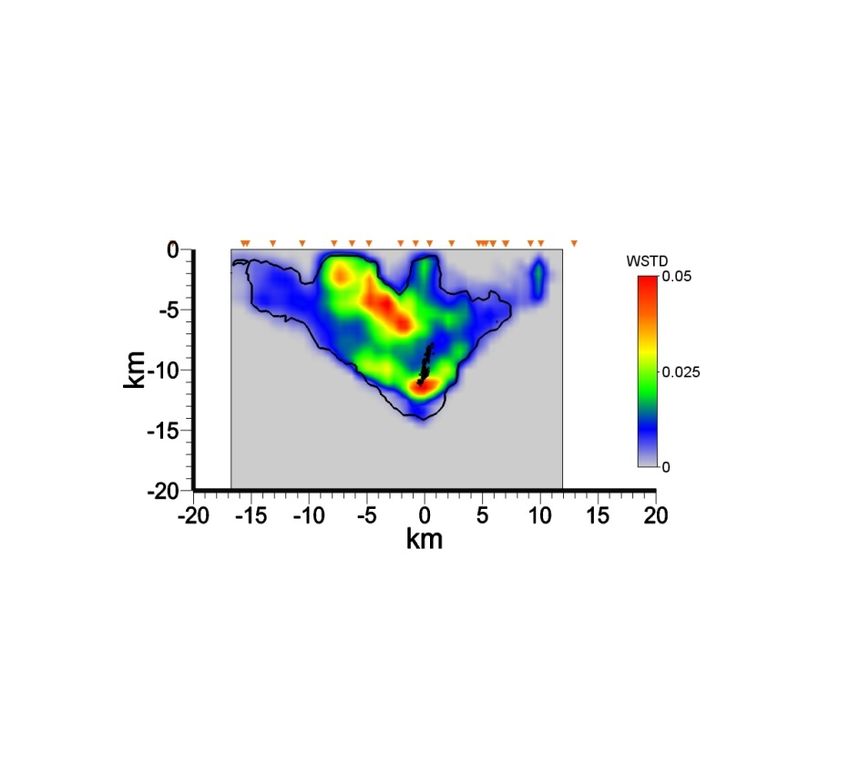
872                                                                   C. Alexandrakis et al.: Velocity structure and the role of fluids

Hainzl, S., Fischer, T., and Dahm, T.: Seismicity-based estimation         Rickman, R., Mullen, M., Petre, E., Greiser, B., and Kundert, D.:
   of the driving fluid pressure in the case of swarm activity in West-       A practical use of shale petrophysics for stimulation design opti-
   ern Bohemia, Geophys. J. Int., 191, 271–281, 2012.                         mization: all shale plays are not clones of the Barnett shale, 2008
Hecht, L., Vigneresse J. L., and Morteani, G.: Constraints on the             SPE Annual Technical Conference and Exhibition, Denver, Col-
   origin of zonation of the granite complexes in the Fichtelgebirge          orado, USA, 21–24 September 2008, SPE 115258, 2008.
   (Germany and Czech Republic): evidence from a gravity and               Růžek, B. and Horálek, J.: Three-dimensional seismic velocity
   geochemical study, Geol. Rundsch., 86, S93–S109, 1997.                     model of the West Bohemia/Vogtland seismoactive region, Geo-
Heinicke, J., Fischer T., Gaupp, R., Götze, J., Koch, U., Konietzky,          phys. J. Int., 195, 1251–1266, 2013.
   H., and Stanek, K.-P.: Hydrothermal alteration as a trigger mech-       Růžek, B., Hrubcová, P., Novotný, M., Špičák, A., and Karousová,
   anism for earthquake swarms: the Vogtland/NW Bohemia region                O.: Inversion of travel times obtained during active seismic
   as a case study, Geophys. J. Int., 178, 1–13, 2009.                        refraction experiments CELEBRATION 2000, ALP 2002 and
Herrmann, R. B.: FASTHYPO – a hypocenter location program,                    SUDETES 2003, Stud. Geophys. Geod., 51, 141-164, 2007.
   Earthquake Notes, 50, 25–37, 1979.                                      Scarfi, L., Giampiccolo, E., Musumeci, C., Patane, D., and Zhang,
Hrubcová, P., Sroda, P., Špičák, A., Guterch, A., Grad, M.,                  H.: New insights on 3-D crustal structure in southeastern Sicily
   Keller, G. R., Brueckl, E., and Thybo, H.: Crustal and up-                 (Italy) and tectonic implications from an adaptive mesh seismic
   permost mantle structure of the Bohemian Massif based on                   tomography, Phys. Earth Planet. Int., 161, 74– 85, 2007.
   CELEBRATION 2000 data, J. Geophys. Res., 110, B11305,                   Špičák, A. and Horálek, J.: Possible role of fluids in the process
   doi:10.1029/2004JB003080, 2005.                                            of earthquake swarm generation in the West Bohemia/Vogtland
Hrubcová, P., Vavryčuk, V., Boušková, A., and Horálek, J.: Moho              seismoactive region, Tectonophysics, 336, 151–161, 2001.
   depth determination from waveforms of microearthquakes in the           Švancara, J., Havíř, J., and Conrad, W.: Derived gravity field of the
   West Bohemia/Vogtland swarm area, J. Geophys. Res., 118, 120–              seismogenic upper crust of SE Germany and West Bohemia and
   137, 2013.                                                                 its comparison with seismicity, Stud. Geophys. Geod., 52, 567–
Husen, S. and Kissling, E.: Postseismic fluid flow after the large            588, 2008.
   subduction earthquake of Antofagasta, Chile, Geology, 29, 847–          Tomek, Č., Dvořáková, V., and Vrána, S.: Geological interpreta-
   850, 2001.                                                                 tion of the 9HR and 503M seismic profiles in Western Bohemia,
Ito, H., De Vilbiss, J., and Nur, A.: Compressional and shear waves           Vrána, S. and Štrědrá, V., Czech Geological Survey, Prague, J.
   in saturated rock during water-steam transition, J. Geophys. Res.,         Geol. Sci. Ser. Geol., 47, 43–50, 1997.
   89, 4731–4735, 1979.                                                    Toomey, D. R. and Foulger, G. R.: Tomographic inversion of lo-
Kissling, E., Ellsworth, W. L., Eberhart-Phillips, D., and Kradolver,         cal earthquake data from the Hengill-Grensdalur central volcano
   U.: Initial reference models in local earthquake tomography, J.            complex, Iceland, J. Geophys. Res., 94, 17497–17510, 1989.
   Geophys. Res., 99, 19635–19646, 1994.                                   Um, J. and Thurber, C.: A fast algorithm for two-point seismic ray
Málek, J., Horálek, J., and Janský, J.: One-dimensional qP-wave               tracing, Bull. Seis. Soc. Am., 77, 3, 972–986, 1987.
   velocity model of the upper crust for the West Bohemia/Vogtland         Vavryčuk, V.: Non-double-couple earthquakes of January 1997 in
   earthquake swarm region, Stud. Geophys. Geod., 49, 501–524,                West Bohemia, Czech Republic: Evidence of tensile faulting,
   2001.                                                                      Geophys. J. Int., 149, 364–373, 2002.
McLaren, M. K., Hardebeck, J. L., van der Elst, N., Unruh, J. R.,          Vavryčuk, V.: Principal earthquakes: Theory and observations for
   Bawden, G. W., and Blair, J. L.: Complex faulting associated               the 2008 West Bohemia swarm, Earth Planet. Sci. Lett., 305,
   with the 22 December 2003 Mw 6.5 San Simeon, California,                   290–296, 2011.
   earthquake, aftershocks, and postseismic surface deformation,           Vavryčuk, V., Bouchaala, F, and Fischer, T.: High-resolution fault
   Bull. Seis. Soc Am., 98, 1659–1680, 2008.                                  image from accurate locations and focal mechanisms of the 2008
Mlčoch, B. and Skácelová, Z.: Digital elevation model of the crys-           swarm earthquakes in West Bohemia, Czech Republic, Tectono-
   talline basement of the Cheb and Sokolov Basin areas (Western              physics, 590, 189–195, 2013.
   Bohemia, central Europe), Z. Geol. Wiss., 3, 145–152, 2009.             Waldhauser, F. and Ellsworth, W. L.: A double-difference earth-
Nehybka, V. and Skácelová, Z.: Seismological study of the                     quake location algorithm: method and application to the Hay-
   Kraslice/Vogtland-Oberpfalz region, in: Geological Model of                ward fault, Bull. Seism. Soc. Am., 90, 1353–1368, 2000.
   Western Bohemia in Relation to Deep Borehole KTB in the FGR,            Weise, S. M., Bräuer, K., Kämpf, H., Strauch, G., and Koch, U.:
   edited by: Vrána, S. and Štrědrá, V., Czech Geological Survey,            Transport of mantle volatiles through the crust traced by seis-
   Prague, J. Geol. Sci. Ser. Geol., 47, 186–190, 1997.                       mically released fluids: a natural experiment in the earthquake
Peterek, A., Reuther, C. D., and Schunk, R.: Neotectonic evolution            swarm area Vogtland/NW Bohemia, Central Europe, Tectono-
   of the Cheb Basin (Northwestern Bohemia, Czech Republic) and               physics, 336, 137–150, 2001.
   its implications for the late Pliocene to Recent crustal deforma-       Zhang, H. and Thurber, C. H.: Double-difference tomography: the
   tion in the western part of the Eger Rift, Z. Geol. Wiss., 39, 335–        method and its application to the Hayward fault, California, Bull.
   365, 2011.                                                                 Seism. Soc. Am., 93, 1175–1189, 2003.
Popp, T. and Kern, H.: The influence of dry and water saturated            Zhang, H., Sarkar, S. Toksöz, M. N., Kueli, H. S., and Al-Kindy,
   cracks on seismic velocities of crustal rocks – A comparison of            F.: Passive seismic tomography using induced seismicity at a
   experimental data with theoretical model, Surv. Geophys., 15,              petroleum field in Oman, Geophysics, 74, WCB57–WCB69,
   443–465, 1994.                                                             2009.

Solid Earth, 5, 863–872, 2014                                                                            www.solid-earth.net/5/863/2014/
You can also read