Google Trends Analysis of COVID-19 Pandemic
←
→
Page content transcription
If your browser does not render page correctly, please read the page content below
Google Trends Analysis of COVID-19
                                        Pandemic
                                        Hoang Long Nguyen 1,∗ , Zhenhe Pan 1,∗ , Hashim Abu-gellban1 , Fang Jin2 , and
                                        Yuanlin Zhang1
                                        1 Department          of Computer Science, Texas Tech University
                                        2 Department          of Statistics, George Washington University
                                        Correspondence*:
                                        Zhenhe Pan
                                        zhenpan@ttu.edu
                                        Hoang Long Nguyen
arXiv:2011.03847v1 [cs.LG] 7 Nov 2020

                                        long.nguyen@ttu.edu

                                        ABSTRACT
                                          The World Health Organization (WHO) announced that COVID-19 was a pandemic disease
                                        on the 11th of March as there were 118K cases in several countries and territories. Numerous
                                        researchers worked on forecasting the number of confirmed cases since anticipating the growth
                                        of the cases helps governments adopting knotty decisions to ease the lockdowns orders for
                                        their countries. These orders help several people who have lost their jobs and support gravely
                                        impacted businesses. Our research aims to investigate the relation between Google search
                                        trends and the spreading of the novel coronavirus (COVID-19) over countries worldwide, to
                                        predict the number of cases. We perform a correlation analysis on the keywords of the related
                                        Google search trends according to the number of confirmed cases reported by the WHO. After
                                        that, we applied several machine learning techniques (Multiple Linear Regression, Non-negative
                                        Integer Regression, Deep Neural Network), to forecast the number of confirmed cases globally
                                        based on historical data as well as the hybrid data (Google search trends). Our results show that
                                        Google search trends are highly associated with the number of reported confirmed cases, where
                                        the Deep Learning approach outperforms other forecasting techniques. We believe that it is not
                                        only a promising approach for forecasting the confirmed cases of COVID-19, but also for similar
                                        forecasting problems that are associated with the related Google trends.
                                        Keywords: coronavirus, covid’19, forecasting, search trends, neural networks, machine learning, spatio-temporal analysis

                                        1      INTRODUCTION
                                        Since the outbreak of coronavirus in December, 2019 in Wuhan, China, COVID-19 is spreading
                                        exponentially and has already effected nearly every county in the world, infecting millions of people
                                        and causing more than tens of thousand deaths around the world (as of March 16, 2020), as shown in Figure
                                        1. It has caused extremely catastrophic social and economic damage throughout the world. Coronavirus
                                        job losses could total 47 million, the unemployment rate may hit 32%, according to a Federal Reserve
                                        estimate.1 To predict the infected patient number is crucially important to both individual and decision
                                        makers preparedness, and to flatten the curves. However, how to accurately predict the number of infected

                                        1   https://www.cnbc.com/2020/03/30/coronavirus-job-losses-could-total-47-million-unemployment-rate-of-32percent-fed-says.html

                                                                                                                                                                         1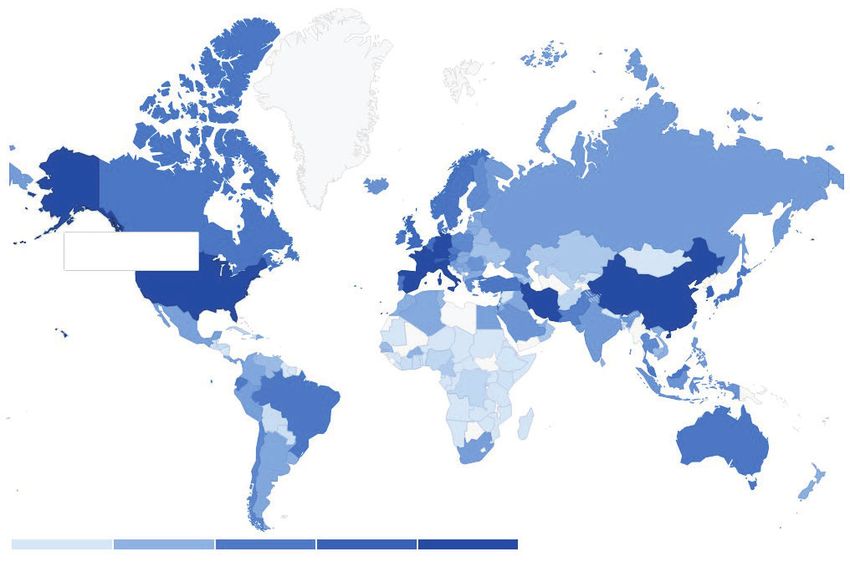
Pan et al.                                                           Google Trends Analysis of COVID-19

patients is never a trivial task. There are numerous factors contribute to this virus’s propagation, such as
population mobility, temperature, and medical condition.
  Ferguson et al. Ferguson et al. (2020) applied a previously published microsimulation model to the UK
and the US dataset, and concluded that to flatten the curve requires a combination of social distancing of the
entire population, home isolation of cases and household quarantine of their family members. The authors
also estimated that up to 2.2 million people could die if no actions were taken to stop transmission in the
US. Using another statistical model, Murray et al. COVID et al. (2020) predict that the US infected patient
number would peak around April 15. At this peak date, the US is projected to need 220, 643 total hospital
beds (32, 976 for ICU), and 26, 381 ventilators to support COVID-19 patients. Nationwide COVID-19
deaths are predicted to also peak on April 15, escalating to 2, 214 deaths per day on average. Nationwide,
the mean value of the total COVID-19 deaths is projected at about 84, 000.
  Unfortunately, most of the existing model based prediction approaches rely on some oversimplified
assumptions such as virus travel distance, and timely and effective quarantine measures. However, these
assumptions are rarely justified because the social structure is widespread. In addition, since this virus
is still novel to the human being, and there are still so many unknown about spreading patterns, severity,
and many more, which may introduce high irreducible error James et al. (2013). For example, Lydia
Bourouiba Ferguson et al. (2020) recently demonstrated a Respiratory Emissions model is much more
complicated than the traditional established model, and the peak exhalation speeds can reach up to 33
to 100 feet per second, creating a cloud that can span approximately 23 to 27 feet, which is far larger
than the current recommended social distancing (around 6 feet). A 2020 report from China demonstrated
that severe acute respiratory syndrome coronavirus 2 (SARS-CoV-2) virus particles could be found in the
ventilation systems in hospital rooms of patients suggesting these virus particles can travel long distances
from patients.
  Nowadays, more and more people have access to the internet, and to search for information that are
closely related to their daily lives, feeling, and thoughts. It is estimated that there are around 63, 000 Google
searches per second. The average person makes some three or four searches every day.2 Google Trends is a
website sponsored by Google that analyzes the popularity of top search queries in Google Search across
various regions and languages. Since more and more people are having access to the internet, and are more
reliable than ever to search for information that they care about. Thus, Google trends are revealing and
can provide an opportunity to examine people’s concerns as well as hot topics that they are interested
with. Researchers have used Google Trends data to investigate a number of researches such as: (1) disease
outbreak prediction. As far as we know, Carneiro and Mylonakis Carneiro and Mylonakis (2009) are the
first authors to introduce the more generic Google Trends tool to health professionals, to show how they
can track disease activity. Verma et al. Verma et al. (2018) illustrated there is a strong temporal correlation
between some diseases (chikungunya, dengue fever, and Haryana), and Google search trends. Zhang et
al. Zhang et al. (2018) used Google Trends and ambient temperature to predict seasonal influenza outbreaks,
and suggested internet search metrics in conjunction with temperature can be used to predict influenza
outbreaks. (2) economy and financial market prediction. Hong et al. Pai et al. (2018) used Internet Search
Trends and Historical Trading Data for Predicting Stock Markets, and showed that using hybrid data can
provide more accurate forecasting results than using single historical trading data. MY Huang et al. Huang
et al. (2019) found that the utilization of Google search data allows us to construct a model to forecast
directional movements in the S&P 500 index. Preis et al. Preis et al. (2013) suggested that Google Trends
data does not only reflect aspects of the current state of the economy, but may have also provided some

2   https://serpwatch.io/blog/how-many-google-searches-per-day/

This is a provisional file, not the final typeset article                                                      2

Pan et al.                                                           Google Trends Analysis of COVID-19

               United States
               Confirmed cases: 46,414

        1-9        10-99           100-999   1,000-9,999   10,000+

Figure 1. Coronavirus Confirmed Cases Worldwide Google (2020)

insight into future trends in the behavior of economic actors with other concepts in technical analysis. (3)
political election. A group of researchers at Wellesley College examined data from Google Trends data
successfully predicted the outcome in 33.3% of cases in 2008 and 39% in 2010. By analyzing data from
Google Trends, Mavragani and Tsagarakis (2016) calculated a valid approximation of the final result, thus
contributing to the discussion of using Google Trends as an elections’ results prediction tool in the future.

  In this paper, we explore the Google trends data to derive its relationships with the COVID-19 spreading
situations. Instead of focusing on model based prediction, we propose to use Google Trends data and
combine with the historical time series for future cases prediction. Our approach is pure data driven,
and skips the complicated mathematical modeling, which greatly reduces the algorithm complexity. We
did comprehensive experiments, and applied multiple popular prediction models, such as multiple linear
regression model, statistical model, and deep neural network on worldwide data to see the correlation
between search trends and infected cases. Our experiments demonstrated that there is a strong relationship
between infected patient cases and Google trends data, and can be used with other analysis techniques
for a better understanding of this mysterious disease spreading. The contributions of this paper can be
summaries as followings:

 • To the best of our knowledge, we are the first to use Google trends data to predict the number of
    confirmed coronavirus cases utilizing different model types: Linear model, Statistical model, and Deep
    learning model.
 • We present performance comparison across three models either using Google trends or not using
    Google trends feature. The results show that Google trends play an important role in the performance
    of the prediction models.

Frontiers                                                                                                  3
Pan et al. Google Trends Analysis of COVID-19 2 RELATED WORK There is a large number of studies about using Google Trends in forecasting algorithms. Here, we discuss two themes: The studies of Google Trends for disease control analysis and for other application domains. 2.1 Google Trends for disease control analysis Cook et al. (2011) assessed Google Flu Trends3 performance in the United States during the 2009 influenza virus A (H1N1) pandemic. The assessment showed that the internet search behavior changed during pH1N1. And the updated version of the Google Flue Trends technique performed better than the prior one Yang et al. (2015). Anggraeni and Aristiani (2016) used Google Trends data to build a forecasting model by applying the Autoregressive Integrated Moving Average with exogenous variable (ARIMAX) method, to predict the number of dengue fever cases in Indonesia. Xu et al. (2017) used Google search queries to build a statistical model to anticipate the number of influenza cases in Hong Kong. They compared different forecasting approaches: (Generalized Linear Model (GLM), Least absolute shrinkage and selection operator (LASSO), ARIMA, Feed Forward Neural Networks (FNN), and Bayesian model averaging (BMA). Authors recommended using FNN to predict the cases with better accuracy. Similarly, Ginsberg et al. (2009) used search engine queries to estimate weekly influenza activity in each region of the United States with a reporting lag of about one day compared with one to two weeks in traditional surveillance system. Silva et al. (2019) proposed a hybrid neural network approach named ”Denoised NNAR” combining Neural Network AutoRegression (NNAR) with the singular spectrum analysis. The analysis used Google Trends to reduce noise in fashion data. Shaghaghi et al. (2020) built a model using Long Short-Term Memory (LSTM) to anticipate the number influenza cases using the data of flu season from Centers for Disease Control and Prevention (CDC) and World Health Organization (WHO), and Google Trends to help the decision maker increasing or decreasing vaccines and medicines in advance. Kapitány-Fövény et al. (2019) stated that Google Trends were very correlated with the Lyme disease incidence report in Germany. 2.2 Google Trends for other application domains Bokelmann and Lessmann (2019) confirmed that there was an increment of work using Google Trends in tourism research. In this work, Google Trends was used as a predictor for short-term tourism demand. There were several traditional forecasting techniques which were utilized demonstrated that Google Trends played a significant role in short-term forecasting of tourism demand. Similar tourism related topics were discussed by Bangwayo-Skeete and Skeete (2015); Park et al. (2017); Önder (2017). Xu and Berkely (2014) showed that combining the time series analysis algorithms with Google Trends and Yahoo finance improved forecasting the the stock prices. Askitas and Zimmermann (2009) and Bulut (2018) stated that Google Trends were useful in predicting numerous economic variables (e.g., unemployment, exchange rates). Yu et al. (2019) worked in predicting Ford car sales in Argentina using GT. They used the keyword “Ford”, to improve their forecasting model. Even though there were some traps happened in the past of using Google Trends in Big Data analysis that discussed by Lazer et al. (2014) and Butler (2013), however, many improvements have been done by Google since then. Additionally, the studies of Google Trends analysis for disease control are still increasing through time. 3 https://www.google.org/flutrends This is a provisional file, not the final typeset article 4
Pan et al.                                                           Google Trends Analysis of COVID-19

3   METHOD
3.1 Building Feature for Regression Models
  We collect 13 different Google trends features based on the 13 search keywords. Some of these features
might be revealing, and others might contain strong noise which is not suitable for future prediction. We
differentiate those features into two classes base on the Pearson method Benesty et al. (2009). This approach
has shown its success in some similar work as done by Nguyen et al. (2019). The Pearson correlation
coefficient attempts to measure the similarity (correlation coefficient) between a series and the original one.
Given two series X and Y , it can be defined as:

                                                ∑Ti=1 (xi − x) ∗ (yi − y)
                             corr(X,Y ) = q                  q                ,                              (1)
                                            ∑Ti=1 (xi − x)2 ∗ ∑Ti=1 (yi − y)2

where x and y is the mean value of the time series X and Y respectively. The correlation coefficient values
which are greater than 0.7 are treated as highly correlated and used as features for the prediction model;
while the values which are below that threshold are considered as noise and being ignored. Table 1 presents

Table 1. Correlation between Google trends of search queries and confirmed cases worldwide.
                           Correlation p-value                            Correlation p-value
    cases of covid19             0.8633       7.23E-19     coronavirus update        0.7796       2.17E-13
    corona                       0.7789       2.34E-13     covid                     0.8650       5.14E-19
    coronavirus                  0.7408       1.32E-11     covid 19                  0.8627       8.12E-19
    coronavirus cases            0.8196       1.18E-15     covid 19 cases            0.8687       2.41E-19
    coronavirus covid19          0.8174       1.62E-15     covid19                   0.8506       7.91E-18
    coronavirus news             0.7750       3.65E-13     covid19 cases             0.8584       1.87E-18
    coronavirus symptoms         0.6664       6.18E-09

the correlation of Google trends using selected keywords with respect to the changes of new confirmed
coronavirus cases. We can see that most of the selected keywords are highly correlated. The only keyword
coronavirus symptoms show less correlation coefficient. Therefore, we decided to drop Google trends by
this keyword from the prediction models.
3.2 Regression Model
  We study typical regression models from traditional approaches like the linear model, and statistical
model such as negative binomial, to the most recent approach which is the deep neural network model.
3.2.1 Multiple Linear Regression Model
  The most straightforward prediction model is the multiple linear regression model. Multiple linear
regression attempts to model the relationship between two or more explanatory variables and a response
variable by fitting a linear equation to observed data. Essentially, it can be considered as an extension of
ordinary least-squares regression that involves more than one explanatory variable. Suppose there are p
distinct dependent variables, then the multiple linear regression model can be expressed as

                                   Y = β0 + β1 X1 + β2 X2 + ... + β p X p + ε                                (2)

, where for Xi is the ith variable, and βi measures the association between Xi and the response Y . Similarly
with the linear regression model, the parameters, β0 , β1 , ..., β p here are the optimal estimators to minimize

Frontiers                                                                                                     5
Pan et al. Google Trends Analysis of COVID-19
the sum of squared residuals, RSS. The multiple regression model is based on the following assumptions.
1) There is a linear relationship between the dependent variables and the independent variables. 2) The
independent variables are not too highly correlated with each other. 3) yi observations are selected
independently and randomly from the population. 4) Residuals should be normally distributed with a mean
of 0 and variance σ , which is estimated as
∑ni=1 ei 2
σ2 = (3)
n− p−i
, where ei = yi − ŷi is the residuals.
3.2.2 Non-negative Integer Regression Model
Negative binomial regression is similar to regular multiple regression except that the dependent, Y
variable is an observed count that follows the negative binomial distribution. Negative binomial regression
is a generalization of Poisson regression which loosens the restrictive assumption that the variance is equal
to the mean made by the Poisson model. The traditional negative binomial regression model is based on
the Poisson-gamma mixture distribution. This formulation is popular because it allows the modeling of
Poisson heterogeneity using a gamma distribution. Hilbe Hilbe (2011) introduces the negative binomial
distribution as:
p(y) = P (Y = y|u, α)
α −1 (4)
Γ y + α −1
y
α −1
µ
=
Γ (y + α −1 ) α −1 + µ α −1 + µ
, where µ is the mean incidence rate of Y per unit of exposure, and α is the heterogeneity parameter. The
traditional negative binomial regression model, designated the NB2 model in Hilbe (2011), is
ln µ = β0 + β1 x1 + β2 x2 + ... + β p x p (5)
, where the predictor variables x1 , x2 , ..., x p are given, and the population regression coefficients
β0 , β1 , β2 , ..., β p are to be estimated. Given a random sample of n subjects, for observed subject i, the
dependent variable is yi , and the predictor variables are x1i , x2i , ..., x pi . We denote xi = (x1i , x2i , ..., x pi ) and
β = (β0 , β1 , β2 , ..., β p )T , therefore, the Equ. 4 for an observation i can be re-written as:
α −1
Γ yi + α −1
yi
1 α µi (6)
P (Y = yi |ui , α) = .
Γ (yi + α −1 ) 1 + α µi 1 + α µi
The regression coefficients α and β can be estimated using the maximum likelihood function:
n
L(α, β ) = ∏ p(yi )
i=1
α −1 (7)
Γ yi + α −1
n
yi
1 α µi
=∏ −1
.
i=1 Γ (yi + α ) 1 + α µi 1 + α µi
3.2.3 Deep Neural Network Model
To predict the confirmed cases is extremely challenging since numerous known and unknown factors
affect this pandemic spreading, such as traffic, population density, and how much people concern. However,
accessing this information is not easy and may incur an additional cost. In this paper, we explore the most
This is a provisional file, not the final typeset article 6Pan et al. Google Trends Analysis of COVID-19 cutting-edge machine algorithms to predict the confirmed patients by Google trends data. Google trends data are able to indicate how much people concern about some specific topics, and provide an excellent opportunity to study the disease severity locally and globally. Figure 2. Deep neural network for confirmed cases prediction. Since the pandemic depends on the skill of social distancing to prevent the spread, so there is limited influence from the temporal factor. Therefore, instead of using a temporal model, we decided to use one dimensional convolutional neural network as the core component in our prediction model. Figure 2 presents the overall architecture of the deep neural network prediction model. In particular, there are three connected 1D convolutional layers, a flatten layer, a drop out layer, and a dense layer. The first convolutional layer has a filter size of 16, kernel size of 2, strides of 3, and a dilation rate of 1. The second and third convolutional layer steps one step at a time with the same filter size of 16, kernel size of 2, while their dilation rates are 2, and 4, respectively. These layers have different dilation rates in order to help the network capture more contextual information in the feature map. Lastly, we appended the dropout layer of 5% at the end before producing the output to avoid overfitting. 4 EXPERIMENTS AND RESULTS We start explaining the datasets. Next, we perform an analysis of Google search trends, related queries and the categories of the related topics with respect to new confirmed coronavirus cases. Finally, we show the results of forecasting the number of confirmed cases as there is a strong relationship between Googleś trends (GTs) and the confirmed cases, that help to improve the performance of traditional forecasting algorithms as well as our proposed deep neural network. 4.1 Datasets and Data Collection Procedure We crawl the Google Trend API to retrieve daily data from Jan 20, 2020 to March 23, 2020. The collection is done in both manner: a query for the data in a specific time range and a query for each day. Both of these types will produce trending of the search terms in a daily scale. However, the query with a time range will produce aggregated data for related queries and related topics. On the other hand, the daily query will generate daily information about different related queries and related topics. Hence, it helps to see the evolvement of such information through time and space. Regarding the selection of search terms to derive its trending, the most obvious terms about coronavirus are used: coronavirus, covid19, and covid19 cases. In order to enrich the feature sets, we collect the related queries to the defined terms and extract the top five Frontiers 7
Pan et al. Google Trends Analysis of COVID-19
coronavirus
covid 19 coronavirus covid19 covid 19
corona coronavirus news
cases of covid19
coronavirus coronavirus symptoms covid
cases covid19
coronavirus coronavirus
covid19 cases
update cases
coronavirus covid19 cases
coronavirus covid19 covid 19 cases
a) b) c)
Figure 3. Selection of trending search queries and its expansion. The thickness of a connection represents
the weight of the two terms.
80000
70000 2020-02-16
China 70513
60000
Korea, South 29
50000 Germany 16
US 13
40000 France 12
United Kingdom 9
30000
Italy 3
20000 Spain 2
Iran 0
10000
Switzerland 0
0
2020-01-22 2020-01-29 2020-02-05 2020-02-12 2020-02-19 2020-02-26 2020-03-04 2020-03-11 2020-03-18
Figure 4. Cumulative confirmed cases of top 10 countries worldwide.
high-weighted related queries (Google Trends uses its algorithm to rank the related queries). These queries
become the new search terms to pull its trending and other information from Google Trends. If the terms
have appeared in other queries, it will be ignored. At the end, our dataset composes of the trending, related
queries (top and rising related queries), related topics (top and rising related topics), and associated regions
from 12 trending search terms. Figure 3 demonstrates the three selected queries and its expansion to other
related queries. The connection represents the comparison weight between the two terms based on search
trend. For the forecasting algorithms, we randomly split the data with a ratio of 85% for training and 15%.
The deep neural network models use a dropout rate of 5% to avoid overfitting. The same strategy is applied
for country based prediction.
4.2 Overview of Worldwide Corronavirus Cases
Figure 4 presents the top 10 countries having the most number of cumulative confirmed cases worldwide.
The common trend of these countries is the exponential rise during the days of first confirmed cases. China
has the earliest confirmed cases and keeps being the top in the number of confirmed cases until March 22,
2020. Italy, United States, and France cases are subsequent. When the number of confirmed cases in China
is flattened by February 24, it was the start of the increment in Europe and the United States. The confirmed
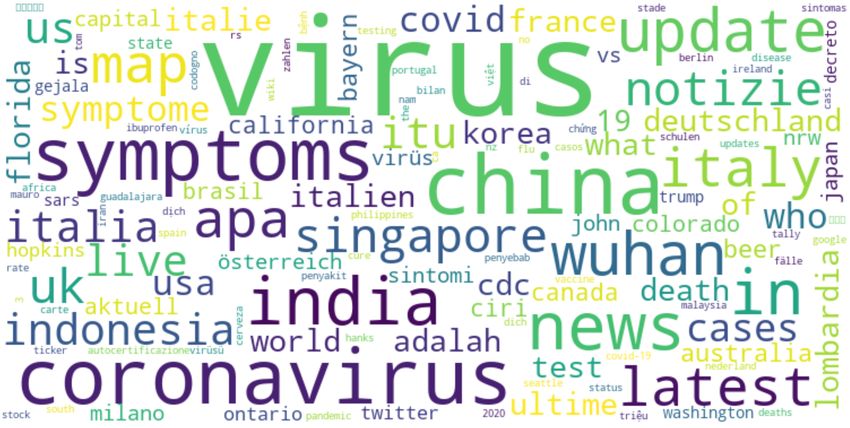
This is a provisional file, not the final typeset article 8Pan et al. Google Trends Analysis of COVID-19 cases have been dramatically spiked after 3/9. Aftermath, Italy hit the second in the world after China from that day on. Starting the second week of March, the U.S. boosted exponentially in just two weeks to be the third largest confirmed cases. Spain and Germany followed similar trajectories of the confirmed cases to rank the fourth and fifth, respectively. Iran was ranked the sixth even it started early than most of the countries. South Korea and Switzerland ranked the same, though the slow start in Switzerland. The least confirmed infected cases were in the UK as it was the last country of the top countries starting infected by COVID-19. During the period from the end of the fourth week of February until the third week of March, we can see that China has a different trajectory of confirmed cases than other counters. These countries began to record COVID-19 cases after China’s new cases slowed down. 4.3 Evolution of Internet Search Queries We studied the daily changes on the keywords as shown in Figure 5. We use blue bars if the change is greater than zero; otherwise, reds. The darker colors are for even days and lighter colors are for odd days, to clarify the figure. COVID-19 was not known as coronavirus for many people during the start of the coronavirus outbreak. There are no trends for COVID-19 before 1/24/2020. Though WHO announced on 2/11/2020 the official name for the 2019 novel coronavirus to be COVID-19 4 , the trends used this official name after 14 days. It means that several people were not aware of this term before officially announced by the international health organization. We can see that COVID-19 terms are less fluctuation than corona terms. The keyword ”cases of covid19” started in the fourth week of January with high interest in the first couple of hours and dropped down most of that day. From the next day (1/25) until the end of the month, there was a trend of increasing usage of this keyword. Similar behaviors were for the keywords ”coronavirus covid19” and ”Covid19 cases”. In general, the searched keywords in Google ”Covid 19”, ”covid 19 cases”, and ”covid19” were increased exponentially during the last week of January. Moreover, most of the keywords without ”covid19” (i.e., ”corona”, ”coronavirus”, ”coronavirus cases”, ”Coronavirus news”, ”Coronavirus update”) started on the twenty second of January and decreased in the next two days. After that, they increased most of the time until the end of the month. Whereas, the keyword ”covid” fluctuated on January twenty second until the mid of the next day. In general, it continued boosting until the end of this period. Figure 6 illustrates the word cloud of the related queries for all days in this study. It has several words in different sizes that represent the frequencies of the words. We can see that virus was the largest occurred word during this period. Also, the terms (”coronavirus”, ”china”, ”news”, ”update”, ”cases”) were also frequent. These terms are parts of the related queries as shown in Figure 5. 4.4 Evolution of Internet Search Related Queries Word co-occurrences for the three keywords are shown in Figures 7. The keywords in the queries are: coronavirus, covid19, and covid19 cases. Coronavirus was related most with ”cases”, ”uk”, ”symptoms”, ”news”, and ”update” as in Figure 7/a. People were concerned more with these terms for searching Google to understand and know more about coronavirus. The word co-occurrence for covid19 is shown in Figure 7/ b. It is clear that ”cases”, ”virus”, and ”coronavirus” were the most correlated with this keyword. Also, the term ”covid” was related to the number ”19”. Moreover, the keyword (covid19 cases) was more occurred in the terms of this composite keyword with its terms (covid19, cases) and the word ”of” as shown in Figure 7/ c. The integer ”19” was correlated with the term ”cases”. 4 https://www.cdc.gov/coronavirus/2019-ncov/faq.html Frontiers 9
Pan et al.                                                                           Google Trends Analysis of COVID-19

           Covid19             covid 19    Covid           coronavirus Coronavirus coronavirus coronavirus                      cases of
                                                   covid                                                   coronavirus
            cases    covid19    cases       19               update
                                                              p           news       covid19      cases                corona   covid19
   01/22
   01/23
   01/24
   01/25
   01/26
   01/27
   01/28
           -100
           0
           100
                     -100
                     0
                     100
                               -100
                               0
                               100
                                          -100
                                          0
                                          100
                                                   -100
                                                   0
                                                   100
                                                   -100
                                                   0
                                                   100
                                                                     -100
                                                                     0
                                                                     100
                                                                                 -100
                                                                                 0
                                                                                 100
                                                                                            -100
                                                                                            0
                                                                                            100
                                                                                                         -100
                                                                                                         0
                                                                                                         100
                                                                                                                     -100
                                                                                                                     0
                                                                                                                     100
                                                                                                                                -100
                                                                                                                                0
                                                                                                                                100

Figure 5. Daily interest change of each keyword.

4.5 Evolution of Internet Search Related Topics
  Figure 8 shows the top 20 categories of topics over time between the second day of January until the
twenty second of March. These entities (categories) are recognized (classified) by Google. In this paper,
we used the related categories related to coronavirus or COVID-19.

This is a provisional file, not the final typeset article                                                                                  10
Pan et al. Google Trends Analysis of COVID-19
Figure 6. Wordcloud visualization of overall terms in the related queries.
(a) coronavirus (b) covid19 (c) covid19 cases
Figure 7. Word co-occurrence for the three keywords: (a) coronavirus, (b) covid19, and (c) covid19 cases.
People searched for the most popular category ”Virus” on most days of this period. The second important
searched category was ”Infectious agent”, especially in the mid of February until the third week of March.
The interest of the category ”Country in North America” increased the concern in March since more
confirmed cases were discovered in the North American content.
The general category ”Topic” named by Google was frequent at the beginning of the third week in
February until the end of the period. The category ”Disease” occurred more at the end of February until the
end of the second week of March. Even though the Asia categories (”Country in East Asia” and ”Country
in Asia”) were trends after February 11, the East Asia category was also frequent from the fourth week in
January. Categories related to cities in China were frequent from the start of the period of this study, until
the mid of the ninth week of 2020 during the confirmed cases’ curve in the country started to be flattened.
Categories for places in California, Oceania, and Italy had fewer trends during most of the period of this
research, while the category ”US State” was the most frequent during the first week of March.
Frontiers 11Pan et al. Google Trends Analysis of COVID-19
Figure 8. A heatmap visualization for the categories of related topics. The darker color, the higher
mentioned frequencies.
An article in CBS News on the first of March5 focused on a survey found that 38% of American drinking
beers would not order Corona Beer. 16% of them thought that it might be a relation between drinking
Corona Beer and COVID-19. This impacted the Google trends about beer. We can see that this trend was
more frequent after 7 days of the article.
4.6 Confirmed Cases Prediction Performance
We use root mean square error (RMSE) as the main metric to compare the performance of the prediction
models. RMSE is a common metric to measure the differences between the actual value and the value
predicted by the forecasting model. Furthermore, other metrics like mean absolute error (MAE), mean
absolute percentage error (MAPE), and r-square (R2) are also reported to relatively understand other
aspects of the comparison. MAE is a metric related to the average expected value of the loss (i.e., the loss of
the absolute error). MAPE is a regression metric used to measure the quality of a forecasting model, where
the smaller is the better. In other words, it is the average accuracy ratio of the model. R2 is an indication of
how well the examples in a test dataset are
q possible to be predicted by a forecasting model. The formulas of
these evaluation metrics are: RMSE = 1 n 2
n ∑i=1 (yi − ŷi ) , MAE = n1 ∑ni=1 |yi − ŷi |, MAPE = 1n ∑ni=1 |yi|y−i |yˆi | ,
5 https://www.cbsnews.com/news/cornavirus-corona-beer-they-have-nothing-to-do-with-each-other/
This is a provisional file, not the final typeset article 12Pan et al. Google Trends Analysis of COVID-19
Actual
Confirmed cases
30000 Prediction DNN performance with Google Trends
20000
10000
0
0 10 20 30 40 50 60
30000 Actual
DNN performance without Google Trends
Confirmed cases
Prediction
20000
10000
0
0 10 20 30 40 50 60
Days
Figure 9. Actual versus prediction of confirmed cases using Deep Neural Network model. X axis represents
the number of days since January 20, 2020.Y axis represents number of confirmed cases.
n |y −yˆ |
R2 = 1 − ∑∑i=1 i i
n |y −ȳ| , where n is the size of the test dataset, yi is the actual number of confirmed cases, ŷi
i=1 i
is the predicted number of confirmed cases by a forecasting model based on the historical time series of
trends and confirmed cases, and ȳ represents the mean value ∀yi , i ∈ {1, . . . , n}.
Table 2. Confirmed cases forecast performance by learning algorithms.
RMSE MAE MAPE R2
Linear 1,685 847 0.39 0.76
Linear + GT 1,683 1,475 1.43 0.38
Negative Binomial 1,645 1,194 1.74 0.77
Negative Binomial + GT 1,494 1,373 1.11 0.51
Deep Neural Network 1,595 1,317 0.48 0.76
Deep Neural Network + GT 807 569 0.63 0.82
World-wide prediction performance: Table 2 presents the prediction performance of three types of
learning algorithms (namely Linear, Negative Binomial, and Deep Neural Network) using Google trends
and without using Google trends feature in the input (in this case, we use confirmed cases of previous day
as the feature for the prediction model). The table shows that the addition of Google trends feature for
Linear, Negative Binomial, and Deep Neural Network enhances themselves if not using Google trends
feature. The linear model has a small improvement with RMSE increased from 1, 685 to 1, 683. Negative
Binomial model presents better improvement of RMSE from 1, 645 to 1, 494. The Deep Neural Network
model shows the best improvement with RMSE from 1, 595 to 807, equivalent to 49% enhancement. In all
the variants, the Deep Neural Network model with Google trends outperforms other models.
Frontiers 13Pan et al. Google Trends Analysis of COVID-19
1,600
Google Trends
Without Google Trends
1,400
1,200
RMSE
1,000
800
600
400
France Italy United States Worldwide
Figure 10. Deep neural network performance comparison across several countries such as France, Italy,
United States, and Worldwide. We use one previous day as the feature when no google trends is used for
prediction.
Figure 9 demonstrates the visualization of new cases prediction compared with actual values using the
Deep Neural Network model. We can see that the Deep Neural Network model is able to predict the pattern
and show a smaller gap between the actual and the prediction lines compared with the version without
using Google trends feature. Throughout the three models, we can see that Deep Neural Network using
Google trends feature shows the best performance.
Country-based prediction performance: We selected countries with increasing number of new
confirmed coronavirus cases such as Italy, France, and United States to compare the model performance
when using google trends and without google trends data. China is not reported in this case because all the
queries do not correlate with the number of confirmed cases in China. It could due to the fact that users in
China use its own search system to search the Internet instead of Google. Additionally, for the model that
does not use google trends as features, we use confirmed cases of previous day to predict for the next day.
Figure 10 presents the performance of our proposed deep neural network model whether using or not using
Google Trends as features. From the Figure 10, we see that using Google Trends significantly enhances
the deep neural network model. The RMSEs of the model using Google Trends in France, Italy, United
States, and Worldwide are 643, 657, 520, and 807 while its performance when not using Google Trends are
1, 346, 1, 432, 1, 310, and 1, 546, respectively. We see that the model improves approximately two times in
France, Italy, and Worldwide and about two and half times in United States datasets. The enhancement
of the model performance across countries has confirmed that Google Trends can be a promising cheap
source of information to predict new confirmed coronavirus cases.
5 CONCLUSION
In this paper, we present a spatio-temporal view on the relationship between Google search trends and
the confirmed coronavirus cases. The framework supports visualization and analytic on the evolution
of search trends, search queries, and related queries globally. Additionally, we explore the capability of
Google search trends in predicting the number of confirmed cases for different types of learning models,
namely Linear, Negative Binomial, and Deep Neural Network. The results show that Google search trends
This is a provisional file, not the final typeset article 14Pan et al. Google Trends Analysis of COVID-19 enhance the performance of the three different forecasting models, where the non-linear learning model, Deep Neural Network, has the best performance. Employing the Google search trends features fosters the performance of the Deep Learning approach more than 49%. Thus, the potential data source is not only easy to access but also it is necessary to improve the performances of the employed forecasting models. REFERENCES Anggraeni, W. and Aristiani, L. (2016). Using google trend data in forecasting number of dengue fever cases with arimax method case study: Surabaya, indonesia. In 2016 International Conference on Information & Communication Technology and Systems (ICTS) (IEEE), 114–118 Askitas, N. and Zimmermann, K. F. (2009). Google econometrics and unemployment forecasting Bangwayo-Skeete, P. F. and Skeete, R. W. (2015). Can google data improve the forecasting performance of tourist arrivals? mixed-data sampling approach. Tourism Management 46, 454–464 Benesty, J., Chen, J., Huang, Y., and Cohen, I. (2009). Pearson correlation coefficient. In Noise reduction in speech processing (Springer). 37–40 Bokelmann, B. and Lessmann, S. (2019). Spurious patterns in google trends data-an analysis of the effects on tourism demand forecasting in germany. Tourism management 75, 1–12 Bulut, L. (2018). Google trends and the forecasting performance of exchange rate models. Journal of Forecasting 37, 303–315 Butler, D. (2013). When google got flu wrong: Us outbreak foxes a leading web-based method for tracking seasonal flu. Nature 494, 155–157 Carneiro, H. A. and Mylonakis, E. (2009). Google trends: a web-based tool for real-time surveillance of disease outbreaks. Clinical infectious diseases 49, 1557–1564 Cook, S., Conrad, C., Fowlkes, A. L., and Mohebbi, M. H. (2011). Assessing google flu trends performance in the united states during the 2009 influenza virus a (h1n1) pandemic. PloS one 6, e23610 COVID, I., Murray, C. J., et al. (2020). Forecasting covid-19 impact on hospital bed-days, icu-days, ventilator-days and deaths by us state in the next 4 months. medRxiv Ferguson, N., Laydon, D., Nedjati Gilani, G., Imai, N., Ainslie, K., Baguelin, M., et al. (2020). Report 9: Impact of non-pharmaceutical interventions (npis) to reduce covid19 mortality and healthcare demand Ginsberg, J., Mohebbi, M. H., Patel, R. S., Brammer, L., Smolinski, M. S., and Brilliant, L. (2009). Detecting influenza epidemics using search engine query data. Nature 457, 1012–1014 [Dataset] Google (2020). Confirmed cases of coronavirus disease (covid-19). https://google.org/ crisisresponse/covid19-map(accessedMarch23,2020 Hilbe, J. M. (2011). Negative binomial regression (Cambridge University Press) Huang, M. Y., Rojas, R. R., and Convery, P. D. (2019). Forecasting stock market movements using google trend searches. Empirical Economics , 1–19 James, G., Witten, D., Hastie, T., and Tibshirani, R. (2013). An introduction to statistical learning, vol. 112 (Springer) Kapitány-Fövény, M., Ferenci, T., Sulyok, Z., Kegele, J., Richter, H., Vályi-Nagy, I., et al. (2019). Can google trends data improve forecasting of lyme disease incidence? Zoonoses and public health 66, 101–107 Lazer, D., Kennedy, R., King, G., and Vespignani, A. (2014). The parable of google flu: traps in big data analysis. Science 343, 1203–1205 Mavragani, A. and Tsagarakis, K. P. (2016). Yes or no: Predicting the 2015 greferendum results using google trends. Technological Forecasting and Social Change 109, 1–5 Frontiers 15
Pan et al.                                                       Google Trends Analysis of COVID-19

Nguyen, L. H., Pan, Z., Openiyi, O., Abu-gellban, H., Moghadasi, M., and Jin, F. (2019). Self-boosted
  time-series forecasting with multi-task and multi-view learning. arXiv preprint arXiv:1909.08181
Önder, I. (2017). Forecasting tourism demand with google trends: Accuracy comparison of countries
  versus cities. International Journal of Tourism Research 19, 648–660
Pai, P.-F., Hong, L.-C., and Lin, K.-P. (2018). Using internet search trends and historical trading data
  for predicting stock markets by the least squares support vector regression model. Computational
  intelligence and neuroscience 2018
Park, S., Lee, J., and Song, W. (2017). Short-term forecasting of japanese tourist inflow to south korea
  using google trends data. Journal of Travel & Tourism Marketing 34, 357–368
Preis, T., Moat, H. S., and Stanley, H. E. (2013). Quantifying trading behavior in financial markets using
  google trends. Scientific reports 3, 1684
Shaghaghi, N., Calle, A., and Kouretas, G. (2020). Influenza forecasting. In Proceedings of the 3rd ACM
  SIGCAS Conference on Computing and Sustainable Societies. 339–341
Silva, E. S., Hassani, H., Madsen, D. Ø., and Gee, L. (2019). Googling fashion: forecasting fashion
  consumer behaviour using google trends. Social Sciences 8, 111
Verma, M., Kishore, K., Kumar, M., Sondh, A. R., Aggarwal, G., and Kathirvel, S. (2018). Google
  search trends predicting disease outbreaks: An analysis from india. Healthcare informatics research 24,
  300–308
Xu, Q., Gel, Y. R., Ramirez Ramirez, L. L., Nezafati, K., Zhang, Q., and Tsui, K.-L. (2017). Forecasting
  influenza in hong kong with google search queries and statistical model fusion. PloS one 12, e0176690
Xu, S. Y. and Berkely, C. (2014). Stock price forecasting using information from yahoo finance and google
  trend. UC Brekley
Yang, S., Santillana, M., and Kou, S. C. (2015). Accurate estimation of influenza epidemics using google
  search data via argo. Proceedings of the National Academy of Sciences 112, 14473–14478
Yu, L., Zhao, Y., Tang, L., and Yang, Z. (2019). Online big data-driven oil consumption forecasting with
  google trends. International Journal of Forecasting 35, 213–223
Zhang, Y., Bambrick, H., Mengersen, K., Tong, S., and Hu, W. (2018). Using google trends and ambient
  temperature to predict seasonal influenza outbreaks. Environment international 117, 284–291

This is a provisional file, not the final typeset article                                              16
You can also read