Forecasting of Lung Cancer Incident Cases at the Small-Area Level in Victoria, Australia - MDPI
←
→
Page content transcription
If your browser does not render page correctly, please read the page content below
International Journal of
               Environmental Research
               and Public Health

Article
Forecasting of Lung Cancer Incident Cases at the Small-Area
Level in Victoria, Australia
Win Wah 1, * , Rob G. Stirling 2,3 , Susannah Ahern 1 and Arul Earnest 1

                                          1   Department of Epidemiology and Preventive Medicine, School of Public Health and Preventive Medicine,
                                              Monash University, Melbourne 3004, Australia; Susannah.Ahern@monash.edu (S.A.);
                                              Arul.Earnest@monash.edu (A.E.)
                                          2   Department of Allergy, Immunology & Respiratory Medicine, Alfred Health, Melbourne 3004, Australia;
                                              r.stirling@alfred.org.au
                                          3   Department of Medicine, Monash University, Melbourne 3168, Australia
                                          *   Correspondence: Win.Wah@monash.edu

                                          Abstract: Predicting lung cancer cases at the small-area level is helpful to quantify the lung cancer
                                          burden for health planning purposes at the local geographic level. Using Victorian Cancer Registry
                                          (2001–2018) data, this study aims to forecast lung cancer counts at the local government area (LGA)
                                          level over the next ten years (2019–2028) in Victoria, Australia. We used the Age-Period-Cohort
                                          approach to estimate the annual age-specific incidence and utilised Bayesian spatio-temporal models
                                          that account for non-linear temporal trends and area-level risk factors. Compared to 2001, lung cancer
                                          incidence increased by 28.82% from 1353 to 1743 cases for men and 78.79% from 759 to 1357 cases
                                          for women in 2018. Lung cancer counts are expected to reach 2515 cases for men and 1909 cases for
                                          women in 2028, with a corresponding 44% and 41% increase. The majority of LGAs are projected to

                                   have an increasing trend for both men and women by 2028. Unexplained area-level spatial variation
                                          substantially reduced after adjusting for the elderly population in the model. Male and female lung
Citation: Wah, W.; Stirling, R.G.;
                                          cancer cases are projected to rise at the state level and in each LGA in the next ten years. Population
Ahern, S.; Earnest, A. Forecasting of
                                          growth and an ageing population largely contributed to this rise.
Lung Cancer Incident Cases at the
Small-Area Level in Victoria,
Australia. Int. J. Environ. Res. Public
                                          Keywords: lung cancer; forecast; Bayesian; spatio-temporal; age-period-cohort
Health 2021, 18, 5069. https://
doi.org/10.3390/ijerph18105069

Academic Editor: Jahar Bhowmik            1. Introduction
                                               Lung cancer has been the most commonly diagnosed cancers and is the leading cause
Received: 9 April 2021                    of cancer deaths worldwide [1]. Time delays between the date of cancer diagnosis, registry
Accepted: 6 May 2021
                                          notification, receipt of all relevant notifications to the cancer registry, and time required to
Published: 11 May 2021
                                          verify cases at the registry lead to a lag of up to one year in publishing incidence data in the
                                          routinely published reports [2]. Projecting lung cancer incidence trends is complex due to
Publisher’s Note: MDPI stays neutral
                                          changing risk factor profiles over the years and the long latency period between risk factor
with regard to jurisdictional claims in
                                          exposure and lung cancer development. Although lung cancer incidence is known to vary
published maps and institutional affil-
                                          geographically within Australia [3], robust and precise forecasts for small-area units within
iations.
                                          each state is lacking. Thus, statistical models providing predictions for lung cancer counts
                                          for different individual areas are useful to quantify the lung cancer burden fundamental to
                                          cancer-control planning, allocation of healthcare resources, and research.
                                               Despite the significant amount of research on the spatio-temporal evolution of disease
Copyright: © 2021 by the authors.         mapping risks using Bayesian spatio-temporal models, there is little published literature
Licensee MDPI, Basel, Switzerland.
                                          on applying those models to provide reliable projections of lung cancer counts at the
This article is an open access article
                                          small-area level. Bayesian spatio-temporal models borrow strengths from neighbouring
distributed under the terms and
                                          areas to improve estimates of areas with sparse counts or a small population [4]. Thus, this
conditions of the Creative Commons
                                          study aims to forecast lung cancer counts at the local government areas (LGA) level over
Attribution (CC BY) license (https://
                                          the next ten years (2019–2028) in Victoria, Australia. Victoria is the second most populous
creativecommons.org/licenses/by/
4.0/).
                                          state in Australia, with an estimated residential population of 6.6 million in 2020 [5].

Int. J. Environ. Res. Public Health 2021, 18, 5069. https://doi.org/10.3390/ijerph18105069                  https://www.mdpi.com/journal/ijerph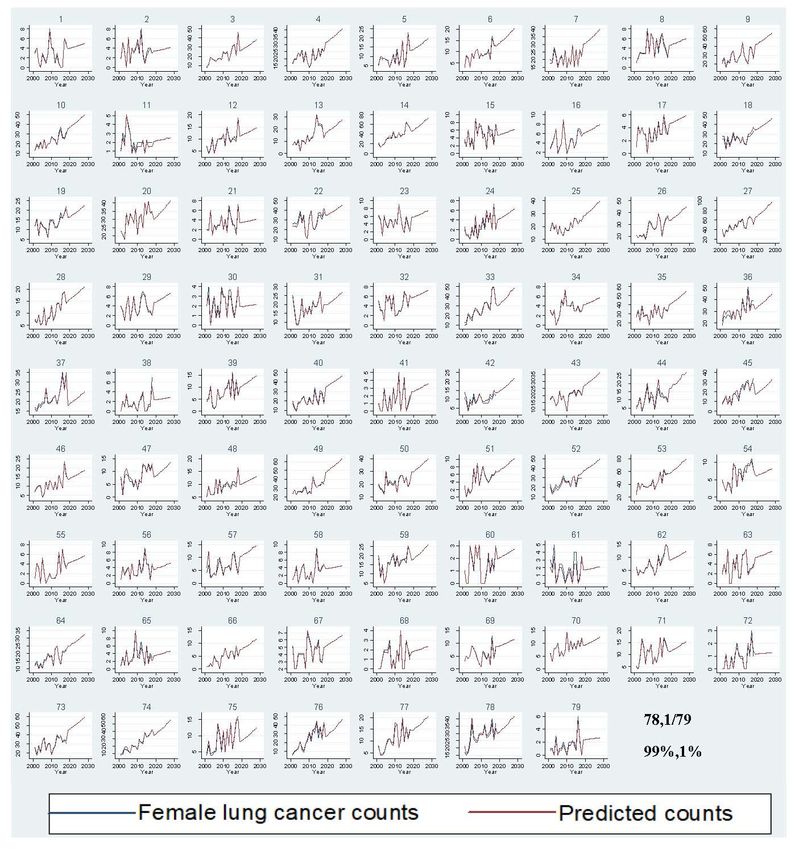
Int. J. Environ. Res. Public Health 2021, 18, 5069                                                                                2 of 13

                                        2. Methods
                                        2.1. Data
                                             This study included 46,297 incident lung cancer cases (lung, bronchus, trachea, ICD-
                                        10-C33-34) diagnosed among Victorian residents between 2001 and 2018 from the Victorian
                                        Cancer Council Registry (VCR) [2]. All diagnosed cancer cases, except skin cancer, are
                                        notifiable to the VCR by law. Patients were assigned to 79 LGAs based on their residential
                                        postcode at diagnosis.
                                             Annual male and female resident populations by different age groups at the LGA
                                        levels (2001–2019) were obtained from the Australia Bureau of Statistics (ABS) [6]. Projected
                                        population counts at the LGA level were extracted from the Department of Environment,
                                        Land and Water planning, which incorporates population growth using fertility, mortality,
                                        and migration rates [7].
                                             In our models, we included covariates such as the proportion of men and women
                                        currently smoking [8], proportion of the population who were elderly (≥65) [6], pollution
                                        categories [9], and socio-economic disadvantage status [10] reported at the LGA level. The
                                        index of relative socio-economic disadvantage (IRSD) was used as a surrogate indicator
                                        of area-level socio-economic status (SES) [10]. An area with a low IRSD score indicates a
                                        high proportion of relatively disadvantaged people in the LGA. Pollution category data
                                        (high, medium, low, no polluting facilities) were obtained from the National Pollutant
                                        Inventory [9]. We categorized the proportion of current male and female smokers, elderly
                                        population, and IRSD into quartiles and stratified remoteness into two remoteness areas:
                                        metropolitan/major cities versus regional/remote [11].

                                        2.2. Statistical Analysis
                                             All analyses were stratified by gender because lung cancer incidence is known to
                                        vary by gender [12]. Through direct internal standardization using the Victorian census
                                        population data, we calculated the age-standardized expected counts of the particular
                                        LGA in the observed years by multiplying with the age-standardized incidence rates of
                                        the specific LGA and year and the number of the population of the particular LGA and
                                        year [13]. The age-standardized incidence rates were derived by dividing the observed
                                        lung cancer counts by the population in each age category, LGA, and year and multiplying
                                        with the population’s proportion within the particular age category (population weights).
                                             The age-standardized expected counts for each LGA in the projected years were obtained
                                        by multiplying the projected population in each age category, LGA, and year with the esti-
                                        mated age-specific incidence of that year derived from Age–Period–Cohort (APC) modelling.
                                        An APC model that extrapolates the age, period, and cohort trends into the future has been
                                        shown empirically to perform well in predicting cancer incidence [14]. An APC model with a
                                        power link function was fitted, assuming the number of cases followed a Poisson random
                                        variable with the logarithm of the person-years at risk specified as an offset [14]. Figure 1
                                        presents the age-standardized incidence rates from the data and derived from the APC model,
                                        using direct standardisation with the Australian 2001 population [15,16].

                                                                              Yit ~ Poisson(µit )

                                                                    logµit = log eit + α + ϕi + νi + tt + tt 2
                                                 The Bayesian spatio-temporal model takes the age group distribution in each area and
                                        year into account through the derived expected counts in each area and year
                                        (eit ) [17–20]. In this model, the observed disease count in area i and year t (Yit ) is as-
                                        sumed to follow a Poisson distribution with relative disease risk (µit ). The log relative risk
                                        of lung cancer in each area and year (µit ) was modelled as a function of the intercept (α),
                                        spatially structured (ϕi ) and unstructured (νi ) random-effects, and linear (tt ) and quadratic
                                        (tt 2 ) temporal terms. The priors for the standard deviation of the precision estimates were
                                        set a uniform distribution (0.01 to 10). Those for the means were assigned to a normal
                                        distribution with a standard deviation covering a wide range of values. The intercept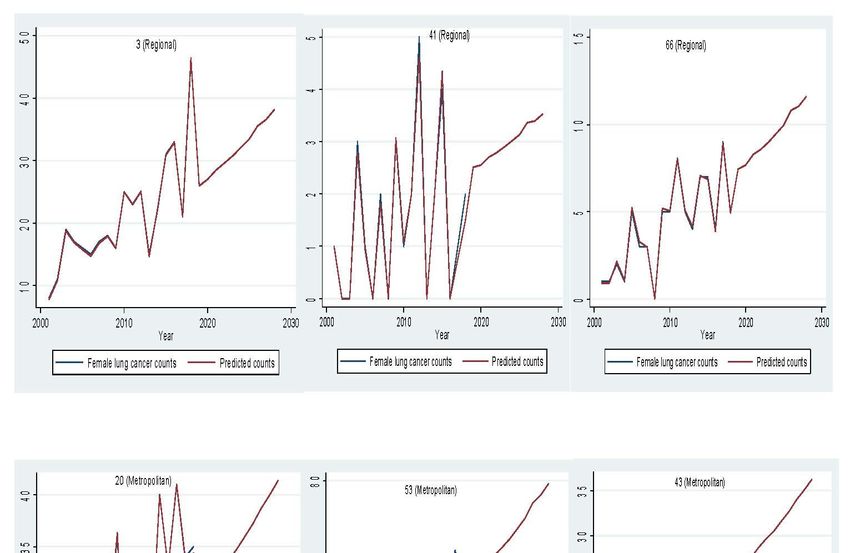
Int. J. Environ. Res. Public Health
                                Int.2021,  18, 5069
                                    J. Environ. Res. Public Health 2021, 18, x FOR PEER REVIEW                                                                                                                                                                                                           3 of 13 4 of 15

                                                                                                                               for male (77.97%) and female (78.99%) lung cancer counts between 2019 and 2028 (Figures
                                         term and the coefficients  for the time period indicator and unstructured spatial variation
                                                            3 and 4). A stable trend of each LGA was defined as less than a 5% increase from the
                                         were assigned vague   normal     priors. Structured
                                                            average of previous     years. Aroundspatial
                                                                                                    3% andvariation  was will
                                                                                                              1% of LGA    assumed
                                                                                                                               have ato  follow
                                                                                                                                       stable      anamong
                                                                                                                                               trend
                                         intrinsic CAR (conditional    autoregressive)
                                                            men and women                   prior
                                                                                in the next ten    thatFigures
                                                                                                years.   neighbours    were assigned
                                                                                                               5 and 6 display            based
                                                                                                                               the observed   and on
                                                                                                                                                   predicted
                                         geographically adjacent   boundaries
                                                            lung cancer   counts in[17].
                                                                                     LGAThis   CAR prior
                                                                                          by remoteness      allowsThese
                                                                                                           category.  smoothing
                                                                                                                           LGA wereof estimates    in
                                                                                                                                      selected to represent
                                         each LGA towards the
                                                            thedistribution
                                                                 mean risk of  inmetropolitan/regional
                                                                                   the neighbouring LGA   status.and
                                                                                                                  Theimproves
                                                                                                                      high proportion  of the where
                                                                                                                                 estimates    elderly popu‐
                                         the expected countslation at the[17].
                                                              are low      LGA level was significantly associated with an increased risk of lung cancer.
                                                                                                                               The unexplained area‐level spatial variation decreased from 92% to 19% among men and
                                                                                                                               from 82% to 19% among women after adjusting for the area‐level proportion of current
                                                                                                                                                   Yit ~Plots
                                                                                                                               smokers and the elderly.  Poisson(µ   it )
                                                                                                                                                              of standardized residuals versus predicted counts showed
                                                                                                                               no obvious outliers of LGA, based on the definition of standardized residuals of >2 or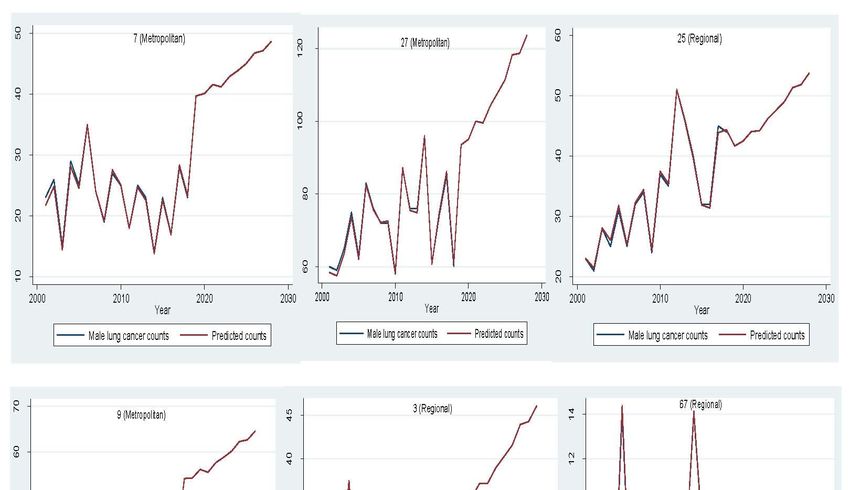
Int. J. Environ. Res. Public Health 2021, 18, 5069 4 of 13
To evaluate the forecasting models’ performance, we used the first 13 years of data
(2001–2013) as a training dataset to forecast for the remaining validation dataset (2014–2018).
We assessed the predictive performance of the selected model using prediction accuracy
measures such as root mean squared error (RMSE), mean absolute error (MAE), and mean
absolute percentage error (MAPE) within the training and validation datasets [26]. We
set the model with the highest prediction accuracy (lowest error measures) based on the
validation dataset for out-of-sample predictions.
3. Results
There were 27,555 male (59.52%) and 18,742 female (40.48%) cases recorded between
2001 and 2018. Rates of male and female lung cancer incidence were observed to increase
with age. Overall, lung cancer incidence trends showed a clear differential pattern between
men and women (Figure 1). In males, a fluctuating downward trend in age-standardized
rates from 62.1 in 2001 to 49.2 in 2018 was observed, contrasting with increasing rates in
women, from 28.5 in 2001 to 34.7 in 2018. Projected age-standardized incidence rates from
APC models showed a slightly decreasing trend in males and an increasing trend in females
after 2018. There were higher proportions of females than males in the older age groups
(≥65) (Figure 1). The spatio-temporal model with linear and quadratic temporal terms had
lower DIC and better model fit for male and female lung cancer incidence (Table 1). Thus,
this model was selected for further analyses comparing different models with covariates
using training and validation data (Table 2). The models without any covariates showed
better prediction accuracy than those with other covariates in the validation dataset. Hence,
this simple, parsimonious model was chosen for out-sample predictions of male and female
lung cancer counts.
Table 1. Comparison of goodness-of-fit of the Bayesian spatial-temporal models.
Male Lung Cancer Incidence DIC
Model A (Linear & quadratic temporal terms) 4532
Model B (Autoregressive temporal terms) 4610
Female lung cancer incidence DIC
Model A (Linear & quadratic temporal terms) 3940
Model B (Autoregressive temporal terms) 4061
DIC; Deviance information criterion, Lower DIC indicates better model fit (Bold).
In 2018, lung cancer incidence increased by 28.82% from 1353 to 1743 cases for men
and by 78.79% from 759 to 1357 cases for women compared to 2001 (Figure 2). Between 2019
and 2028, male lung cancer incidence is expected to reach 2515 cases, with a 44% increase,
and female lung cancer incidence is projected to rise to 1909 cases, with a 41% increase
(Supplementary Table S1). Out of 79 LGAs, most LGAs will have a rising trend for male
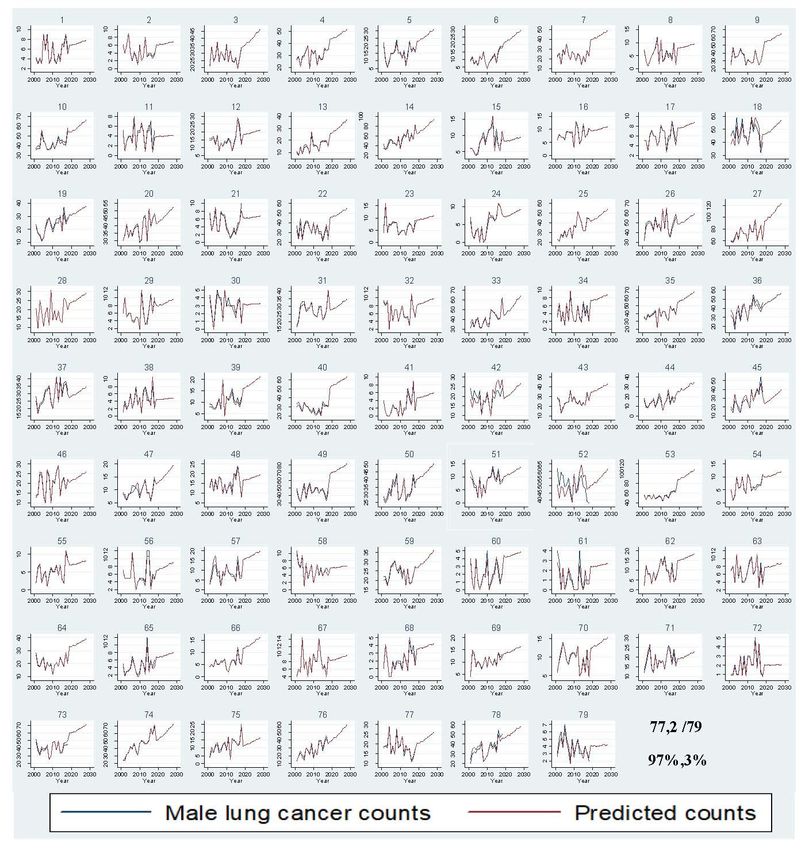
(77.97%) and female (78.99%) lung cancer counts between 2019 and 2028 (Figures 3 and 4).
A stable trend of each LGA was defined as less than a 5% increase from the average of
previous years. Around 3% and 1% of LGA will have a stable trend among men and
women in the next ten years. Figures 5 and 6 display the observed and predicted lung
cancer counts in LGA by remoteness category. These LGA were selected to represent the
distribution of metropolitan/regional status. The high proportion of the elderly population
at the LGA level was significantly associated with an increased risk of lung cancer. The
unexplained area-level spatial variation decreased from 92% to 19% among men and
from 82% to 19% among women after adjusting for the area-level proportion of current
smokers and the elderly. Plots of standardized residuals versus predicted counts showed
no obvious outliers of LGA, based on the definition of standardized residuals of >2 or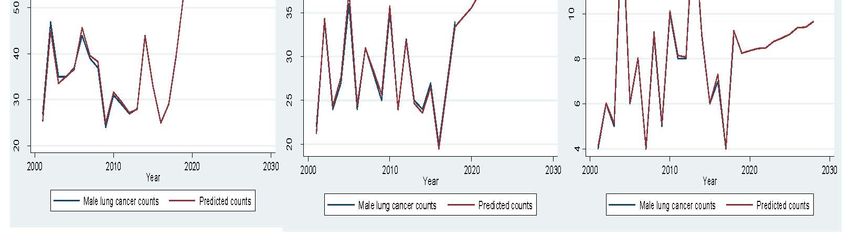
Int. J. Environ. Res. Public Health 2021, 18, x FOR PEER REVIEW 5 of 15
Table 1. Comparison of goodness‐of‐fit of the Bayesian spatial‐temporal models.
Int. J. Environ. Res. Public Health 2021, 18, 5069 Male Lung Cancer Incidence DIC 5 of 13
Model A (Linear & quadratic temporal terms) 4532
Model B (Autoregressive temporal terms) 4610
Female lung cancer incidence DIC
Table 2. Comparison of predictive accuracy
Model A (Linear of the Bayesian
& quadratic temporal spatio-temporal
terms) models. 3940
Model B (Autoregressive temporal terms) 4061
Male
DIC; Deviance information criterion,Lower DIC indicates Female
better model fit (Bold).
Training (2001–2013) RMSE MAE MAPE DIC RMSE MAE MAPE DIC
Table 2. Comparison of predictive accuracy of the Bayesian spatio‐temporal models.
Model A (Linear & quadratic temporal terms) 1.34 0.71 3.86 4532 0.89 0.44 4.12 3940
Male Female
Model A + Smoking 1.33 0.71 3.75 4478 0.90 0.45 4.20 3982
Training (2001–2013) RMSE MAE MAPE DIC RMSE MAE MAPE DIC
Model A + Smoking + RSD 1.34 0.71 3.79 4356 0.89 0.45 4.07 3995
Model A (Linear & quadratic temporal terms) 1.34 0.71 3.86 4532 0.89 0.44 4.12 3940
Model A + Smoking + Pollution 1.35 0.73 4.04 4498 0.91 0.46 4.48 3985
Model A + Smoking 1.33 0.71 3.75 4478 0.90 0.45 4.20 3982
Model A + Smoking + Elderly 1.38 0.74 3.85 4578 0.96 0.48 4.19 4031
Model A + Smoking + RSD 1.34 0.71 3.79 4356 0.89 0.45 4.07 3995
Model A + Smoking + Elderly + Pollution 1.39 0.75 3.89 4575 0.94 0.48 4.44 4029
Model A + Smoking + Pollution 1.35 0.73
4.04 4498 0.91 0.46 4.48 3985
Validation (2014–2018)
Model A + Smoking + RMSE
Elderly MAE 1.38MAPE
0.74 DIC 4578
3.85 RMSE0.96 MAE 0.48 MAPE 4.19 DIC
4031
Model A + Smoking + Elderly + Pollution 1.39 0.75 3.89 4575 0.94 0.48 4.44 4029
Model A (Linear & quadratic temporal terms) 8.75 5.87 39.57 4532 6.35 4.27 31.99 3940
Validation (2014–2018) RMSE MAE MAPE DIC RMSE MAE MAPE DIC
Model A + Smoking 8.80 5.91 40.26 4478 6.40 4.32 33.17 3982
Model A (Linear & quadratic temporal terms) 8.75 5.87 39.57
Model A + Smoking + RSD 8.81 5.89 40.06 4356 45326.40 6.35 4.344.27 31.99
33.04 3940 3995
Model A + Smoking 8.80 5.91 40.26 4478 6.40 4.32 33.17 3982
Model A + Smoking + Pollution 8.80 5.92 40.57 4498 6.41 4.36 33.83 3985
Model A + Smoking + RSD 8.81 5.89 40.06 4356 6.40 4.34 33.04 3995
Model A + Smoking + Elderly 8.80 5.93 41.61 4578 6.40 4.34 33.87 4031
Model A + Smoking + Pollution 8.80 5.92 40.57 4498 6.41 4.36 33.83 3985
Model A + Smoking + Elderly + Pollution 8.81 5.94 41.90 4575 6.43 4.37 33.84 4029
Model A + Smoking + Elderly 8.80 5.93 41.61 4578 6.40 4.34 33.87 4031
RMSE; Root mean squared error,
ModelMAE; Mean absolute
A + Smoking error,+ MAPE;
+ Elderly Mean absolute
Pollution 8.81 percentage
5.94 error, DIC;
41.90 Deviance
4575 information
6.43 4.37 criterion.
33.84 Lower 4029
values of these measures indicate betterRoot
RMSE; prediction accuracy
mean squared (Bold).
error, MAE; Mean absolute error, MAPE; Mean absolute percentage error, DIC; Deviance information
criterion. Lower values of these measures indicate better prediction accuracy (Bold).
2500
Training Validation Forecast
2000
1500
1000
2000 2010 2020 2030
Year
Int. J. Environ. Res. Public Health 2021, 18, x FOR PEER REVIEW 6 of 15
Male lung cancer counts Predicted counts
2000
Training Validation Forecast
1500
1000
500
2000 2010 2020 2030
Year
Female lung cancer counts Predicted counts
Figure Figure 2. Comparison
2. Comparison of observed and
of observed and predicted
predictedmale and female
male lung cancer
and female lungcounts percounts
cancer year. per year.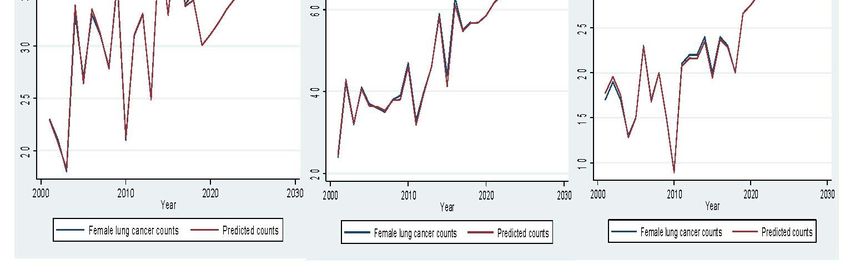
Int. J.J. Environ.
          Environ. Res.
                   Res. Public
                        Public Health
                               Health 2021, 18, x5069
                                      2021, 18,   FOR PEER REVIEW                                                       76 of 15
                                                                                                                              13

           Figure 3.
           Figure    Comparison of
                  3. Comparison of observed
                                   observed and
                                            and predicted
                                                predicted male
                                                          male lung
                                                               lung cancer
                                                                    cancer counts
                                                                           counts per
                                                                                  per year
                                                                                      year by
                                                                                           by Local
                                                                                              Local Government
                                                                                                    Government Areas.
                                                                                                               Areas.
Int. J. Environ.
Int. J. Environ. Res.
Res. Public
Public Health
Health 2021, 18, x5069
2021, 18, FOR PEER REVIEW 78 of
of 13
15
Figure 4. Comparison of observed and predicted female lung cancer counts per year by Local Government Areas.
Figure 4. Comparison of observed and predicted female lung cancer counts per year by Local Government Areas.Int. J. Environ. Res. Public
Int. J. Environ. Health
Res. Public 2021,
Health 18, 18,
2021, 5069x FOR PEER REVIEW 9 of 15 8 of 13
Int. J. Environ. Res. Public Health 2021, 18, x FOR PEER REVIEW 10 of 15
Figure 5. Comparison
Figure of observed
5. Comparison andand
of observed predicted male
predicted malelung
lungcancer
cancercounts
counts per
per year in selected
year in selectedLocal
LocalGovernment
Government Areas by
Areas
remoteness category.
by remoteness category.
Figure 6. Cont.Int. J. Environ. Res. Public Health 2021, 18, 5069 9 of 13
Figure 6. Comparison of observed and predicted female lung cancer counts per year in selected Local Government Areas
Figure 6. Comparison of observed and predicted female lung cancer counts per year in selected Local Government Areas
by by
remoteness category.
remoteness category.
4.4.Discussion
Discussion
This
This study
study provided predictionsofofmale
provided predictions maleand
andfemale
femalelunglung cancer
cancer cases
cases that
that would
would
continue
continue toto rise atthe
rise at thestate
statelevel
levelandand in each
in each LGALGA innext
in the the ten
nextyears.
ten years. Lunginci‐
Lung cancer cancer
incidence is projected
dence is projected to increase
to increase by by
44% 44%andand
41%41% among
among men menandand women
women in the
in the nextnext
tenten
years.The
years. Thehigher
higher proportion
proportion of of the
theelderly
elderlypopulation
populationatat the LGA
the LGA level was
level significantly
was significantly
associated with
associated with higher
higher lung
lung cancer
cancer risk.
risk.Including
Includinglinear
linearandand non‐linear
non-linear components
components in in
someLGA
some LGA andand lower
lower DIC
DIC values
values reflected
reflectedbetter
bettermodel
modelfitfitonon this
thisstudy data
study with
data withthethe
associatedspatio-temporal
associated spatio‐temporal model
model withwithlinear
linearand
andquadratic
quadratictemporal
temporal terms.
terms.
The predicted increase found in this study possibly reflects the
The predicted increase found in this study possibly reflects the demographic demographic changes
changes
that Victoria will experience in the next decade, notably population
that Victoria will experience in the next decade, notably population growth and growth and ageing.
ageing.
Thisstudy
This studyincluded
included age-standardized
age‐standardized expected
expectedcounts
countsand
and population
population projections
projections to take
to take
intoaccount
into accountchanges
changes in in the
the ageing
ageingand andpopulation
populationsize.
size.However,
However, thethe
age‐adjusted
age-adjusted ratesrates
do not show the demographic changes in the population. Predicting the future number of
incident cases rather than predicting age-standardized rates would be more beneficial to
quantify the impact of cancer burden for health planning purposes.
Selecting an appropriate projection method mainly relies on data availability and the
purpose of the forecasts. These methods range from the present state method assuming
the current rate remains unchanged into the future to more complex statistical models of
historical trends, including APC and generalized linear mixed model (GLMM) [28].
The APC model is the most commonly used projection method for lung cancer inci-
dence and remains appropriate for long-term projections [28]. Period effects can represent
screening, diagnostic, and treatment factors that led to lung cancer incidence variation
across all age groups. In contrast, the cohort effect can reflect smoking histories and tobacco
uptake and cessation rates influenced by societal and peer factors from generation to
generation. This study used two-step forecasting methods with the APC model to derive
age-adjusted expected counts first. It then included those projected expected counts in
the Bayesian spatio-temporal GLMM model to predict the validation and out-sample data
while incorporating possible area-level risk factors. We acknowledge the uncertainty in
measurement error due to the two-step process. Other methodological papers derived
expected counts differently by multiplying the projected population in each age group,
area, and year with the age-specific rates corresponding to the entire study region and
period of observed data [18].
Other forecasting studies on lung cancer incidence did not consider the spatial dimen-
sion. The trend of predicted male and female lung cancer counts and age-standardizedInt. J. Environ. Res. Public Health 2021, 18, 5069 10 of 13
rates at the annual level was in line with projected rates in other studies [16,29–33]. Con-
sistently, new cases are projected to increase among men despite a slight decrease (1%)
in age-standardized rates after 2018. Other studies also reported increasing counts and
age-standardized rates among females [16,29–33].
Given the established association between tobacco smoking and lung cancer risk,
projections of lung cancer incidence are also crucial for evaluating the existing tobacco
control program’s effectiveness. In the 1970s, after the initial publicity relating to smoking’s
effect in Australia, smoking among men declined, but it increased among women [34].
With the introduction of tobacco control policies in the late 1990s, smoking prevalence has
decreased in both sexes since 2001 (Supplementary Figure S2) [34]. In 2019, around 12.9%
of Australians aged 18 years≥ smoked daily or weekly compared to 22.2% in 2001 [34].
Different tobacco consumption histories could explain variation in lung cancer incidence
trends between men and women. Declines in smoking among men in the second half of
the 20th century have subsequently been reflected in the downward trend of lung cancer
incidence in men after 2001, with a time lag of around 20 years [34]. Much later uptake of
tobacco smoking in those earlier years among women could explain the rising proportion
of lung cancer cases between 2001 and 2018 and a projected increasing trend [34].
This study only adjusted for the area-level covariates due to the lack of individual-level
smoking, genetic, and environmental exposure data in the VCR data. The area-level elderly
population significantly reduced unexplained area-level spatial variation. However, those
areal covariates did not improve the models’ prediction accuracy as they may not fully
explain the variation, and these are areal measures compared to individual patient-level
data. Though lung cancer is primarily caused by tobacco smoking, studies have reported
a two-fold rise in the proportion of non-smokers with lung cancer in recent years [35].
Lung cancer in non-smokers is almost exclusively non-small cell lung cancer, with non-
smoking women at higher risk [35]. This shift in aetiology might support an increase in
lung cancer counts, particularly among females, over the years in this study, despite a
decline in smoking prevalence.
The growth of the elderly population has been consistently greater for women than
men and contributed to higher lung cancer incidence. In men, the increase in lung cancer
incidence could be mainly due to population growth and ageing. In women, estrogens and
other female hormones could have influenced the increased risk of non-smoking related
lung cancer independent of age and smoking status [35,36].
Population-based lung cancer screening has not been adopted in Australia due to in-
sufficient evidence on benefits [37]. Current Australian guidelines recommend lung cancer
screening in those 55–74 years of age who smoke at least 30 packs per year, current smokers,
or those who have quit smoking in the past 15 years [37]. However, this applicability in
Aboriginal Torres Straits Islander populations remains to be confirmed.
This population-based study evaluated the model performance using training and val-
idation data and the goodness-of-fit and prediction accuracy measures. We used Bayesian
models to account for different sources of uncertainty and different spatial and temporal
patterns. Bayesian spatio-temporal models borrow strength across space and time to do
spatio-temporal smoothing and reduce the effect of random measurement error [21].
Limitation of the models includes caution in extrapolating model predictions beyond
the range of data. Additionally, the models did not account for spatio-temporal interactions
to allow for area-specific varying disease risk trends. The models are only useful for
predicting aggregate level counts but not for individual-level inference, thus leading to
a potential risk of ecological bias. Our projections assume that the effects of age, period,
and cohort components will remain unchanged into the future. However, our assumption
is supported by similar annual patterns predicted for lung cancer in other countries or
Australia [16,29–33]. Impact on lung cancer screening and healthcare utilization due to the
COVID-19 pandemic may result in decreased numbers of lung cancer diagnosis during
2020–2021. Our models would then be overestimating lung cancer counts, which is a
limitation we acknowledge. These forecasts assume no sudden changes in health careInt. J. Environ. Res. Public Health 2021, 18, 5069 11 of 13
utilisation due to natural disaster or pandemics such as COVID-19. Thus, caution is
required with interpretations on projection estimates due to the potential impact of the
COVID-19 pandemic. Projections also need to consider time lag assessment of disease rates
(>10 years) between changes in risk factors or tobacco-control policies. Additionally, this
study did not attempt to model the future impact of tobacco control interventions.
Market research company Euromonitor predicts the decline in the prevalence of
smoking in Australia is set to continue [38]. Even if smoking rates continue to decline, the
effects of past smoking are expected to continue to impact lung cancer. The increase in
cancer cases in women and men reinforces the need to continue and strengthen the tobacco
control measures and expand efforts in early cancer detection provided by screening. These
predictions at the LGA level help inform the existing and future burden of cancer, the impact
of public health policies and strategies on cancer and decision-making for efficient resource
allocation of cancer detection, prevention, and treatment in Australia [39,40]. This study
identified LGAs with increasing incidence over time, which is useful for resource allocation
and policy implementation of lung cancer prevention and control. A geographically-
targeted approach could highlight areas needing additional services for managing lung
cancer more effectively, such as where to concentrate screening. The models can be applied
to spatio-temporal analyses of lung cancer incidence and different diseases in other regions.
These projections provide a platform to investigate possible variation in lung cancer
incidence for various policy interventions and plan the proper development of health
services such as diagnostic, therapeutic, and palliative procedures at the LGA level.
5. Conclusions
Lung cancer incidence among men and women is increasing in the next ten years.
The number of people with lung cancer in Victoria is likely to increase by 44% in males
and 41% in females from 2019 to 2028, driven mainly by population growth and ageing.
This study highlights higher lung cancer incidence among females despite a decline in
smoking rates and taking population ageing into account. These results have important
policy implications in terms of planning healthcare needs and public health spending. The
prediction estimates in this study also act as a benchmark to measure the impact of possible
lung cancer prevention initiatives.
Supplementary Materials: The following are available online at https://www.mdpi.com/article/10
.3390/ijerph18105069/s1, Supplementary Material-1 Description of Bayesian spatial-temporal model,
Table S1: Comparison of observed and predicted male and female lung cancer counts per year with
95% credible intervals, Figure S1: Plot of standardized residuals versus predicted male and female
lung cancer counts, Figure S2: Prevalence of regular smokers for all Australians and by gender
(1980–2019).
Author Contributions: Conceptualization, W.W.; methodology, W.W.; validation, W.W., R.G.S.,
S.A. and A.E.; formal analysis, W.W.; investigation, W.W.; data curation, W.W.; writing—original
draft preparation, W.W.; writing—review and editing, W.W., R.G.S., S.A. and A.E.; visualization,
W.W.; supervision, S.A. and A.E. All authors have read and agreed to the published version of
the manuscript.
Funding: Please add: This research received no external funding.
Institutional Review Board Statement: The study was conducted according to the guidelines of
the Declaration of Helsinki, and approved by the Institutional Review Board (Monash University
Human Research Ethics Committee, Project number 12654, 28/02/2018).
Informed Consent Statement: Patient consent was waived since this study involves a secondary analy-
sis of non-identifiable data and data are aggregated at the Postcode level for spatio-temporal modelling.
Data Availability Statement: Restrictions apply to the availability of these data. Data was obtained
from Victorian Cancer Registry and are available with the permission of Victorian Cancer Registry.
Acknowledgments: The authors would like to thank Cancer Council Victoria (Victorian Cancer
Registry) for registry data collection, management and retrieval.Int. J. Environ. Res. Public Health 2021, 18, 5069 12 of 13
Conflicts of Interest: The authors declare no conflict of interest
Abbreviation
ABS Australia Bureau of Statistics
APC Age–Period–Cohort model
CAR Conditional autoregressive
DIC Deviance Information Criteria
ICD International Classification of Diseases
IRSD Index of relative socio-economic disadvantage
LGA Local Government Areas
MAPE Mean absolute percentage error
MSE Mean squared error
RMSE Root mean squared error
SES Socio-economic status
VCR Victorian Cancer Registry
References
1. World Cancer Research Fund. Worldwide Cancer Data. Global Cancer Statistics for the Most Common Cancers. 2021. Available
online: https://www.wcrf.org/dietandcancer/cancer-trends/worldwide-cancer-data (accessed on 6 May 2021).
2. Cancer Council Victoria. Guide to the Identification of Cancers Reportable to the Victorian Cancer Registry. 2018. Available
online: https://registry.cancervic.org.au/downloads/Reportable-Cancers-Guide-for-Hospitals-July-2018.pdf (accessed on 6
May 2021).
3. Cheng, E.S.; Weber, M.; Feletto, E.; Smith, M.A.; Yu, X.Q. Cancer burden and control in Australia: Lessons learnt and challenges
remaining. Ann. Cancer Epidemiol. 2018, 2, 1–15. [CrossRef]
4. Lawson, A.B. Bayesian Disease Mapping: Hierarchical Modeling in Spatial Epidemiology; CRC Press: Boca Raton, FL, USA, 2018.
5. Australian Bureau of Statistics. National, State and Territory Population. 2021. Available online: https://www.abs.gov.au/
statistics/people/population/national-state-and-territory-population/latest-release (accessed on 6 May 2021).
6. Australian Bureau of Statistics. Regional Population. 2021. Available online: https://www.abs.gov.au/statistics/people/
population/regional-population/2018-19#data-download (accessed on 6 May 2021).
7. Victoria State Government Environment Land Water and Planning. Victoria in Future Victoria’s Future Population Projec-
tions. 2021. Available online: https://www.planning.vic.gov.au/land-use-and-population-research/victoria-in-future#:~{}:
text=Victoria%20in%20Future%202019&text=For%20Local%20Government%20Areas%20(LGA,reach%2011.2%20million%20
by%202056 (accessed on 6 May 2021).
8. Australian Health Policy Collaboration. Australia’s Health Tracker by Area. 2021. Available online: https://atlasesaustralia.com.
au/ahpc/aust-health-tracker-area.html (accessed on 6 May 2021).
9. ABC News. Australia’s Pollution Mapped by Postcode Reveals Nation’s Dirty Truth. 2018. Available online: https://www.abc.
net.au/news/2018-11-16/australian-pollution-mapped-by-postcodes/10478620 (accessed on 6 May 2021).
10. Australian Bureau of Statistics. Technical Paper: Socio-Economic Indexes for Areas (SEIFA). 2016. Available online:
http://www.ausstats.abs.gov.au/ausstats/subscriber.nsf/0/756EE3DBEFA869EFCA258259000BA746/$File/SEIFA%202016
%20Technical%20Paper.pdf (accessed on 6 May 2021).
11. Australian Bureau of Statistics. Australian Statistical Geography Standard (ASGS): Volume 5—Remoteness Structure. 2018. Avail-
able online: https://www.abs.gov.au/AUSSTATS/abs@.nsf/DetailsPage/1270.0.55.005July%202016?OpenDocument (accessed
on 6 May 2021).
12. Hellyer, J.A.; Patel, M.I. Sex disparities in lung cancer incidence: Validation of a long-observed trend. Transl. Lung Cancer Res.
2019, 8, 543–545. [CrossRef] [PubMed]
13. Armitage, P.; Berry, G.; Matthews, J.N.S. Statistical Methods in Medical Research; John Wiley & Sons: Hoboken, NJ, USA, 2008.
14. Rutherford, M.J.; Lambert, P.C.; Thompson, J.R. Age–period–cohort modeling. Stata J. 2010, 10, 606–627. [CrossRef]
15. Jensen, O.M. Cancer Registration: Principles and Methods; IARC: Lyon, France, 1991.
16. Australian Institute of Health and Welfare. Cancer Data in Australia. 2020. Available online: https://www.aihw.gov.au/
getmedia/43903b67-3130-4384-8648-39c69bb684b5/Cancer-data-in-Australia.pdf.aspx?inline=true (accessed on 6 May 2021).
17. Bernardinelli, L.; Clayton, D.; Pascutto, C.; Montomoli, C.; Ghislandi, M.; Songini, M. Bayesian analysis of space—Time variation
in disease risk. Stat. Med. 1995, 14, 2433–2443. [CrossRef] [PubMed]
18. Corpas-Burgos, F.; Martinez-Beneito, M.A. An Autoregressive Disease Mapping Model for Spatio-Temporal Forecasting. Mathe-
matics 2021, 9, 384. [CrossRef]
19. Beard, J.R.; Earnest, A.; Morgan, G.; Chan, H.; Summerhayes, R.; Dunn, T.M.; Tomaska, N.A.; Ryan, L. Socioeconomic disadvantage
and acute coronary events: A spatiotemporal analysis. Epidemiology 2008, 19, 485–492. [CrossRef] [PubMed]
20. Wah, W.; Ahern, S.; Evans, S.; Millar, J.; Evans, M.; Earnest, A. Geospatial and temporal variation of prostate cancer incidence.
Public Health 2021, 190, 7–15. [CrossRef] [PubMed]Int. J. Environ. Res. Public Health 2021, 18, 5069 13 of 13
21. Bailey, T. An Introduction to Spatial and Spatio-Temporal Modelling of Small Area Disease Rates; Spring Course Organizado Pelos Insti-
tuto de Ciências Biomédicas de Abel Salazar, Faculdade de Medicina e Instituto de Saúde Pública da Universidade do Porto: Exeter,
UK, 2008; Available online: http://www.dpi.inpe.br/Miguel/Curso_Trevor/Course_STModellingSmallAreasDiseaseRates_
Trevor_Bailey.pdf (accessed on 6 May 2021).
22. Goudie, R.J.; Turner, R.M.; De Angelis, D.; Thomas, A. MultiBUGS: A parallel implementation of the BUGS modelling framework
for faster Bayesian inference. arXiv 2017, arXiv:170403216.
23. Dasgupta, P.; Cramb, S.M.; Aitken, J.F.; Turrell, G.; Baade, P.D. Comparing multilevel and Bayesian spatial random effects survival
models to assess geographical inequalities in colorectal cancer survival: A case study. Int. J. Health Geogr. 2014, 13, 36. [CrossRef]
[PubMed]
24. Martínez-Bello, D.A.; López-Quílez, A.; Torres-Prieto, A. Bayesian dynamic modeling of time series of dengue disease case counts.
PLoS Negl. Trop. Dis. 2017, 11, e0005696. [CrossRef] [PubMed]
25. Best, N.; Richardson, S.; Thomson, A. A comparison of Bayesian spatial models for disease mapping. Stat. Methods Med. Res.
2005, 14, 35–59. [CrossRef] [PubMed]
26. Baum, C. FCSTATS: Stata Module to Compute Time Series Forecast Accuracy Statistics. 2018. Available online: https://
econpapers.repec.org/software/bocbocode/S458358.htm (accessed on 6 May 2021).
27. Regression with Stata Chapter 2—Regression Diagnostics. Available online: https://stats.idre.ucla.edu/stata/webbooks/reg/
chapter2/stata-webbooksregressionwith-statachapter-2-regression-diagnostics/ (accessed on 6 May 2021).
28. Yu, X.Q.; Luo, Q.; Hughes, S.; Wade, S.; Caruana, M.; Canfell, K.; O’Connell, D.L. Statistical projection methods for lung cancer
incidence and mortality: A systematic review. BMJ Open 2019, 9, e028497. [CrossRef] [PubMed]
29. Victorian Cancer Registry. Cancer in Victoria—Statistics and Trends 2019 Cancer Council Victoria. 2020. Available online:
https://www.cancervic.org.au/downloads/cec/cancer-in-vic/Cancer-in-Victoria-statistics-and-trends-2019.pdf (accessed on 6
May 2021).
30. Alonso, R.; Piñeros, M.; Laversanne, M.; Musetti, C.; Garau, M.; Barrios, E.; Bray, F. Lung cancer incidence trends in Uruguay
1990–2014: An age-period-cohort analysis. Cancer Epidemiol. 2018, 55, 17–22. [CrossRef] [PubMed]
31. Australian Institute of Health and Welfare. Cancer Incidence Projections: Australia, 2011 to 2020. Cancer Series no. 66. Cat. No.
CAN 62. Canberra: AIHW. 2012. Available online: https://www.aihw.gov.au/getmedia/a79de4a1-49f5-4c93-bc59-4d181430aa6
9/14096.pdf.aspx?inline=true (accessed on 6 May 2021).
32. Parkin, D.M.; Bray, F.; Ferlay, J.; Pisani, P. Global cancer statistics, 2002. CA Cancer J. Clin. 2005, 55, 74–108. [CrossRef] [PubMed]
33. Cameron, J.K.; Baade, P. Projections of the future burden of cancer in Australia using Bayesian age-period-cohort models. Cancer
Epidemiol. 2021, 72, 101935. [CrossRef] [PubMed]
34. Greenhalgh, E.M.; Bayly, M.; Scollo, M.M. 1.3 Prevalence of Smoking—Adults. In Greenhalgh, EM.; Bayly, M.; Scollo, MM
and Winstanley, MH [Editors]. Tobacco in Australia: Facts and issues Melbourne: Cancer Council Victoria. 2021. Available
online: https://www.tobaccoinaustralia.org.au/chapter-1-prevalence/1-3-prevalence-of-smoking-adults#:~{}:text=According%
20to%20the%20Australian%20Bureau,aged%2015%20years%20and%20over (accessed on 6 May 2021).
35. Dubin, S.; Griffin, D. Lung Cancer in Non-Smokers. Missouri Med. 2020, 117, 375–379. [PubMed]
36. Slatore, C.G.; Chien, J.W.; Au, D.H.; Satia, J.A.; White, E. Lung cancer and hormone replacement therapy: Association in the
vitamins and lifestyle study. J. Clin. Oncol. 2010, 28, 1540–1546. [CrossRef] [PubMed]
37. Cancer Council Australia. Clinical Practice Guidelines for the Prevention and Diagnosis of Lung Cancer. Summary of Recom-
mendations. 2021. Available online: https://wiki.cancer.org.au/australia/Guidelines:Lung_cancer/Prevention_and_diagnosis/
Summary_of_recommendations (accessed on 6 May 2021).
38. Freeman, B.; Hagan, K.; Winstanley, M. Tobacco in Australia: Facts and Issues Melbourne: Cancer Council Victoria. 2018. Avail-
able online: https://www.tobaccoinaustralia.org.au/chapter-10-tobacco-industry/10-19-the-future-of-the-tobacco-industry
(accessed on 6 May 2021).
39. Cowdery, S.P.; Sajjad, M.A.; Holloway-Kew, K.L.; Mohebbi, M.; Williams, L.J.; Kotowicz, M.A.; Livingston, P.M.; Khasraw, M.;
Hakkennes, S.; Dunning, T.L.; et al. Mapping cancer incidence across Western Victoria: The association with age, accessibility,
and socioeconomic status among men and women. BMC Cancer 2019, 19, 1–10. [CrossRef] [PubMed]
40. Cancer Institute NSW. Cancer in Sydney 2018 Data Projections. 2018. Available online: https://www.cancer.nsw.gov.au/
research-and-data/cancer-data-and-statistics/nsw-cancer-data-projections/cancer-in-sydney-2018-data-projections (accessed
on 6 May 2021).You can also read