YOLOv3-Litchi Detection Method of Densely Distributed Litchi in Large Vision Scenes
←
→
Page content transcription
If your browser does not render page correctly, please read the page content below
Hindawi
Mathematical Problems in Engineering
Volume 2021, Article ID 8883015, 11 pages
https://doi.org/10.1155/2021/8883015

Research Article
YOLOv3-Litchi Detection Method of Densely Distributed Litchi in
Large Vision Scenes

          Hongjun Wang,1 Lizhong Dong,1,2 Hao Zhou,1 Lufeng Luo ,3 Guichao Lin,4
          Jinlong Wu,1 and Yunchao Tang 4
          1
            Key Laboratory of Key Technology on Agricultural Machine and Equipment, Ministry of Education,
            South China Agricultural University, Guangzhou 510642, China
          2
            Guangzhou Jiankun Network Technology Development Co. Ltd., Guangzhou 510530, China
          3
            College of Mechanical and Electrical Engineering, Foshan University, Foshan 528000, China
          4
            College of Urban and Rural Construction, Zhongkai University of Agriculture and Engineering, Guangzhou 510006, China

          Correspondence should be addressed to Lufeng Luo; luolufeng@fosu.edu.cn and Yunchao Tang; ryan.twain@gmail.com

          Received 5 September 2020; Revised 20 December 2020; Accepted 21 January 2021; Published 4 February 2021

          Academic Editor: Akhil Garg

          Copyright © 2021 Hongjun Wang et al. This is an open access article distributed under the Creative Commons Attribution
          License, which permits unrestricted use, distribution, and reproduction in any medium, provided the original work is
          properly cited.

          Accurate and reliable fruit detection in the orchard environment is an important step for yield estimation and robotic harvesting.
          However, the existing detection methods often target large and relatively sparse fruits, but they cannot provide a good solution for
          small and densely distributed fruits. This paper proposes a YOLOv3-Litchi model based on YOLOv3 to detect densely distributed
          litchi fruits in large visual scenes. We adjusted the prediction scale and reduced the network layer to improve the detection ability
          of small and dense litchi fruits and ensure the detection speed. From flowering to 50 days after maturity, we collected a total of 266
          images, including 16,000 fruits, and then used them to construct the litchi dataset. Then, the k-means++ algorithm is used to
          cluster the bounding boxes in the labeled data to determine the priori box size suitable for litchi detection. We trained an improved
          YOLOv3-Litchi model, tested its litchi detection performance, and compared YOLOv3-Litchi with YOLOv2, YOLOv3, and Faster
          R-CNN on the actual detection effect of litchi and used the F1 value and the average detection time as the assessed value. The test
          results show that the F1 of YOLOv3-Litchi is higher than that of YOLOv2 algorithm 0.1, higher than that of YOLOv3 algorithm
          0.08, and higher than that of Faster R-CNN algorithm 0.05; the average detection time of YOLOv3-Litchi is 29.44 ms faster than
          that of YOLOv2 algorithm, 19.56 ms faster than that of YOLOv3 algorithm ms, and 607.06 ms faster than that of Faster R-CNN
          algorithm. And the detection speed of the improved model is faster. The proposed model remits optimal detection performance
          for small and dense fruits. The work presented here may provide a reference for further study on fruit-detection methods in
          natural environments.

1. Introduction                                                          them [1, 2]; fruit detection can also automatically count the
                                                                         number of fruits in the field [3–7]. Automated fruit counting
Litchi fruit has a high commercial value, but unfortunately,             helps the orchard manager to measure fruit drop, estimate
has a high tendency to drop from its mother plant to the                 the yield, and plan for the market accordingly [8]. Machine-
ground as it grows. The setting percentage of litchi is sig-             vision-based fruit detection technology is currently capable
nificantly affected by environmental factors; the number of                of detecting fruit growth information, providing early
litchi fruits varies greatly in various environments. Smart              warnings for disease and pest infestations, yield prediction,
agriculture necessitates accurately and efficiently collecting             harvest positioning, and other tasks. The use of robotics in
crop growth information. At present, there have been many                orchards is increasing, particularly in yield prediction, yield
studies on fruit detection. Robotic harvesting devices must              mapping, and automated harvesting [9]. At the same time,
detect fruits in the orchard and properly locate them to pick            machine vision, as the eyes of an intelligent robot, allows the
2                                                                                          Mathematical Problems in Engineering

robot to perceive the operating environment, improve the              fruits in complex outdoor environments. There have been
robot’s intelligence, and thereby improve its work efficiency           many studies on fruit detection based on deep learning in
and accuracy.                                                         recent years [32–34]. Sa et al. [35] proposed a multimodal
    Early approaches to methodical fruit detection involved           faster R-CNN which combines the RGB and NIR; compared
manually extracting the color, texture, contour, and other            with the previous bell pepper detection methods, the F1
characteristics of the fruits. Lin et al. [10] detected fruits by a   score of sweet pepper detection increased from 0.807 to
support vector machine classifier trained on color and                 0.838 and the speed was faster. Chen et al. [36] used deep
texture features. Xu et al. [11] determined the area of               learning to estimate the total number of fruits directly from
strawberry fruits in images by calculating the color infor-           an input picture; an FCN first segmented the fruit in the
mation of the HSV color space and then used the HOG                   input image and then a counting neural network revealed an
feature combined with an SVM classifier to detect straw-               intermediate estimate of the number of fruits. Tian et al. [37]
berries in the field. Lin et al. [12] proposed an algorithm for        replaced the Darknet53 of YOLOv3 with DenseNet to im-
detecting spherical or cylindrical fruit of plants based on           prove feature propagation during training; the YOLOv3-
color, depth, and shape information, to guide the automatic           dense model they trained detected apples at different growth
picking of harvesting robots. Lu and Sang [13] proposed a             stages more accurately and quickly than YOLO v3 or Faster
citrus recognition method based on color information and              RCNN. Koirala et al. [38] proposed the MangoYOLO net-
contour segments; this involves a segmentation technique              work for real-time detection of mangoes in orchards with
that combines color difference information and a normal-               high accuracy and in real time. Wang et al. [39] used the
ized RGB model and then fits an ellipse to identify citrus             Faster Region-based Convolutional Neural Network (R-
under outdoor natural light. The preliminary segmentation             CNN) model to identify fruits and vegetables. Gao et al. [40]
stage does not exclude the influence of lighting in this case.         proposed an apple detection method based on a fast regional
Fu et al. [14] proposed an image processing method to                 convolutional neural network for multiclass apple dense
segment and then separate linearly aggregated kiwi fruits. Li         fruit trees. Chen et al. [41] trained the robust semantic
et al. [15, 16] used a reliable algorithm based on red-green-         segmentation network for bananas and realized effective
blue-depth (RGB-D) images to detect fruits.                           image preprocessing.
    There are also many important studies on litchi detec-                Deep learning is also used in the study of small-scale
tion. He et al. [17] used AdaBoost to integrate multiple              compacted fruits. Liang et al. [42] proposed a method to
strong LDA classifiers to detect green litchi fruits in the            detect litchi fruits and fruiting body stems in a night en-
natural environment. This method has good classification               vironment. They detected litchi fruits in a natural envi-
and recognition capabilities, but the classification takes too         ronment at night based on YOLOv3 and then determined
long to meet real-time requirements. Xiong et al. [18]                the region of interest of the fruit stems according to the
proposed a method for identifying litchi at night and a               bounding box of the litchi fruits (RoI) and finally segmented
calculation method for picking points. By using an improved           the fruit stems one by one based on U-Net, but the detection
fuzzy clustering method (FCM), the analysis method is                 scheme in the complex orchard environment during the day
combined with a one-dimensional random signal histogram               has not yet been proposed. Santos et al. [43] used the latest
to remove the background of the night scene image, and                convolutional neural network to successfully detect, seg-
then, the Otsu algorithm is used to segment the fruit from            ment, and track grape clusters to determine the shape, color,
the stem. This method requires high image quality and is              size, and compactness of grape clusters, but this method is
more sensitive to noise. Wang et al. [19] used wavelet                not suitable for estimating the yield of grapes. In the actual
transform to normalize the image to reduce the influence of            field environment, the litchi fruits overlapped, blocked se-
light and then used the K-means clustering algorithm to               verely, and had different sparseness and different sizes.
separate litchi fruits from branches and leaves. In the case of       Therefore, the algorithm proposed in the above literature
poor light conditions and serious fruit occlusion, this               does not have a good solution for small and densely dis-
method has low recognition accuracy for mature tomato                 tributed litchi detection. These have become difficult points
fruits. Guo et al. [20] presented a detection method based on         for rapid and accurate identification of litchi fruits.
monocular machine vision to detect litchi fruits growing in               The main contributions of this paper are as follows: (1) it
overlapped conditions. This method takes a long time to               proposes a densely distributed litchi detection algorithm
recognize and is not conducive to the picking efficiency of             YOLOv3-Litchi in a large visual scene. It adjusts the
the robot. Fruit images taken in the natural environment              YOLOv3 prediction scale and reduces the network layer to
often have variable lighting and complex backgrounds.                 improve the detection ability of small and dense litchi and
Traditional algorithms can successfully identify litchi fruits,       ensure the detection speed. The final construction is a
and its optimization method can reduce the impact of en-              network model for tomato fruit recognition in a complex
vironmental changes on the detection results, but the ro-             environment in the wild. (2) The proposed YOLOv3-Litchi
bustness of traditional algorithms is limited.                        algorithm was successfully trained and tested on the litchi
    Deep learning has gained popularity across various                data set and compared with the actual detection effect of
engineering fields in recent years [21–30]. Deep learning has          YOLOv2, YOLOv3, and Faster R-CNN algorithm on litchi.
been applied in the field of agriculture for pest identification,       The result shows the F1 value of the YOLOv3-Litchi algo-
weed identification, and yield estimation [31]. Deep learning          rithm, and the average detection time is better than the
methods are generalized, robust, and suitable for detecting           above algorithm, and it takes up less computer resources. (3)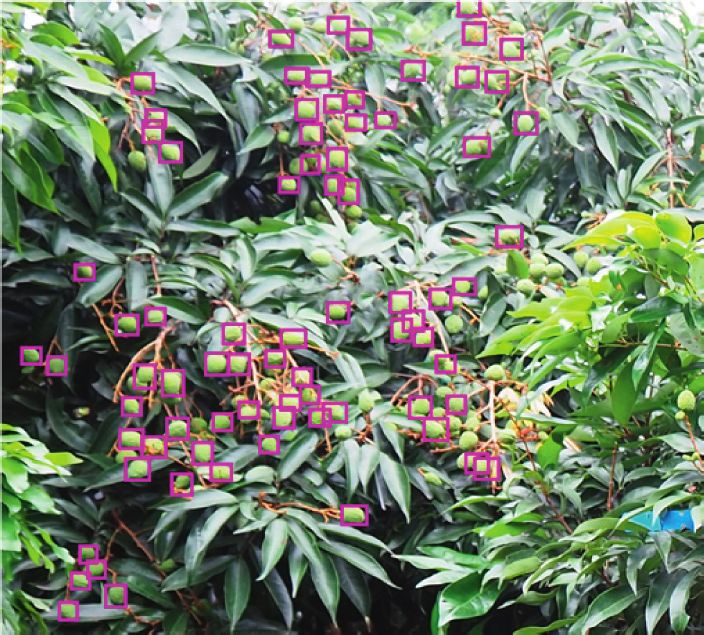
Mathematical Problems in Engineering                                                                                               3

YOLOv3-Litchi and YOLOv3 algorithms are used to detect
litchi at different growth stages and compare the detection
performance of the two at different growth stages. (4) In
order to prove the robustness of the proposed algorithm, the
YOLOv3-Litchi algorithm was used to detect litchi under
                                                                                1~2 m
strong light and weak light.

2. Materials and Methods
2.1. Data Preparation. As there is no public dataset for litchi
fruit detection, we need to build our own dataset for training                   Figure 1: Image collection diagram.
and testing for the task of litchi detection. In this paper, we
collected images of litchi fruit trees at different stages of                       Table 1: Dataset division details.
growth and constructed a litchi image dataset to support our
fruit-recognition algorithm. The orchard where the images          Dataset           Number of pictures            Number of fruits
were collected is located on the South China Agricultural          Train set               210                        11,390
University campus, Guangzhou, Guangdong, China, at                 Valid set                18                          882
                                                                   Test set                 38                         3,769
113°21′ east longitude and 23°9′ north latitude. The image
collection time was between 9 a.m. and 3 p.m. every Tuesday
between April 17 and June 14. The distance between the             pictures of any resolution size. As shown in Figure 3, if the
camera (OLYMPUS E-M10 Mark III and 4/3 Live MOS                    center of a target falls into a grid, then the grid is responsible
image sensor) and that between the camera and the edge of          for predicting this target.
the tree crown was 1-2 m during shooting, as shown in                  The network predicts 4 values for every bounding box on
Figure 1. The resolution of those collected images is              every grid, including the center coordinates (x, y) of the
4608 × 3072. In sunny weather, we adjusted the shooting            bounding box and the width w and height h of the target.
angle to capture forward light and backlight. In cloudy            YOLOv3 uses logistic regression to predict the confidence
weather, we took images under scattered light. The images          score of the target contained in the anchor box. The con-
collected included litchi fruit from 50 days after flowering to     fidence score reflects whether the grid contains objects and
maturity.                                                          the accuracy of the predicted location when the target is
     In this paper, we have used 266 images to build the litchi    included. The confidence is defined as follows:
image dataset. The fruits in these 266 images with a total of
16,000 targets were labeled in LabelImg software. Then, the          confidence � pr (object) × IOUtruth
                                                                                                   pred , pr (object) ∈ {0, 1}.
266 images were divided into a train set, valid set, and test                                                                    (1)
set. The division results are shown in Table 1. All the litchi
fruits in an image were labeled as one class.                          When the target is in the grid, pr (object) � 1, otherwise
                                                                   0. IOUtruth
                                                                           pred represents the consistency between the ground
                                                                   truth and the predicted box. If the confidence of the pre-
2.2. YOLOv3 Algorithm. YOLOv3 is evolved from YOLO                 dicted bounding box is greater than a preset IoU threshold,
and YOLOv2 [44–46]. YOLO series algorithms can directly            the bounding box is retained. If multiple bounding boxes
predict the bounding box and corresponding class proba-            detect the same target, the best bounding box is selected by
bility through a single neural network, making them faster         the NMS method.
than two-stage algorithms such as Faster RCNN [47]. The
network structure of YOLOv3 is shown in Figure 2. YOLOv3
uses Darknet53 as the feature extraction network and uses          2.3. Model Improvements. With the introduction of the FPN
the FPN structure to achieve the fusion of different scale          network, YOLOv3 takes good use of the high resolution of
features and multiple scale prediction. The use of multiple        low-level features and the semantic information of high-
scale prediction makes YOLOv3 detect small targets better.         level features, achieves the fusion of different levels via up-
Therefore, YOLOv3 is selected as the method to detect litchi       sampling and detects objects in three different prediction
fruit in this paper.                                               scales. The feature map with smaller prediction scale and
     In the YOLOv3 algorithm, the original images are first         larger receptive field is responsible for predicting bigger
resized to the input size, using a scale pyramid structure         targets, while the feature map with a larger prediction
similar to the FPN network [48] and then divided into S × S        scale and smaller receptive field is responsible for pre-
grids according to the scale of the feature map. Take the          dicting smaller targets. For the fact that the targets in the
input scale of 416 × 416 as an example, YOLOv3 will predict        litchi fruit dataset are generally small, adjusting the
on three scales of feature map of 13 × 13, 26 × 26, 52 × 52, and   prediction scale of the module can improve the effect of
use 2 times up-sampling to transfer features between 2             detection.
adjacent scales. In every prediction scale, every grid cell will       Shallow information can be better utilized by adding a
predict 3 bounding boxes with the help of 3 anchor boxes.          larger prediction scale. A larger feature map can then be
Therefore, the YOLOv3 network can be applied to the input          obtained to enhance the detection ability for smaller fruits
4                                                                                                   Mathematical Problems in Engineering

                                                                        DBL × 5

        Input        DBL     Res1   Res2    Res8      Res8    Res4                                            DBL    Conv        Output1
                                                                         DBL
                                                                                                                              13 × 13 × 255
     416 × 416 × 3
                                                                                                  DBL × 5
                                                                DBL    Upsample
                                                                                        Concat     DBL        DBL Conv          Output2
                                                                                                                              26 × 26 × 255

                                                                                                  DBL × 5
                                                                DBL    Upsample
                                                                                        Concat                DBL    Conv       Output3
                                     Leaky                                                         DBL
         DBL          Conv     BN
                                     ReLU
                                                                                                                              52 × 52 × 255

                       Zero                   Res_             Res_               DBL     DBL      Shortcut
         Resn         padding DBL              unit            unit
                                           Res_unit × n

                                                     Figure 2: YOLOv3 network structure.

                                                                         analysis based on the Euclidean distance. This clustering
                                                                         makes a larger box produce more errors than a smaller box.
                                                                         Our goal, in this case, is to obtain a larger IOU value between
                                                                         the anchor boxes and labeled boxes through clustering, so we
                                                                         used the following distance measure:
                                                                                           d(box,centroid) � 1 − IOU(box,centroid) .          (2)

                                                                             The initial seed point of the k-means algorithm is ran-
                                                                         domly determined, which creates an unstable clustering
                                                                         result that is not globally optimal. We used the k-means ++
                                                                         algorithm to solve this problem [49]. The k-means ++ al-
                                                                         gorithm is used to select initial seed points by maximizing
                                                                         the distance between the initial clustering centers.
                                                                             The size of the anchor boxes clustered using the k-means
                                                                         algorithm and k-means ++ algorithm in this study is shown
      Figure 3: Bounding box prediction on 13 × 13 grids.                in Figure 5. The k-means ++ algorithm produced more
                                                                         diverse and stable results than the k-means algorithm. We
                                                                         ultimately determined nine anchor boxes in the
like litchis. The target litchi fruit is very small within the large
                                                                         model training process with the k-means ++ clustering
scene, so smaller-scale feature outputs can be omitted.
                                                                         algorithm.
    In this study, we improved on the YOLOv3 model
(Figure 4) to create a novel network structure. A new
104 × 104 scale feature map was output after upsampling the              3. Experiment and Discussion
52 × 52 feature map and merging it with a shallow 104 × 104
feature map. The 13 × 13 scale feature output and four re-               The Darknet53 framework was used in this study to modify
sidual units at the tail of the original Darknet53 were re-              and train the proposed objection detection model. The
moved to form the proposed model, YOLOv3-Litchi.                         models were trained on a computer running a 64-bit Ubuntu
                                                                         16.04 system with Intel Core i7-7700K, 16 GB RAM, and
                                                                         NVIDIA GTX 1080Ti GPU.
2.4. Prior Box Clustering. Anchor mechanism is used in                       Larger input sizes tend to produce better detection
YOLOv3 to solve regression of the bounding box. YOLOv3                   results in neural networks, but also means longer detection
algorithm allocates 3 anchor boxes for every grid in every               times. Multiscale training strategies can effectively improve
prediction scale, for 3 scales and a total of 9 anchor boxes.            the accuracy and robustness of the model. In this study, we
Although the network can adjust the size of the box, setting             trained a model with an input size of 416 × 416 through
priori boxes helps the network learn features better. It is              multiscale training [50]. We set the batch size to 64, the
proposed that the k-means clustering method can be used to               initial learning rate to 0.001, and the learning rate to 0.1
determine the size of prior boxes in YOLO. We clustered the              times the original after 15,000 steps and 20,000 steps. For
labeled data to determine the size of the anchor boxes for               the model with an input size of 416 × 416, we set nine
litchi detection. The k-means clustering algorithm first                  anchor box sizes as follows: (3 × 5), (4 × 7), (6 × 9), (7 × 11),
randomly generates seed points and then performs cluster                 (9 × 13), (11 × 17), (14 × 22), (22 × 33), and (37 × 54). We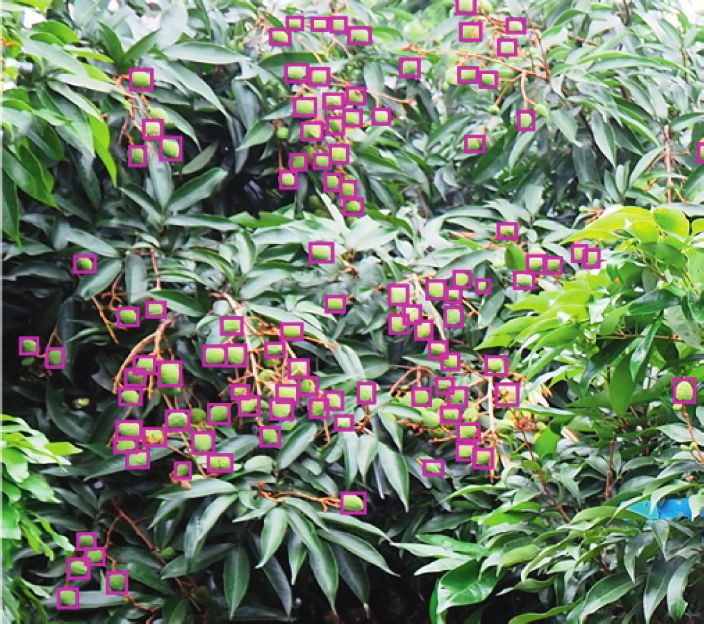
Mathematical Problems in Engineering 5
DBL × 5
Input DBL Res1 Res2 Res8 Res8 DBL DBL Conv Output2
26 × 26 × 18
416 × 416 × 3
DBL × 5
DBL Upsample
Concat DBL DBL Conv Output1
52 × 52 × 18
DBL × 5
DBL Upsample
Concat DBL DBL Conv
Leaky Output3
DBL Conv BN
ReLU
104 × 104 × 18
Zero Res_ DBL DBL
Resn DBL Res_ unit Shortcut
padding unit
Res_unit × n
Figure 4: Proposed network structure.
60 true-positive samples (TP), false-positive samples (FP), and
false-negative samples (FN). Precision is defined as
50 TP
precision � . (4)
TP + FP
40
The recall is defined as
Height
30 TP
recall � . (5)
TP + FN
20
F1 score is defined as
10 2 × precision × recall
F1 � . (6)
precision + recall
0
0 10 20 30 40 50 60
The precision is the proportion of all samples that are
Width predicted to be a certain category. The mAP is an indicator
that reflects global performance. AP is the average precision
k-means++ rate, and mAP is the average value of the APs of all classes.
k-means
The recall is the proportion of all samples whose true label is
Figure 5: Results of two clustering methods. a certain category. F1 score is a comprehensive index, which
is the harmonic average of precision and recall.
We plotted the models’ precision-recall (P-R) curves,
trained the YOLOv3-Litchi model and the original where recall is the horizontal axis and precision is the
YOLOv3 model to assess their performance by comparison vertical axis, to compare their performance of the models.
between them. The P-R curve intuitively reflects the precision and recall of a
model on an overall sample. If a curve protrudes more to the
upper right, then its corresponding model is more effective.
3.1. Related Evaluation Indicators. Intersection-over-union
(IoU) is an important parameter when verifying object
detection results. It represents the ratio of the intersection 3.2. Comparison of Results. To validate the performance of
and union between the “predicted bound” and “ground the proposed YOLOv3-Litchi model, other state-of-the-art
truth bound,” as shown in equation (3). If the IoU of the detection methods were evaluated for compar-
detection result exceeds a given threshold, the result is ison—YOLOv2, YOLOv3, and Faster R-CNN. Faster R-CNN
correct; otherwise, it is incorrect. is a detection method based on a region generation network.
area(P) ∩ area(G) This method first generates a series of sample candidate
IoU � . (3) frames by an algorithm and then classifies samples through a
area(P) ∪ area(G)
convolutional neural network. YOLOv2 and YOLOv3 are
Common evaluation indicators for object detection in- regression-based detection methods. The method does not
clude precision, recall, F1 score, and mean average precision need to generate candidate frames, directly converts the
(mAP). The results were predicted by the model include problem of target frame positioning into regression problem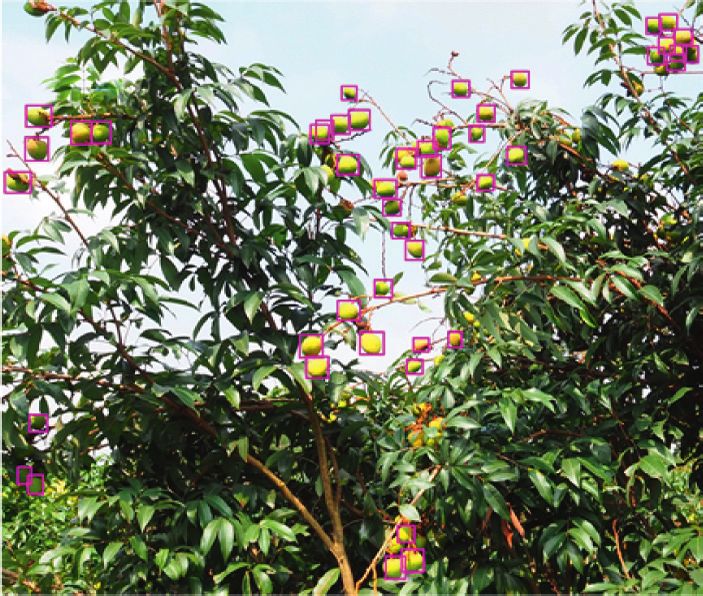
6                                                                                                    Mathematical Problems in Engineering

processing, and predicts target classification while achieving                                Table 2: Test results of 4 models.
target positioning. The test set contains a total of 38 images    Model name    Precision (%) Recall (%) F1 score mAP (%)
each 4608 × 3072 pixels in size. We set the detection confi-
                                                                  YOLOv2            80.54       63.92      0.71    60.73
dence threshold to 0.25 and the IoU threshold to 0.5. The         YOLOv3            81.72       65.96      0.73    62.34
model receives images of 416 × 416 pixels as inputs. The re-      Faster R-CNN      84.10       68.75      0.76    65.24
sults are given in Table 2.                                       YOLOv3-Litchi     87.43       74.93      0.81    77.46
    As shown in Table 2, under the same output size, the
detection performance of the proposed model is significantly
better than other models. Compared with YOLOv2,                                 1.00
YOLOv3-Litchi’s model accuracy has increased by 0.07, the
recall rate has increased by 0.11, the F1 score has increased                   0.95
by 0.1, and the mAP has increased by 0.17; compared with
YOLOv3, the model’s accuracy has increased by 0.06, the                         0.90
recall rate has increased by 0.09, the F1 score increased by                    0.85
0.08, and the mAP increased by 0.15; compared with Faster

                                                                    Precision
R-CNN, the accuracy of the model increased by 0.03, the                         0.80
recall rate increased by 0.06, the F1 score increased by 0.05,
and the mAP increased by 0.12.                                                  0.75
    The P-R curves of each model are shown in Figure 6.                         0.70
When the input dimensions are the same, the P-R curve of
the proposed model is more convex to the upper right,                           0.65
indicating better performance.
    Figure 7 shows the detection results of the YOLOv3-                         0.60
                                                                                       0.0   0.1   0.2   0.3   0.4    0.5 0.6   0.7   0.8   0.9   1.0
Litchi model. Because the target is small, it is difficult to
                                                                                                                     Recall
observe. To effectively compare the detection results of the
two models we tested, we isolated a portion of the detection                                  YOLOv2                       Faster R-CNN
result image as shown in Figure 8.                                                            YOLOv3                       YOLOv3-Litchi
    As shown in Figure 8, we compared the detection results                                          Figure 6: P-R curve.
in the case of small, densely distributed fruits–some of which
were not detected by any model. Under the same input size,
the proposed model did appear to detect litchis most ac-              The results show that YOLOv3-Litchi can also suc-
curately. When the input size of the model is larger, even        cessfully detect litchi at different growth stages, and the
more litchis could be detected.                                   detection performance at each growth stage is better than
                                                                  YOLOv3; the proposed algorithm shows the worst detection
                                                                  performance on young litchi, followed by expanding litchi. It
3.2.1. Comparison of Detection Time. The average detection        performs best on ripe litchi.
time of the four cases was also tested for comparison against
the two models (Figure 9).
    The test results show that the average detection time of      3.2.3. Detection under Different Illumination Conditions.
YOLOv3-Litchi is 29.44 ms faster than that of YOLOv2              In the natural environment, dynamic weather changes and
algorithm, 19.56 ms faster than that of YOLOv3 algorithm,         the sun’s movement across the field create continuous
and 607.06 ms faster than that of Faster R-CNN algorithm.         changes in the illumination on the litchi tree. The brightness
The proposed YOLOv3-Litchi model has the fastest detec-           of the fruit image changes with these changes in illumina-
tion speed, which indicates that the model can perform litchi     tion, which affects the fruit-detection algorithm.
detection in real time, which is important for harvesting             Figure 13 shows where the YOLOv3-Litchi model de-
robots.                                                           tects litchis under both strong and weak light illumination
                                                                  conditions.

3.2.2. Detection of Litchis at Different Growth Stages. The
size and density of litchis differ in different stages of growth.   3.2.4. Model Size. The size of the model files is shown in
We collected 12 images of young litchis, 12 images of             Table 4. As the proposed model has fewer network layers and
expanding litchis, and 9 images of ripe litchis from the test     fewer parameters, it consumes less memory than the original
set to compare the detection results of the proposed and          model. The file size of the improved model is 76.9 MB, which
original model among them. Table 3 shows the detection            is about 1/3 that of the original YOLOv3 model. However,
effects of the models with input size of 416 × 416.                Faster R-CNN is a two-stage target detection algorithm. It
    The detection results for young litchis, expanding litchis,   first generates a series of candidate frames as samples by the
and ripe litchis between the proposed and original models         algorithm and then classifies the samples through the
are shown in Figures 10–12. The upper left corner of each         convolutional neural network, which occupies more
figure is an enlarged view of the clustered litchi parts.          memory than other algorithms.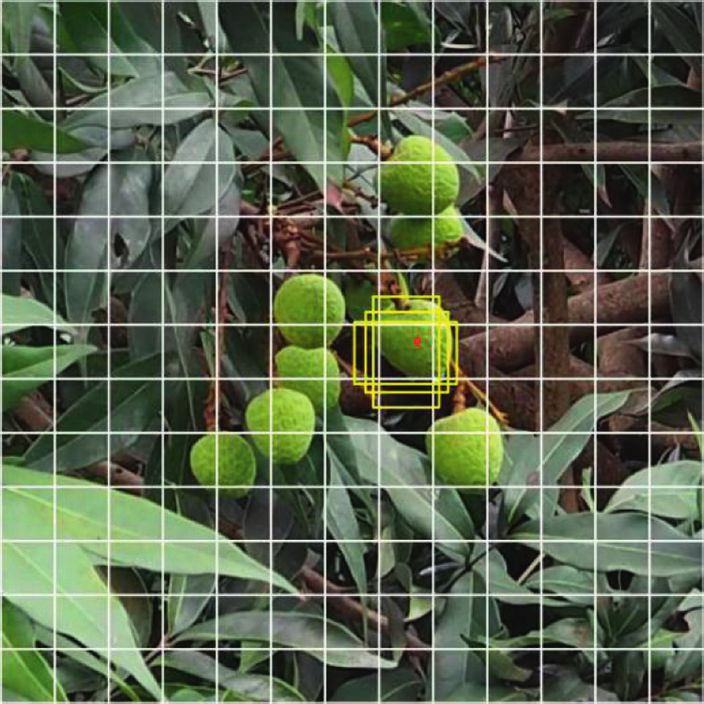
Mathematical Problems in Engineering                                                                                             7

                                              Figure 7: Prediction results on one image.

                                        (a)                                                (b)

                                        (c)                                                (d)

Figure 8: Comparison of local detection results. (a) YOLOv2 and (b) YOLOv3 results; (c) Faster R-CNN and (d) YOLOv3-Litchi results.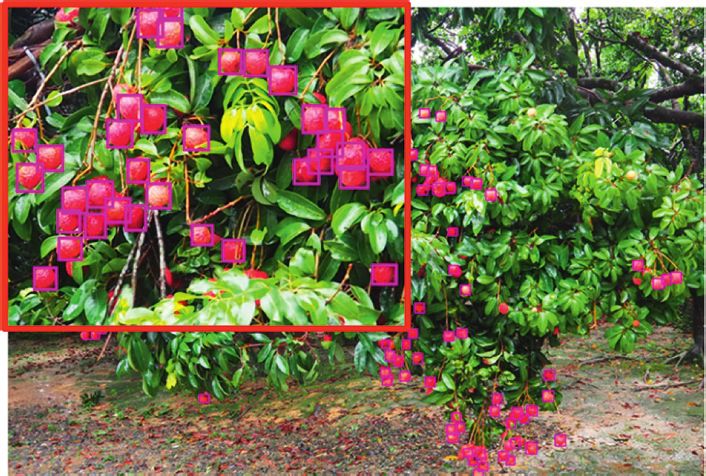
8                                                                                                                   Mathematical Problems in Engineering

                                          800
                                                                                                       743.23

                                          700

                                          600
            Average detection time (ms)

                                          500

                                          400

                                          300

                                          200      165.61                    155.73
                                                                                                                              136.17
                                          100

                                            0
                                                  YOLOv2                    YOLOv3                 Faster R-CNN            YOLOv3-Litchi
                                                                        Figure 9: Fruit detection speed.

                                                            Table 3: Test results of litchis at different growth stages.
Model                                            Growth stage                 Precision (%)             Recall (%)            F1 score         mAP (%)
                                                  Young litchi                    75.31                   53.43                 0.63            47.87
YOLOv3                                          Expanding litchi                  79.95                   56.48                 0.66            55.48
                                                   Ripe litchi                    86.58                   81.45                 0.84            83.49
                                                  Young litchi                    84.15                   64.38                 0.73            67.26
YOLOv3-Litchi                                   Expanding litchi                  86.44                   67.33                 0.76            71.86
                                                   Ripe litchi                    91.40                   85.98                 0.89            93.76

                                                               (a)                                                (b)

          Figure 10: Detection results on young litchis: (a) original YOLOv3 model and (b) proposed YOLOv3-Litchi.

                                                              (a)                                                 (b)

         Figure 11: Detection results of expanding litchis: (a) original YOLOv3 model and (b) proposed YOLOv3-Litchi.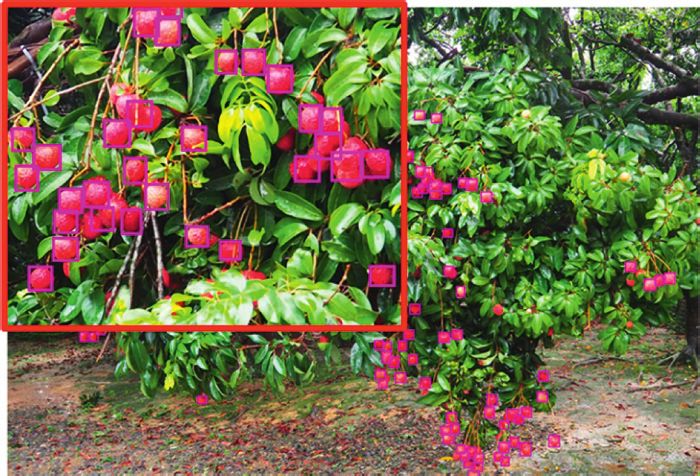
Mathematical Problems in Engineering                                                                                               9

                                         (a)                                              (b)

             Figure 12: Detection results on ripe litchis: (a) original YOLOv3 model and (b) proposed YOLOv3-Litchi.

                                         (a)                                              (b)

      Figure 13: Detection results under different illumination: (a) litchis under strong light and (b) litchis under weak light.

             Table 4: Comparison of model sizes.                             the average detection time for a single image is
Model                                                Size (MB)               136.17 ms. The proposed model can effectively detect
YOLOv2.weights                                          268                  litchi under strong and weak lighting conditions.
YOLOv3.weights                                          234                  Compared with other network models, this model
YOLOv3-Litchi.weights                                   76.9                 takes into account the requirements of recognition
                                                                             accuracy and speed and has the highest detection and
                                                                             positioning accuracy and the best comprehensive
4. Conclusions                                                               performance.
An improved YOLOv3 model was established in this study                   (4) YOLOv3-Litchi and YOLOv3 algorithms have been
for automatic detection of small-scale and densely growing                   used to successfully detect litchi in different growth
litchi fruits in large orchard scenes. Our conclusions can be                stages. YOLOv3-Litchi has better detection perfor-
summarized as follows:                                                       mance at each growth stage than YOLOv3; the
                                                                             proposed algorithm shows the worst detection
   (1) We adjusted the output scale of the original YOLOv3                   performance on young litchi, followed by expanding
       network and reduced its depth to build the proposed                   litchi perform best on ripe litchi.
       improved YOLOv3-Litchi model. We used the
                                                                         (5) We used the YOLOv3-Litchi algorithm to compare
       k-means++ clustering algorithm to cluster the
                                                                             the actual detection effect of litchi with YOLOv2,
       bounding boxes, obtaining nine prior boxes for litchi
                                                                             YOLOv3, and Faster R-CNN and used the F1 value
       detection model training.
                                                                             and the average detection time as the evaluation
   (2) The proposed model and the original model were                        value. The test results show that F1 of YOLOv3-
       trained and tested on the litchi dataset. The results                 Litchi is higher than that of YOLOv2 algorithm 0.1,
       show that YOLOv3-Litchi can successfully detect                       higher than that of YOLOv3 algorithm 0.08, and
       litchi, which is suitable for small and densely dis-                  higher than that of Faster R-CNN algorithm 0.05; the
       tributed fruits.                                                      average detection time of YOLOv3-Litchi is 29.44 ms
   (3) When the input size is 416 × 416, the F1 score of the                 faster than that of YOLOv2 algorithm, 19.56 ms
       YOLOv3-Litchi model for litchi detection is 0.81 and                  faster than that of YOLOv3 algorithm, and 607.06 ms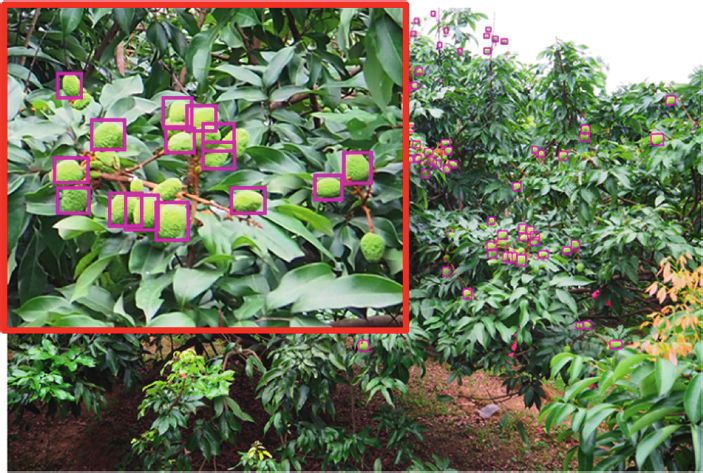
10                                                                                                 Mathematical Problems in Engineering

        faster than that of Faster R-CNN algorithm.                        [7] Y. Chen, W. S. Lee, H. Gan et al., “Strawberry yield prediction
        YOLOv3-Litchi occupies the least computer re-                          based on a deep neural network using high-resolution aerial
        sources than other algorithms.                                         orthoimages,” Remote Sensing, vol. 11, no. 13, p. 1584, 2019.
                                                                           [8] Z. Wang, K. Walsh, and A. Koirala, “Mango fruit load esti-
    The method proposed in this paper may serve as a                           mation using a video based MangoYOLO-kalman filter-
workable reference for further research on dense fruit de-                     Hungarian algorithm method,” Sensors, vol. 19, no. 12,
tection in large visual scenes.                                                p. 2742, 2019.
    Although the YOLOv3-Litchi model proposed in this                      [9] L. Fu, F. Gao, J. Wu, R. Li, M. Karkee, and Q. Zhang, “Ap-
paper can detect litchi fruit with dense distribution well, the                plication of consumer RGB-D cameras for fruit detection and
current detection is tested with sharp pictures and the                        localization in field: a critical review,” Computers and Elec-
sample size is limited. In our future work, we will collect                    tronics in Agriculture, vol. 177, p. 105687, 2020.
                                                                          [10] G. Lin, Y. Tang, X. Zou, J. Cheng, and J. Xiong, “Fruit de-
more data, build a larger dataset for training, and study the
                                                                               tection in natural environment using partial shape matching
dynamic detection of litchi fruit in monitoring images in the
                                                                               and probabilistic Hough transform,” Precision Agriculture,
natural environment.                                                           vol. 21, no. 1, pp. 160–177, 2020.
                                                                          [11] Y. Xu, K. Imou, Y. Kaizu, and K. Saga, “Two-stage approach
Data Availability                                                              for detecting slightly overlapping strawberries using HOG
                                                                               descriptor,” Biosystems Engineering, vol. 115, no. 2,
The data used to support the findings of this study are in-                     pp. 144–153, 2013.
cluded within the article.                                                [12] G. Lin, Y. Tang, X. Zou, J. Xiong, and Y. Fang, “Color-, depth-,
                                                                               and shape-based 3D fruit detection,” Precision Agriculture,
                                                                               vol. 21, no. 1, pp. 1–17, 2020.
Conflicts of Interest                                                     [13] J. Lu and N. Sang, “Detecting citrus fruits and occlusion
                                                                               recovery under natural illumination conditions,” Computers
The authors declare that they have no conflicts of interest.                    and Electronics in Agriculture, vol. 110, pp. 121–130, 2015.
                                                                          [14] L. Fu, E. Tola, A. Al-Mallahi, R. Li, and Y. Cui, “A novel image
                                                                               processing algorithm to separate linearly clustered kiwifruits,”
Acknowledgments                                                                Biosystems Engineering, vol. 183, pp. 184–195, 2019.
                                                                          [15] G. Lin, Y. Tang, X. Zou, J. Li, and J. Xiong, “In-field citrus
This work was supported by grants from the National                            detection and localisation based on RGB-D image analysis,”
Natural Science Foundation of China (no. 51705365), the                        Biosystems Engineering, vol. 186, pp. 34–44, 2019.
Special Fund for Rural Revitalization Strategy of Guangdong               [16] J. Li, Y. Tang, X. Zou, G. Lin, and H. Wang, “Detection of
Province (no. 2018A0169), the Key-Area Research and                            fruit-bearing branches and localization of litchi clusters for
Development Program of Guangdong Province (no.                                 vision-based harvesting robots,” IEEE Access, vol. 8,
2019B020223003), the Science and Technology Planning                           pp. 117746–117758, 2020.
Project of Guangdong Province (no. 2019A050510035), and                   [17] Z.-L. He, J.-T. Xiong, R. Lin et al., “A method of green litchi
the Research Projects of Universities Guangdong Province                       recognition in natural environment based on improved LDA
(no. 2019KTSCX197).                                                            classifier,” Computers and Electronics in Agriculture, vol. 140,
                                                                               pp. 159–167, 2017.
                                                                          [18] J. Xiong, R. Lin, Z. Liu et al., “The recognition of litchi clusters
References                                                                     and the calculation of picking point in a nocturnal natural
                                                                               environment,” Biosystems Engineering, vol. 166, pp. 44–57,
 [1] Y. Tang, M. Chen, C. Wang, L. Luo, J. Li, and X. Zou,                     2018.
     “Recognition and localization methods for vision-based fruit         [19] C. Wang, Y. Tang, X. Zou, L. Luo, and X. Chen, “Recognition
     picking robots: a review,” Front Plant Sci, vol. 11, p. 510, 2020.        and matching of clustered mature litchi fruits using binocular
 [2] Y. Zhao, L. Gong, Y. Huang, and C. Liu, “Robust tomato                    charge-coupled device (CCD) color cameras,” Sensors, vol. 17,
     recognition for robotic harvesting using feature images fu-               no. 11, p. 2564, 2017.
     sion,” Sensors, vol. 16, no. 2, p. 173, 2016.                        [20] Q. Guo, Y. Chen, Y. Tang et al., “Lychee fruit detection based
 [3] W. S. Qureshi, A. Payne, K. B. Walsh, R. Linker, O. Cohen,                on monocular machine vision in orchard environment,”
     and M. N. Dailey, “Machine vision for counting fruit on                   Sensors, vol. 19, no. 19, p. 4091, 2019.
     mango tree canopies,” Precision Agriculture, vol. 18, no. 2,         [21] T. Hussain, S. M. Siniscalchi, C.-C. Lee, S.-S. Wang, Y. Tsao,
     pp. 224–244, 2017.                                                        and W.-H. Liao, “Experimental study on extreme learning
 [4] Y. Song, C. A. Glasbey, G. W. Horgan, G. Polder,                          machine applications for speech enhancement,” IEEE Access,
     J. A. Dieleman, and G. W. A. M. van der Heijden, “Automatic               vol. 5, pp. 25542–25554, 2017.
     fruit recognition and counting from multiple images,” Bio-           [22] C. Songnan, T. Mengxia, and K. Jiangming, “Predicting depth
     systems Engineering, vol. 118, pp. 203–215, 2014.                         from single RGB images with pyramidal three-streamed
 [5] S. Bargoti and J. P. Underwood, “Image segmentation for fruit             networks,” Sensors (Basel, Switzerland), vol. 19, no. 3, p. 667,
     detection and yield estimation in apple orchards,” Journal of             2019.
     Field Robotics, vol. 34, no. 6, pp. 1039–1060, 2017.                 [23] B. Jiang, H. Song, and D. He, “Lameness detection of dairy
 [6] C. Wang, W. S. Lee, X. Zou, D. Choi, H. Gan, and J. Diamond,              cows based on a double normal background statistical model,”
     “Detection and counting of immature green citrus fruit based              Computers and Electronics in Agriculture, vol. 158, pp. 140–
     on the Local Binary Patterns (LBP) feature using illumination-            149, 2019.
     normalized images,” Precision Agriculture, vol. 19, no. 6,           [24] Y. Wu, X. Hu, Z. Wang, J. Wen, J. Kan, and W. Li, “Ex-
     pp. 1062–1083, 2018.                                                      ploration of feature extraction methods and dimension for
Mathematical Problems in Engineering 11
sEMG signal classification,” Applied Sciences, vol. 9, no. 24, [41] M. Chen, Y. Tang, X. Zou et al., “Three-dimensional per-
p. 5343, 2019. ception of orchard banana central stock enhanced by adaptive
[25] S. Oh, S. Oh, and B. Min, “Development of high-efficiency, multi-vision technology,” Computers and Electronics in Ag-
high-speed and high-pressure ambient temperature filling riculture, vol. 174, p. 105508, 2020.
system using pulse volume measurement,” Applied Sciences, [42] C. Liang, J. Xiong, Z. Zheng et al., “A visual detection method
vol. 9, no. 12, p. 2491, 2019. for nighttime litchi fruits and fruiting stems,” Computers and
[26] Q. Zhang and G. Gao, “Prioritizing robotic grasping of Electronics in Agriculture, vol. 169, p. 105192, 2020.
stacked fruit clusters based on stalk location in RGB-D im- [43] T. T. Santos, L. L. de Souza, A. A. dos Santos, and S. Avila,
ages,” Computers and Electronics in Agriculture, vol. 172, “Grape detection, segmentation, and tracking using deep
p. 105359, 2020. neural networks and three-dimensional association,” Com-
[27] B. Jiang, Q. Wu, X. Yin, D. Wu, H. Song, and D. He, puters and Electronics in Agriculture, vol. 170, p. 105247, 2020.
“FLYOLOv3 deep learning for key parts of dairy cow body [44] J. Redmon and A. Farhadi, “YOLOv3: an incremental im-
detection,” Computers and Electronics in Agriculture, vol. 166, provement,” 2018, https://arxiv.org/abs/1804.02767.
p. 104982, 2019. [45] J. Redmon, S. Divvala, R. Girshick, and A. Farhadi, “You only
[28] L. Fu, Y. Feng, J. Wu et al., “Fast and accurate detection of look once: unified, real-time object detection,” in Proceedings
kiwifruit in orchard using improved YOLOv3-tiny model,” of the IEEE Conference on Computer Vision and Pattern
Precision Agriculture, 2020. Recognition, pp. 779–788, IEEE, New York, NY, USA, 2016.
[29] L. Fu, Y. Majeed, X. Zhang, M. Karkee, and Q. Zhang, “Faster [46] J. Redmon and A. Farhadi, “YOLO9000: better, faster,
R-CNN-based apple detection in dense-foliage fruiting-wall stronger,” in Proceedings of the 2017 IEEE Conference on
trees using RGB and depth features for robotic harvesting,” Computer Vision and Pattern Recognition (CVPR), Honolulu,
Biosystems Engineering, vol. 197, pp. 245–256, 2020. HI, USA, July 2016.
[30] G. Lin, Y. Tang, X. Zou, J. Xiong, and J. Li, “Guava detection [47] S. Ren, K. He, R. Girshick, and J. Sun, “Faster R-CNN: towards
and pose estimation using a low-cost RGB-D sensor in the real-time object detection with region proposal networks,”
field,” Sensors, vol. 19, no. 2, p. 428, 2019. IEEE Transactions on Pattern Analysis and Machine Intelli-
[31] A. Koirala, K. B. Walsh, Z. Wang, and C. McCarthy, “Deep gence, vol. 39, no. 6, 2017.
learning - method overview and review of use for fruit de- [48] T. Lin, P. Dollár, R. Girshick, K. He, B. Hariharan, and
tection and yield estimation,” Computers and Electronics in S. Belongie, “Feature pyramid networks for object detection,”
Agriculture, vol. 162, pp. 219–234, 2019. in Proceedings of the 2017 IEEE Conference on Computer
[32] Q. Liang, W. Zhu, J. Long, Y. Wang, W. Sun, and W. Wu, “A Vision and Pattern Recognition (CVPR), Honolulu, HI, USA,
real-time detection framework for on-tree mango based on July 2016.
SSD network,” in Proceedings of the 11th International [49] D. Arthur and S. Vassilvitskii, K-Means: The Advantages of
Conference, ICIRA 2018, Newcastle, Australia, August 2018. Careful Seeding, Society for Industrial and Applied Mathe-
[33] H. Basri, I. Syarif, and S. Sukaridhoto, “Faster R-CNN matics, Philadelphia, PA, USA, 2007.
implementation method for multi-fruit detection using ten- [50] K. He, X. Zhang, S. Ren, and J. Sun, “Spatial pyramid pooling
sorflow platform,” in Proceedings of the 2018 International in deep convolutional networks for visual recognition,” IEEE
Electronics Symposium on Knowledge Creation and Intelligent Transactions on Pattern Analysis and Machine Intelligence,
Computing, pp. 337–340, Surabaya, Indonesia, October 2018. vol. 37, no. 9, pp. 1904–1916, 2015.
[34] N. Lamb and M. C. Chuah, “A strawberry detection system
using convolutional neural networks,” in Proceedings of the
IEEE International Conference on Big Data, pp. 2515–2520,
Seattle, WA, USA, December 2018.
[35] I. Sa, Z. Ge, F. Dayoub, B. Upcroft, T. Perez, and C. McCool,
“DeepFruits: a fruit detection system using deep neural
networks,” Sensors, vol. 16, no. 8, p. 1222, 2016.
[36] S. W. Chen, S. S. Shivakumar, S. Dcunha et al., “Counting
apples and oranges with deep learning: a data-driven ap-
proach,” IEEE Robotics and Automation Letters, vol. 2, no. 2,
pp. 781–788, 2017.
[37] Y. Tian, G. Yang, Z. Wang, H. Wang, E. Li, and Z. Liang,
“Apple detection during different growth stages in orchards
using the improved YOLO-V3 model,” Computers and
Electronics in Agriculture, vol. 157, pp. 417–426, 2019.
[38] A. Koirala, K. B. Walsh, Z. Wang, and C. McCarthy, “Deep
learning for real-time fruit detection and orchard fruit load
estimation: benchmarking of “MangoYOLO”” Precision Ag-
riculture, vol. 20, no. 6, p. 1107, 2019.
[39] C. Wang, T. Luo, L. Zhao, Y. Tang, and X. Zou, “Window
zooming-based localization algorithm of fruit and vegetable
for harvesting robot,” IEEE Access, vol. 7, pp. 103639–103649,
2019.
[40] F. Gao, L. Fu, X. Zhang et al., “Multi-class fruit-on-plant de-
tection for apple in SNAP system using Faster R-CNN,”
Computers and Electronics in Agriculture, vol. 176105634 pages,
2020.You can also read