Factors That Affect Liquefaction-Induced Lateral Spreading in Large Subduction Earthquakes - MDPI
←
→
Page content transcription
If your browser does not render page correctly, please read the page content below
applied
           sciences
Article
Factors That Affect Liquefaction-Induced Lateral
Spreading in Large Subduction Earthquakes
William Araujo         and Christian Ledezma *
 Department of Structural and Geotechnical Engineering, Pontificia Universidad Católica de Chile,
 Vicuña Mackenna 4860, Santiago 7820436, Chile; wsaraujo@uc.cl
 * Correspondence: cledezma@uc.cl; Tel.: +56-2-2354-4207

 Received: 11 August 2020; Accepted: 13 September 2020; Published: 18 September 2020

 Abstract: Liquefaction-induced lateral spreading can induce significant deformations and damage in
 existing structures, such as ports, bridges, and pipes. Past earthquakes have caused this phenomenon
 in coastal areas and rivers in many parts of the world. Current lateral spreading prediction models
 tend to either overestimate or underestimate the actual displacements by a factor of two or more when
 applied to large subduction earthquake events. The purpose of this study was to identify ground
 motion intensity measures and soil parameters that better correlate with observed lateral spreading
 under large-magnitude (Mw ≥ 7.5) subduction earthquakes that have occurred in countries like Chile,
 Japan, and Peru. A numerical approach was first validated against centrifuge and historical cases and
 then used to generate parametric models on which statistical analysis was applied. Our results show
 that cumulative absolute velocity (CAV), Housner intensity (HI), and sustained maximum velocity
 (SMV) have a reasonably good correlation with lateral spreading for the analyzed cases.

 Keywords: lateral spreading; parametric study; subduction earthquakes

1. Introduction
      Several models, either analytical, empirical, or computational, have been formulated to predict
the behavior of liquefiable soils and to anticipate the amount of lateral displacements that can
be generated during earthquakes. The purpose has been to provide recommendations for the
design of, e.g., foundations and embankments to mitigate losses in the case of future earthquakes
(Valsamis et al. (2010) [1]). An evaluation of currently used empirical models (Bartlett et al. (1995) [2],
Faris et al. (2006) [3], Zhang et al. (2012) [4], Youd et al. (2002) [5], Rauch et al. (2006) [6]) was
made by Tryon (2014) [7] and Williams (2015) [8] using historical cases of large-magnitude subduction
earthquakes. They found weaknesses in those empirical models. Firstly, there was a lack of historical
case data with earthquakes of moment magnitudes greater than 8 (the only historical case was the 1964
Alaska Mw 9.2 earthquake). Secondly, the term referring to the distance from the site to the seismic
source (R) is more challenging to determine when dealing with large magnitude earthquakes.
      The main aim of this paper is to investigate, using an appropriate numerical model
(Elgamal et al. (2002) [9]), the effects of different geotechnical and seismic parameters on the amount
of lateral spreading in free-field conditions during large-magnitude subduction earthquakes.

2. Background of Lateral Spreading in Subduction Earthquakes
     Current techniques used to predict liquefaction-induced lateral spreading are mostly empirical
(Bray et al. (2010) [10]). Observations from recent earthquakes have shown that these models become
inaccurate when extrapolated beyond their limits, such as large-magnitude events or different fault
types. In this section, the phenomena of liquefaction and lateral spreading and the issues with current
prediction models, when applied to subduction earthquakes, are described.

Appl. Sci. 2020, 10, 6503; doi:10.3390/app10186503                               www.mdpi.com/journal/applsci
Liquefaction is a relevant soil phenomenon for geotechnical design as it may cause local or global
failures of foundations and even the collapse of complete structures (Jia (2017) [13]). Among the
potential
Appl. consequences
Sci. 2020, 10, x FOR PEER ofREVIEW
soil liquefaction, one of the most dangerous ones is lateral spreading. 2Youd of 21
(2018)[12] defined this phenomenon as the horizontal displacement of a soil layer riding on liquefied
2.1.
soil Liquefaction
Appl. either
Sci. 2020,down anda Lateral
10, 6503 gentleSpreading
slope or toward a free face like a river channel (Figure 2). When 2 ofthe
21
underlying
The word soilliquefaction
layer liquefies,was the firstnon-liquefied
used after theupper 1964 soil crustMw7.6
Niigata continues moving(Kawata
earthquake down until et al.it
reaches
2018 a new equilibrium
[11]). This phenomenon position. Figure 3 shows two recent examples of liquefaction-induced
is defined as a change of the soil phase from a solid to a liquid state due
2.1. Liquefaction and Lateral Spreading
lateral
to spreading:
pore water pressure(1) west levee and
increment, of thetheWestside
correspondingMain loss
Canal in the 2010
of effective Sierra
stress, duringEl Mayor Mw 7.1
an earthquake
(Figure 1). As Youd (2018) [12] indicated, when an earthquake occurs, waves propagate through[11]).
The
earthquake, word liquefaction
where a was
cumulative first used after
horizontal the 1964 Niigata
displacement ofMw7.6
more earthquake
than 1 m (Kawata
was observed et al. 2018
(Figure 3a),
the
This
and phenomenon
(2) the Muzoi is defined
Bridge inas a
the change
2005 of
Nias the soil
Island phase
Mw from
8.6 a solid
earthquake, to a liquid
where
soil, shear strains increase, pore water pressure goes up, and the intergranular forces get reduced. As state
a due
lateral to pore
movement waterof
pressure
morewater
pore than increment,
4pressures
m towards and theriver
the
reach acorresponding
on both
critical loss
sides
level, andofof effective
the
the bridge stress,
was
intergranular during
reported
stresses anapproach
earthquake
(Figure 3b). zero, (Figure
the soil1).
As Youd (2018)
Prediction [12]
of indicated,
lateral when
spreading
behavior goes from a solid to a viscous liquid state. an
is earthquake
essential occurs,
because it waves
can propagate
cause damage through
to the the soil,
overlying shear
and
strains
subsurfaceincrease,
Liquefaction pore
is a water
infrastructure, pressure
relevant andsoilthe goes
amount
phenomenon up, and forthe
of intergranular
displacement
geotechnical mayforces
design as get
influencereduced.
it may As pore
the design
cause local water
of the
or global
pressures
failures ofreach
infrastructure a criticaland
concerning
foundations level,
theeven andthe
decision thecollapse
intergranular
to, for instance, stresses
perform
of complete approach zero,
soil improvement
structures (Jia the in
(2017) soil
thebehavior
[13]). area
Among goes
affected
the
from
by a
this solid to
phenomenona viscous liquid
(Bray et state.
al. (2017) [10]).
potential consequences of soil liquefaction, one of the most dangerous ones is lateral spreading. Youd
(2018)[12] defined this phenomenon as the horizontal displacement of a soil layer riding on liquefied
soil either down a gentle slope or toward a free face like a river channel (Figure 2). When the
underlying soil layer liquefies, the non-liquefied upper soil crust continues moving down until it
reaches a new equilibrium position. Figure 3 shows two recent examples of liquefaction-induced
lateral spreading: (1) west levee of the Westside Main Canal in the 2010 Sierra El Mayor Mw 7.1
earthquake, where a cumulative horizontal displacement of more than 1 m was observed (Figure 3a),
and (2) the Muzoi Bridge in the 2005 Nias Island Mw 8.6 earthquake, where a lateral movement of
more than 4 m towards the river on both sides of the bridge was reported (Figure 3b).
Prediction of lateral spreading is essential because it can cause damage to the overlying and
subsurface infrastructure, and the amount of displacement may influence the design of the
infrastructure concerning the decision to, for instance, perform soil improvement in the area affected
by this phenomenon (Bray et al. (2017) [10]).
Figure
Figure 1.
1. Liquefaction
Liquefaction mechanism:
mechanism: soil
soil particles
particles floating
floating due
due to
to the increment of
the increment of pore
pore water
water pressure.
pressure
Liquefaction is a relevant soil phenomenon for geotechnical design as it may cause local or global
failures of foundations and even the collapse of complete structures (Jia (2017) [13]). Among the
potential consequences of soil liquefaction, one of the most dangerous ones is lateral spreading.
Youd (2018) [12] defined this phenomenon as the horizontal displacement of a soil layer riding on
liquefied soil either down a gentle slope or toward a free face like a river channel (Figure 2). When the
underlying soil layer liquefies, the non-liquefied upper soil crust continues moving down until it
reaches a new equilibrium position. Figure 3 shows two recent examples of liquefaction-induced lateral
spreading: (1) west levee of the Westside Main Canal in the 2010 Sierra El Mayor Mw 7.1 earthquake,
where a cumulative horizontal
Figure displacement
2. Schematic of more
representation thanspreading
of lateral 1 m was(Youd
observed (Figure
(2018) [12]). 3a), and (2) the
Muzoi Bridge in the 2005 Nias Island Mw 8.6 earthquake, where a lateral movement of more than 4 m
towards the river on both sides of the bridge was reported (Figure 3b).
Figure 1. Liquefaction mechanism: soil particles floating due to the increment of pore water pressure
Figure
Figure 2.
2. Schematic
Schematic representation
representation of
of lateral
lateral spreading
spreading (Youd (2018) [12]).
(Youd (2018) [12]).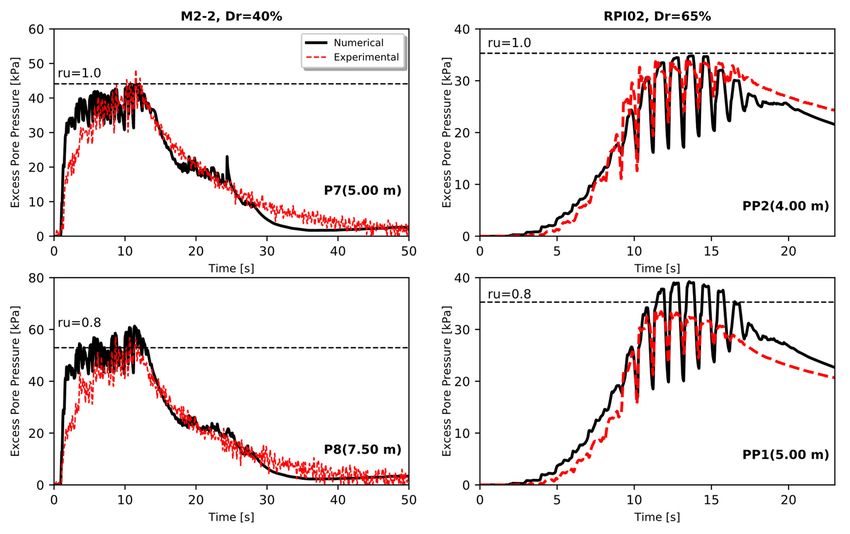
Appl. Sci. 2020, 10, 6503 3 of 21
Appl. Sci. 2020, 10, x FOR PEER REVIEW 3 of 21
(a) (b)
Figure 3. Historical
Historicalcases
casesof oflateral
lateralspread:
spread:(a)
(a)lateral
lateralspread
spreadground
groundfailure
failurenear
nearthe
thewest
westlevee ofof
levee
Westside Main Canal
Canal in in the
the 2010
2010Sierra
SierraEl
ElMayor
MayorMw7.1
Mw7.1earthquake
earthquake(photo
(phototaken
takenbybyJohn
JohnTinsley onon
Tinsley
4/7/10, Mccrick et
et al.
al. (2011)
(2011)[14]);
[14]);(b)
(b)lateral
lateralspread
spreadaffecting
affectingthethepiers
piersofofthe
theMuzoi
Muzoi Bridge
Bridgeinin
the 2005
the 2005
Nias Island Mw 8.6 earthquake (modified from Aydan et al.
Mw 8.6 earthquake (modified from Aydan et al. (2005) [15]).(2005) [15]).
Prediction
2.2. Lateral of lateral
Spreading spreading
Prediction Modelsis essential because it can cause damage to the overlying and
subsurface infrastructure, and the amount of displacement may influence the design of the infrastructure
Most of the lateral spreading prediction models are empirical. They use regression procedures
concerning the decision to, for instance, perform soil improvement in the area affected by this
to fit equations with field case histories (Hamada et al. (1987) [16], Bartlett and Youd (1995) [2], Youd
phenomenon (Bray et al. (2017) [10]).
et al. (2002) [5]). These models take different algebraic forms, and they rely on parameters such as
the liquefiable
2.2. soil’s thickness,
Lateral Spreading Predictiondensity,
Models and fines content; earthquake magnitude; and site-to-source
distance. Semi-empirical models (Zhang et al. (2004) [17]; Faris et al. (2006) [3]) use other variables,
Most strain
like shear of the ratios
lateralandspreading prediction
earthquake intensitymodels are empirical.
measures, such as peakThey use regression
surface acceleration.procedures
Table
to fit equations
1 shows with field
a list of existing casespreading
lateral histories prediction
(Hamada modelset al. (1987) [16],main
and their Bartlett and Youd (1995) [2],
variables.
Youd et al. (2002) [5]). These models take different algebraic forms, and they rely on parameters such
as the liquefiable soil’s thickness, Tabledensity, and
1. Lateral fines content;
spreading earthquake
prediction models. magnitude; and site-to-source
distance. Semi-empirical models (Zhang et al. (2004) [17]; Faris et al. (2006) [3]) use other variables,
Author(s) Variables
like shear strain ratios and earthquake intensity measures, such as peak surface acceleration. Table 1
Hamada et al. (1987) [16] Ground slope, thickness of the liquefiable layer
shows a list of existing lateral spreading prediction models and their main variables.
Bartlett and Youd (1995) Ground slope, thickness of the liquefiable layer, fines content,
[2] average grain size, earthquake magnitude, horizontal distance from
Table 1. Lateral spreading prediction models.
the site to the seismic energy source.
Youd et al. (2002) [5]
Author(s) Ground slope, thickness of the liquefiable
Variables layer, fines content,
Hamada et al. (1987) [16] average grain size, earthquake magnitude,
Ground slope, thickness of the liquefiable horizontal
layer distance from
Bartlett and Youd (1995) [2] the site to the seismic energy source.
Ground slope, thickness of the liquefiable layer, fines content,
Zhang et al. (2004) [17] Ground average grain size,of
slope, thickness earthquake magnitude,
the liquefiable layer,horizontal distance
shear strain,
from the site to the seismic energy source.
earthquake magnitude, depth to the liquefiable layer.
Youd et al. (2002) [5] Ground slope, thickness of the liquefiable layer, fines content,
Faris et al. (2006) [3] Seismic coefficient, earthquake magnitude, horizontal distance from
average grain size, earthquake magnitude, horizontal distance
the site to thethe
from seismic
site toenergy source.
the seismic energy source.
OlsonZhang
and Jhonson (2008)
et al. (2004) [17] Ground Ground
slope, thickness of the of
slope, thickness liquefiable layer,layer,
the liquefiable finesshear
content,
strain,
[18] average earthquake
grain size, magnitude,
earthquakedepth to the liquefiable
magnitude, horizontal layer.
distance from
Faris et al. (2006) [3] Seismic
the site to coefficient,
the seismic earthquake
energy source,magnitude, horizontal
post-liquefaction distance
undrained
from the site to the seismic energy source.
Olson and Jhonson (2008)shear [18] strength.
Ground slope, thickness of the liquefiable layer, fines content,
Zhang et al. (2012) [4] Ground average
slope, thickness
grain size,of the liquefiable
earthquake layer,horizontal
magnitude, fines content,
distance
average from
grainthesize,
sitepseudo-spectral displacement.
to the seismic energy source, post-liquefaction
Gillins and Bartlett (2014) Ground undrained shear strength.
slope, thickness of the liquefiable layer, fines content,
Zhang et al. (2012) [4] Ground slope, thickness of the liquefiable layer, fines content,
[19] average grain size, earthquake magnitude, horizontal distance from
average grain size, pseudo-spectral displacement.
the site to the seismic energy source.
Pirhadi et al. (2019) [20] Ground slope, thickness of the liquefiable layer, fines content,
average grain size, earthquake magnitude, cumulative absolute
velocity, peak ground acceleration.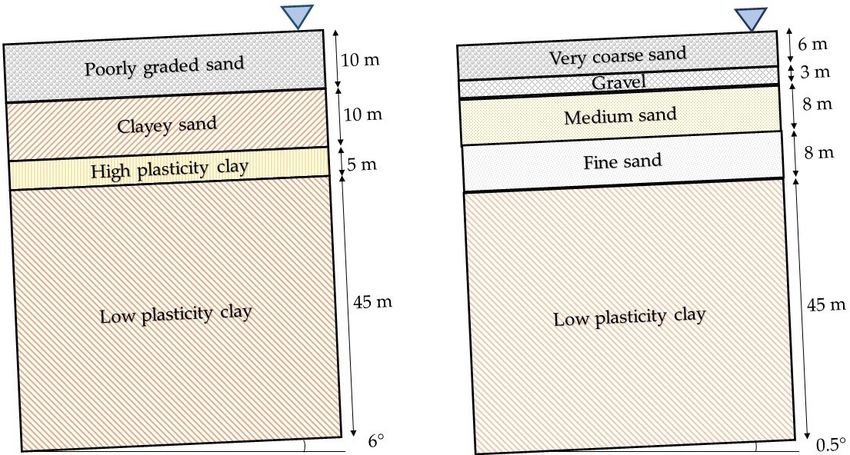
Appl. Sci. 2020, 10, 6503 4 of 21
Table 1. Cont.
Author(s) Variables
Gillins and Bartlett (2014) [19] Ground slope, thickness of the liquefiable layer, fines content,
average grain size, earthquake magnitude, horizontal distance
from the site to the seismic energy source.
Pirhadi et al. (2019) [20] Ground slope, thickness of the liquefiable layer, fines content,
Appl. Sci. 2020, 10, x FOR PEER REVIEW average grain size, earthquake magnitude, cumulative 4 of 21
absolute velocity, peak ground acceleration.
2.3. Current Models and Large-Magnitude Subduction Earthquakes
2.3. Current Models and Large-Magnitude Subduction Earthquakes
Tryon (2014) [7] evaluated six empirical models used in practice (Youd et al. (2002) [5]; Bartlett
Tryon(1995)
and Youd (2014)[2],
[7] Faris
evaluated
et al. six empirical
(2006) models
[3], Zhang used
et al. in practice
(2012) [4], and(Youd
Zhangetetal.al.(2002)
(2004)[5]; Bartlett
[17]) with
and Youd (1995) [2], Faris et al. (2006) [3], Zhang et al. (2012) [4], and Zhang
three case-histories from the 2010 Maule Mw 8.8 subduction earthquake. He found that site-to-source et al. (2004) [17]) with
three case-histories from the 2010 Maule Mw 8.8 subduction earthquake.
distances are difficult to define accurately for large subduction zone earthquakes. They can vary He found that site-to-source
distances arebetween
significantly difficultseismic
to define accurately
regions, making forit large subduction
difficult to recommend zone aearthquakes. They can such
method for calculating vary
significantly between seismic regions, making it difficult to recommend
an “R” value. Figure 4 shows a summary of different distance terms that can be considered: D1 = a method for calculating
such an “R”distance,
hypocentral value. Figure 4 shows adistance,
D2 = epicentral summaryD3 of=different distancetoterms
closest distance that can
high-stress be considered:
zone, D4 = closet
D1 = hypocentral distance, D2 = epicentral distance, D3 = closest distance
distance to the edge of the fault rupture, D5 = closest distance to the surface projection of the rupture to high-stress zone,
D4 = closet distance to the edge of the fault rupture, D5 = closest distance
(Joyner Boore distance). In large subduction earthquakes, although there is a small area where the to the surface projection of
the rupture begins
earthquake (Joyner(hypocenter),
Boore distance). thereInarelarge subduction
multiple zonesearthquakes,
on the contact although
betweenthereplatesis a(“patches”)
small area
where the earthquake begins (hypocenter), there are multiple zones on
where energy is released at different times and with different intensities. Hence, although distancesthe contact between plates
(“patches”) where energy is released at different times and with different
D1, D2, and D3 could be defined, they do not necessarily have a reasonable correlation with the intensities. Hence, although
distances of
intensity D1,theD2, and D3motion
ground could be at defined,
the site of they do notAdditionally,
interest. necessarily have for aseismically
reasonableactivecorrelation with
countries,
the intensity of the ground motion at the site of interest. Additionally,
such as Chile and Peru, D4 and D5 are very small or even zero. From a design point of view, for seismically active countries,
such as Chile
estimating anddistances
these Peru, D4 before
and D5an areearthquake
very small occurs
or eveniszero.veryFrom a design point of view, estimating
difficult.
these distances before an earthquake occurs is very difficult.
Figure 4. Distances
Distances from
from an
an earthquake
earthquake source
source to
to the
the site
site of
of interest
interest (adapted
(adapted from
from Joyner and Boore
(1988) [21]).
Similarly, Williams
Similarly, Williams (2015)(2015) [8]
[8] used
used twotwo case-histories from the
case-histories from the 2010
2010 Maule
Maule Mw Mw 8.8
8.8 earthquake
earthquake
to evaluate the empirical methods developed by Youd et al. (2002) [5]
to evaluate the empirical methods developed by Youd et al. (2002) [5] and by Bartlett and Youd and by Bartlett and(1995)
Youd
(1995) [2], concluding that they are extremely sensitive to the distance term,
[2], concluding that they are extremely sensitive to the distance term, R, and that the current R, and that the current
definition of
definition of RR for
for these
these two
two methods
methods (the(the Joyner
Joyner Boore
Boore distance)
distance) resulted
resulted inin predictions
predictions thatthat were
were
more than two times the measured values. The semi-empirical models by
more than two times the measured values. The semi-empirical models by Zhang et al. (2004) [17] and Zhang et al. (2004) [17]
and Faris et al. (2006) [3] also over predicted the displacement but in these
Faris et al. (2006) [3] also over predicted the displacement but in these cases due to the depth cases due to the depth
weighting factor
weighting factor of their models.
of their models. In In particular,
particular, the empirical model
the empirical model of Zhang et
of Zhang al. (2004)
et al. (2004) [4]
[4] predicted
predicted
displacements roughly six to eight times larger than the measured displacements.
displacements roughly six to eight times larger than the measured displacements. On the other hand, On the other hand,
De la Maza et al. (2017) [22] studied one case history (Caleta Lo Rojas) from
De la Maza et al. (2017) [22] studied one case history (Caleta Lo Rojas) from the 2010 Maule Mw8.8 the 2010 Maule Mw8.8
earthquake. They
earthquake. They used used the
theYoud
Youdetetal.al.(2002)
(2002)[5][5]methodology
methodology with different
with differentdistances, finding
distances, thatthat
finding the
the distance to the zone that bounds 10% of the largest slips resulted in satisfactory values when
compared against in-situ post-earthquake measurements.
In this study, we analyzed 13 lateral spread cases from six sites affected by the 2010 Maule Mw
8.8 earthquake, where lateral spreading took place (Figure 5). Figure 6 shows a comparison between
observed and calculated lateral spreading using Youd et al.’s (2002) [5] methodology with three R-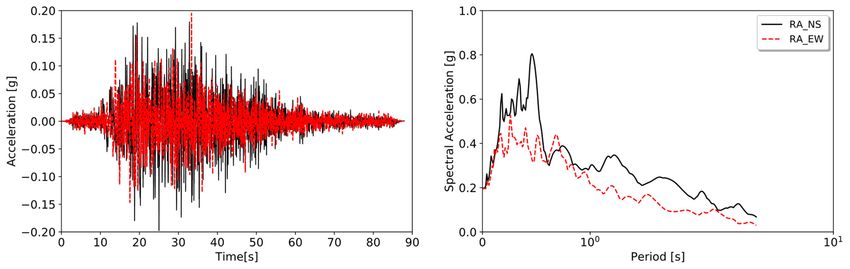
Appl. Sci. 2020, 10, 6503 5 of 21
Appl. Sci. 2020, 10, x FOR PEER REVIEW 5 of 21
Appl. Sci.to
distance 2020,
the10, x FOR
zone PEER
that REVIEW
bounds 10% of the largest slips resulted in satisfactory values when compared 5 of 21
against in-situ
InInall post-earthquake measurements.
allcases,
cases,thetheconclusion
conclusionwas wassimilar
similar to to those
those of
of Tryon (2014) [7],
Tryon (2014) [7], Williams
Williams(2015)
(2015)[8],[8],and
andDe De
In this
lalaMaza et study,
al. we analyzed
(2017) [22], 13 lateral
namely in thatspread
the cases from
Youd et al. six sites[5]
(2002) affected
model, byfor
thelarge-magnitude
2010 Maule Mw
Maza et al. (2017) [22], namely in that the Youd et al. (2002) [5] model, for large-magnitude
8.8 earthquake,
subduction where lateral spreading the took place (Figure 5). Figure 6 shows a comparison between
subductionearthquakes,
earthquakes,overestimates
overestimates the liquefaction-induced
liquefaction-induced laterallateral displacements
displacements bybyaafactor
factorofof
observed
more than andtwo.calculated
Figure 6clateral
shows,spreading
however, using
that Youd
there et al.’s
are a (2002)
few sites[5] methodology
where the with
predictions threewereR-value
close
more than two. Figure 6c shows, however, that there are a few sites where the predictions were close
definitions.
totothe The first one
measurements. is the
Those original
sites were Rthose
fromwhere
Youd ettheal.’s (2002)was
R-value [5] methodology,
that of De la the second
Maza et al. one is
(2017)
the measurements. Those sites were those where the R-value was that of De la Maza et al. (2017)
the
[22] distance
[22]andandwhere
to the
wherethe
maximum
theaverage
averagefines
observed
finescontent
coastal
content in in the
uplift, and the
the cumulative
third one
thickness
cumulative thickness of is
of
the
the
the
distancegranular
saturated
saturated
used bylayer
granular De la
layer
Maza
was
was et
less al.
than
less (2017)
than 5%. [22],
5%.This which
Thisis onlyis
isonly andefined
an initial as the distance
initialobservation,
observation, and
andtomuch
the zone
much more
more that bounds 10%need
case-histories
case-histories of the
need totolargest
bestudied
be slips.
studied
The
beforemeasured
beforegeneralizing, lateral displacements
generalizing,orornot notgeneralizing,at the
generalizing,this selected sites
this conclusion.
conclusion. were between 1 and 2 m.
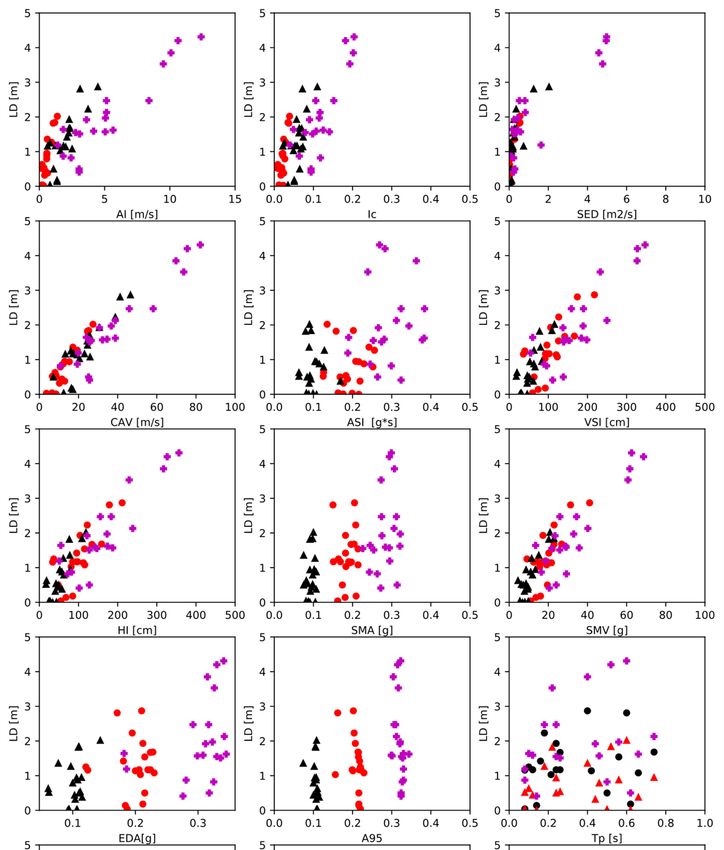
Figure 5. Google Earth® view of sites with lateral spreading for the 2010 Maule Mw 8.8 Earthquake
Figure 5. Google Earth® view of
® view of sites
sites with
with lateral
lateral spreading
spreading for
for the 2010 Maule Mw 8.8 Earthquake
using Moreno et al.’s (2010) [23] coseismal slip distribution model.
using Moreno et al.’s (2010) [23] coseismal slip
slip distribution
distribution model.
model.
(a) (b) (c)
(a) (b) (c)
Figure
Figure 6. 6.Observed
Observed versus
versus estimated
estimated lateral
lateral displacements
displacements using:
using: (a)(a) original
original R-value
R-value from
from YoudYoud et
et al.’s
al.‘s (2002)
(2002)
Figure equation,
equation,
6. Observed (b) distance
(b) versus
distance to thetomaximum
estimated the maximum
lateral uplift,
uplift, andand
displacements (c) (c) distance
distance
using: adopted
adopted
(a) original bybyDeDe
R-value la la
from Maza
Maza etetal.
Youd et
al.
(2017)(2017)
[22]. [22].
al.‘s (2002) equation, (b) distance to the maximum uplift, and (c) distance adopted by De la Maza et
al. (2017) [22].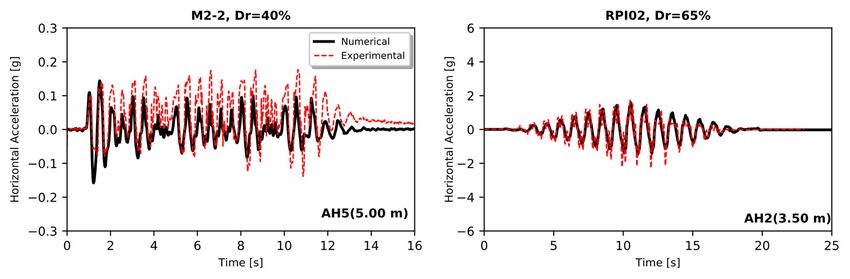
Appl. Sci. 2020, 10, 6503                                                                                    6 of 21

     In all cases, the conclusion was similar to those of Tryon (2014) [7], Williams (2015) [8], and De la
Maza et al. (2017) [22], namely in that the Youd et al. (2002) [5] model, for large-magnitude subduction
earthquakes, overestimates the liquefaction-induced lateral displacements by a factor of more than
two. Figure 6c shows, however, that there are a few sites where the predictions were close to the
measurements. Those sites were those where the R-value was that of De la Maza et al. (2017) [22] and
where the average fines content in the cumulative thickness of the saturated granular layer was less
than 5%. This is only an initial observation, and much more case-histories need to be studied before
generalizing, or not generalizing, this conclusion.

3. Validation of the Numerical Methodology
      The simulations in this study were performed using Cyclic1D, a finite-element program for
one-dimensional dynamic site-response analyses (Elgamal et al. (2002) [9]). Cyclic1D uses a
multi-yield-surface plasticity constitutive model to simulate the cyclic mobility response mechanism.
The constitutive model uses a non-associative flow rule for simulating volumetrically contractive or
dilative response due to shear loading. More details of the constitutive model are presented in Elgamal
et al. (2002) [9], Yang et al. (2003) [24], and Elgamal et al. (2003) [25].

3.1. Validation with Centrifuge Tests
     To evaluate the accuracy of the selected numerical methodology, several centrifuge tests were
simulated. Table 2 gives a list of the centrifuge experiments that were used, where i = surface inclination,
Dr = relative density of the liquefiable layer, H = thickness of the liquefiable layer, amax = maximum
horizontal acceleration of the input ground motion, and Dh = residual lateral displacement at the
surface. Table 3 shows a list of input parameters of the constitutive model, a suggested range of values
recommended in Cyclic1D user’s manual (Elgamal et al. (2015) [26]) for saturated granular soil, and the
calibrated model parameters for Nevada and Ottawa sand used in this study.

                            Table 2. Centrifuge tests used to validate the numerical methodology.

               Test          i [◦ ]   Dr [%]   H [m]   amax [g]   Dh [cm]              Reference
              M1-2            0       40–45     10       0.23       1.7      Taboada and Dobry (1998) [27]
              M2-2           1.94     40–45     10       0.23       47.0     Taboada and Dobry (1998) [27]
             M2c-6           3.95     40–45     10       0.17       72.5     Taboada and Dobry (1998) [27]
            L45V2-10          2        45       10       0.23        66          Sharp et al. (2003) [28]
            L65V2-10          2        65       10       0.20        28          Sharp et al. (2003) [28]
            L75V2-10          2        75       10       0.21        23          Sharp et al. (2003) [28]
             RPI-02           5        65        5       0.17        35         Ziotopoulou (2018) [29]

     The numerical methodology was previously validated against centrifuge experiments by other
researchers (Elgamal et al. (2002) [9]). In this study, we reproduced the experimental results from
the projects VELACS (Arulanandan and Scott (1993) [32], Taboada and Dobry (1998) [27]) and LEAP
(Kutter et al. (2018) [33], Ziotopoulou (2018) [29]), in addition to the centrifuge tests from Sharp et al.
(2003) [28].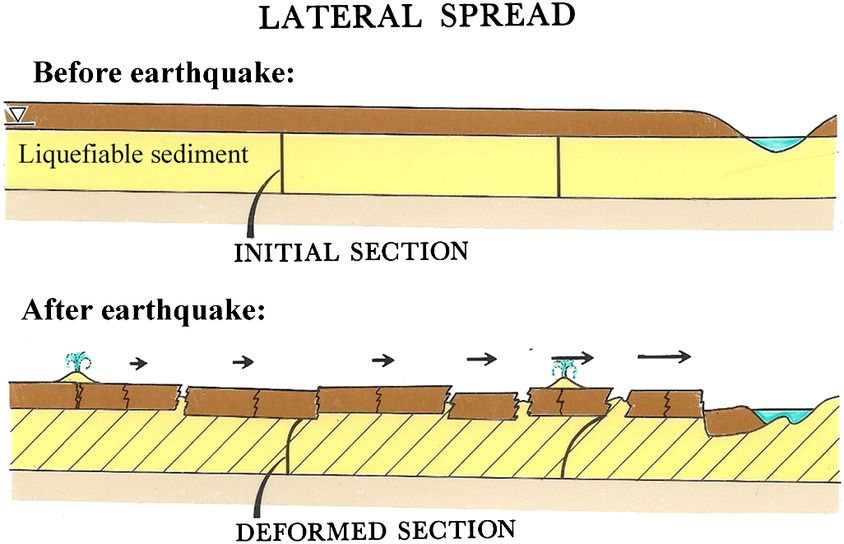
Appl. Sci. 2020, 10, 6503                                                                                                 7 of 21

                                 Table 3. Input variables for Cyclic1D’s numerical model.

                                      Nevada Sand       Ottawa F65                          Standard       Coefficient of
              Parameter                                                 Mean Value 1
                                       Dr = 40%         Dr = 65%                           Deviation 1     Variation 1 [%]
    Mass density [ρ] (kg/m3 )             1800             1900              1570               270                 9%
    Reference shear wave
                                          203.3            203.3             242.5             16.5                 28%
    velocity [Vs ref] (m/s)
    Confinement
                                           0.5              0.5
    coefficient [coeff]
    Coefficient of lateral
                                           0.5              0.67
    pressure [Ko]
    Friction angle [ϕ] (◦ )                31.4             31.4             40.5               2.1                 5%
    Peak shear strain
                                            5                   5
    [γ max] (%)
    Number of yield surfaces
                                            20               20
    [NYS]
    Phase transformation angle
                                           26.5             26.5             32.9               2.2                 7%
    [PT angle] (◦ )
    Contraction parameter 1 [c1]           0.19             0.19             0.12              0.04                 32%
    Contraction parameter 2 [c2]            0.2              0.2
    Dilatation parameter 1 [d1]            0.2              0.2              0.11              0.04                 42%
    Dilatation parameter 2 [d2]             10               10
    Liquefaction parameter [Liq]          0.015            0.015
    Permeability coefficient
                                        3.3 × 10⁻³       6.6 × 10⁻⁵
    [Perm k] (m/s)
              1   Mean value and standard deviation from Mercado et al. (2019) [30] and Phoon et al. (1995) [31].

3.1.1. General Description of the Centrifuge Tests
      The project Verification of Liquefaction Analysis by Centrifuge Studies (VELACS) was a cooperative
research effort involving eight universities to study soil liquefaction problems (Arulanandan and
Scott (1993) [32]). In that project, a series of dynamic centrifuge tests was performed on a variety of
different saturated soil models (Arulanandan and Scott (1993) [32]). In this section, we present the
simulation of the centrifuge model 2 of the VELACS project conducted at Rennselaer Polytechnic
Institute (RPI) by Taboada and Dobry (1998) [27] and numerically validated by Elgamal et al. (2002) [9].
In this test, the soil profile consisted of submerged 20 cm high (physical model) uniform Nevada sand,
of Dr = 40%–45%, inclined by 2◦ with respect to the horizontal (more details in Table 4). The experiment
was conducted at 50 g centrifugal acceleration. A sketch of the laminar box and the instrumentation is
shown in Figure 7. The lateral input shaking applied to the base of the model and its corresponding 5%
damped pseudo acceleration response spectra are shown in Figure 8.

                       Table 4. Characteristics of Nevada Sand (Taboada and Dobry (1998) [27]).

                                                     Property               Value
                                              Specific gravity               2.68
                                           Maximum dry density          17.33 kN/m3
                                           Minimum dry density          13.87 kN/m3
                                            Maximum void ratio              0.894
                                            Minimum void ratio              0.516
                                                    D50                   0.15 mm
                                           Hydraulic conductivity       0.0021 cm/s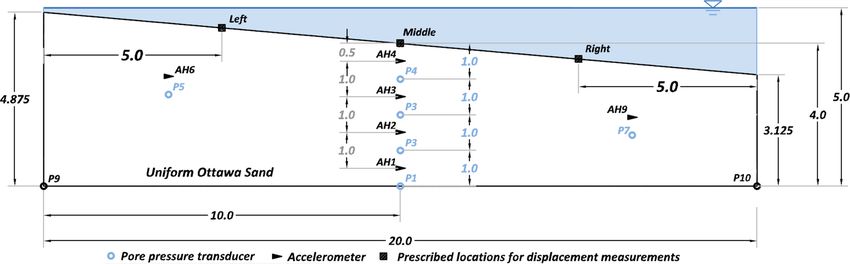
Maximum dry density 17.33 kN/m3
Minimum dry density 13.87 kN/m3
Maximum void ratio 0.894
Minimum void ratio 0.516
Appl. Sci. 2020, 10, 6503 D50 0.15 mm 8 of 21
Hydraulic conductivity 0.0021 cm/s
Appl. Sci. 2020, 10, x FOR PEER REVIEW 8 of 21
Figure
Figure7.7.Laminar
Laminarbox
boxcontainer
containerofofthe
theVerification
VerificationofofLiquefaction
LiquefactionAnalysis
Analysisby
byCentrifuge
CentrifugeStudies
Studies
(VELACS) model 2 centrifuge test (Elgamal et al. (2002) [9]).
(VELACS) model 2 centrifuge test (Elgamal et al. (2002) [9]).
(a) (b)
Figure
Figure8.8.(a)
(a)Lateral
Lateralacceleration
accelerationatatthe
thebase
baseofofthe
thelaminar
laminarboxboxofofVELACS
VELACSmodel
model2 2(Elgamal
(Elgamaletetal.al.
(2002)
(2002) [9]) (b) 5%-damped spectral acceleration at the base of the laminar box of VELACSmodel
[9]) (b) 5%-damped spectral acceleration at the base of the laminar box of VELACS model2.2.
Similarly,the
Similarly, theLiquefaction
LiquefactionExperiments
Experimentsand andAnalysis
AnalysisProjectProject(LEAP)
(LEAP)was wasaacooperative
cooperativeeffort
effort
amongseveral
among severaluniversities
universitiesand andresearch
researchinstitutes
institutestotoinvestigate
investigateliquefaction
liquefactionand andits itseffects
effectsonon
geostructures(Kutter
geostructures (Kutteretetal.al. (2018)
(2018)[33]).
[33]).The
Thedata
dataare
areavailable
availableononthetheNetwork
Networkfor forEarthquake
Earthquake
EngineeringSimulations
Engineering Simulations(NEES)
(NEES)websitewebsite(Carey
(Careyet etal.al.(2017)
(2017) [34]).
[34]). In section,
In this this section,
we showwe showthe
the simulation
simulation of theof the centrifuge
centrifuge LEAP LEAPprojectproject conducted
conducted at Rennselaer
at Rennselaer PolytechnicPolytechnic
Institute Institute (RPI)
(RPI) (Kutter
et(Kutter et al.[33]).
al. (2018) (2018)In[33]).
this In thisthe
test, test, thelayer
soil soil layer
was 4wasm 4high
m high at the
at the center
center of of
thethemodel
model(prototype
(prototype
dimension),
dimension),and andaauniform
uniformmediummediumdense densesand
sand(Ottawa
(OttawaF-65) F-65)was
wasused.
used. The
Thesoil
soilhad
hadaarelative
relative
density
densityofofDrDr==65%65%andandaa5° 5◦slope
slope(more
(moredetails
detailsininTable
Table5). 5).AAsketch
sketchofofthe
thelaminar
laminarbox boxandandthe
the
instrumentation
instrumentationthat that was
was used is shownshown in inFigure
Figure9.9.The
Thelateral
lateralinput
inputshaking
shaking (motion
(motion 2) 2) applied
applied to
to the
the base
base of the
of the model
model andand its corresponding
its corresponding 5% damped
5% damped pseudo pseudo acceleration
acceleration response
response spectra spectra are
are shown
shown in Figure
in Figure 10. 10.
Table 5. Index parameter of Ottawa F-65 Sand (Parra et al. (2017) [35]).
Property Value
Specific gravity 2.665
Maximum dry density 1736 kg/m3
Minimum dry density 1515 kg/m3
D10 0.133 mm
D50 0.173 mm
D60 0.215 mm
Hydraulic conductivity 0.016 cm/s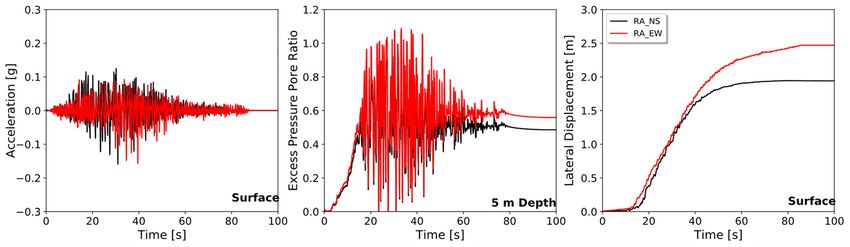
et al. (2018) [33]). In this test, the soil layer was 4 m high at the center of the model (prototype
dimension), and a uniform medium dense sand (Ottawa F-65) was used. The soil had a relative
density of Dr = 65% and a 5° slope (more details in Table 5). A sketch of the laminar box and the
instrumentation that was used is shown in Figure 9. The lateral input shaking (motion 2) applied to
theSci.
Appl. base of10,
2020, the6503
model and its corresponding 5% damped pseudo acceleration response spectra9are of 21
shown in Figure 10.
Table5.5.Index
Table Indexparameter
parameter of
of Ottawa
Ottawa F-65
F-65 Sand (Parra et
Sand (Parra et al.
al. (2017)
(2017)[35]).
[35]).
Property Property Value
Value
Specific gravity
Specific gravity 2.665
2.665
Maximum 3
Maximum dry densitydry density 1736 kg/m
1736 kg/m3
Minimum 3
Minimum dry densitydry density 1515 kg/m
1515 kg/m3
D10 0.133 mm
D10 0.133 mm
D50 0.173 mm
D50 D60 0.173
0.215 mmmm
D60Hydraulic conductivity 0.215
0.016 cm/smm
Hydraulic conductivity 0.016 cm/s
Figure 9. 9.Laminar boxbox
container of LEAP centrifuge test (C).test
All dimensions are in meters
are(Ziotopoulou
Appl. Sci. Figure Laminar
2020, 10, x FOR container
PEER REVIEW of LEAP centrifuge (C). All dimensions in meters9 of 21
(2018) [29]).
(Ziotopoulou (2018) [29]).
(a) (b)
Figure
Figure10.
10.(a)
(a)Lateral
Lateralacceleration
accelerationatatthethebase
baseofofthe
thelaminar
laminarbox
boxofofLEAP
LEAPconducted
conductedatatRensselaer
Rensselaer
Polytechnic
PolytechnicInstitute,
Institute,RPI
RPI(Kutter
(Kutteretetal.
al.(2018)
(2018)[33])
[33])(b)
(b)5%5%damped
dampedspectral
spectralacceleration
accelerationatatthe
thebase
baseofof
the
thelaminar
laminarbox
boxofofLEAP
LEAPconducted
conductedby byRPI.
RPI.
3.1.2. Model Input Parameters
3.1.2. Model Input Parameters
The multi-yield-surface plasticity constitutive model has 14 parameters that must be calibrated
The multi-yield-surface
to reproduce the liquefaction plasticity
phenomenonconstitutive
and the model has
lateral 14 parameters
spreading. Table that mustthe
3 shows be parameters
calibrated
towe used for Nevada sand (Dr = 40%) and Ottawa F65 sand (Dr = 65%). The calibration was realized
reproduce the liquefaction phenomenon and the lateral spreading. Table 3 shows the parameters
webyused
trial for
andNevada
error tosandobtain(Dra =good
40%)fit and
to Ottawa F65 sand
the measured (Dr = 65%).
response of theThe calibration
centrifuge was
tests. realized
Peak shear
by trial and error to obtain a good fit to the measured response of the centrifuge
strain, friction angle, and phase angle were estimated from the triaxial tests of VELACS (Arulmoli et al. tests. Peak shear
strain,
(1992)friction
[36]) and angle,
LEAP and phase
(Carey etangle were[34]).
al. (2017) estimated from the of
The coefficient triaxial
lateraltests of VELACS
pressure (Arulmoli
was estimated et
using
al. (1992)
Jaky’s [36]) and
relation (JakyLEAP
(1944)(Carey et al.shear
[37]). The (2017) [34]).
wave The coefficient
velocity of lateral
was estimated usingpressure wasby
correlations estimated
Seed and
using Jaky’s relation (Jaky (1944) [37]). The shear wave velocity was estimated using
Idriss (1970) [38]. Default values were used for the contraction, dilation, and liquefaction parameters correlations by
Seed
(c1 , cand Idriss (1970) [38]. Default values were used for the contraction, dilation, and liquefaction
2 , d1 , d2 , liq), and the number of yield surfaces (Elgamal et al. (2015) [26]). Finally, additional
parameters
Rayleigh-type (c1, damping
c2, d1, d2,was
liq),set
and the the
using number
modulusof yield surfaces
reduction (Elgamal
curves and theetdamping
al. (2015)curves
[26]). proposed
Finally,
additional Rayleigh-type
by Darandelli (2001) [39]. damping was set using the modulus reduction curves and the damping
curves proposed by Darandelli (2001) [39].
3.1.3. Comparison of Results
The modeling approach was verified by comparing various dynamic responses under
earthquakes loading using two experimental cases: M2-2 and RPI-02, from the VELACS and LEAP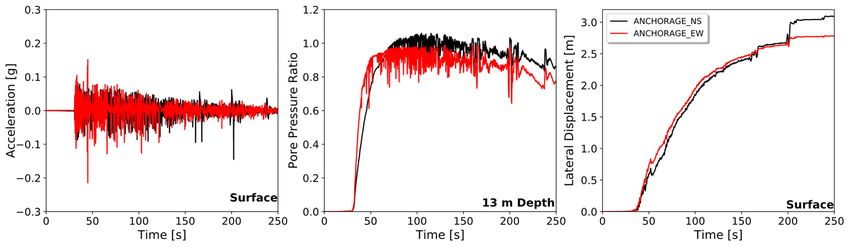
Appl. Sci. 2020, 10, 6503                                                                              10 of 21

3.1.3. Comparison of Results
       The modeling approach was verified by comparing various dynamic responses under earthquakes
loading using two experimental cases: M2-2 and RPI-02, from the VELACS and LEAP projects,
respectively. Figures 11–13 show the good fit between predicted and measured excess pore water
pressure (EPP), horizontal accelerations, and lateral displacements from these two tests. In the case
of RIP-02 lateral displacement, no measurements were made, so we used the numerical results of
Ziotopoulou
 Appl. Sci.
 Appl. Sci. 2020,  (2018)
            2020, 10,
                  10,    FOR[29],
                      xx FOR PEERCase
                             PEER     B, for comparison.
                                  REVIEW
                                  REVIEW                                                       10 of
                                                                                               10 of 21
                                                                                                     21

                            (a)                                                  (b)
      Figure 11.
      Figure  11. Numerical
                  Numerical versus
                            versus experimental
                                   experimental excess
                                                excess pore pressure in
                                                       pore pressure in (a)
                                                                        (a) M2-2
                                                                            M2-2 and
                                                                                 and (b)
                                                                                     (b) RPI-02
                                                                                         RPI-02 at
                                                                                                at two
                                                                                                    two
      differentdepths.
      different depths.

                                  (a)                                                  (b)
          Figure12.
          Figure 12. Numerical
                     Numerical versus
                               versusexperimental
                                      experimentalhorizontal
                                                  horizontalaccelerations
                                                             accelerationsin
                                                                           in(a)
                                                                              (a)M2-2
                                                                                 M2-2and
                                                                                      and(b)
                                                                                          (b)RPI-02.
                                                                                             RPI-02
Appl. Sci. 2020, 10, 6503
(a) (b) 11 of 21
Figure 12. Numerical versus experimental horizontal accelerations in (a) M2-2 and (b) RPI-02
(a)
Appl. Sci. 2020, 10, x FOR PEER REVIEW (b) 11 of 21
Figure
Figure 13. (a) Numerical
13. (a) Numerical and
and experimental
experimental lateral
lateral displacement
displacement atat the surface in M2-2, and (b)
numerical
numericaldisplacement
displacementin in
RPI-02 withwith
RPI-02 Cyclid1D simulation
Cyclid1D and Fast
simulation andLagrangian Analysis of
Fast Lagrangian Continua,
Analysis of
FLAC (Ziotopoulou
Continua, (2018) [29]).(2018) [29]).
FLAC (Ziotopoulou
Figure 14 shows the good fit between the predicted and the measured lateral displacements from
Figure 14 shows the good fit between the predicted and the measured lateral displacements from
centrifuge tests of Table 4.
centrifuge tests of Table 4.
Figure
Figure 14. 14. Estimated
Estimated versus versus measured
measured lateral displacements
lateral displacements usingfrom
using Cyclic1D Cyclic1D from
selected selected
centrifuge tests.
centrifuge tests.
3.2. Validation with Historical Cases
3.2. Validation with Historical Cases
Validation using field case histories is more challenging due to the inherent variability of soil
Validation using field case histories is more challenging due to the inherent variability of soil and
and earthquake properties. We simulated the response of two case-histories of lateral spreading
earthquake properties. We simulated the response of two case-histories of lateral spreading during
during large-magnitude subduction earthquakes: the Lo Rojas Port, in the 2010 Mw8.8 Maule Chile
large-magnitude subduction earthquakes: the Lo Rojas Port, in the 2010 Mw8.8 Maule Chile earthquake,
earthquake, and the Matanuska Bridge in the 1964 Mw 9.2 Alaska earthquake. As site effects are
and the Matanuska Bridge in the 1964 Mw 9.2 Alaska earthquake. As site effects are considered
considered explicitly in the numerical model approach, only strong motions recorded in rock stations
explicitly in the numerical model approach, only strong motions recorded in rock stations are adequate
are adequate for this study. For the Chile case, we used the records from the Rapel Station (34.0° S
for this study. For the Chile case, we used the records from the Rapel Station (34.0◦ S 71.6◦ W) from
71.6° W) from both horizontal components (PGANS = 0.20 g and PGAEW = 0.19 g), where PGA = Peak
both horizontal components (PGANS = 0.20 g and PGAEW = 0.19 g), where PGA = Peak Ground
Ground Acceleration. For the Alaska case, we used synthetic records estimated by Mavroeidis et al.
Acceleration. For the Alaska case, we used synthetic records estimated by Mavroeidis et al. (2008) [40]
(2008) [40] for the city of Anchorage in both horizontal components (PGANS = 0.25 g and PGAEW = 0.23
for the city of Anchorage in both horizontal components (PGANS = 0.25 g and PGAEW = 0.23 g).
g).
3.2.1. Description of Field Conditions
For the Lo Rojas site, there is reliable information on layer stratification, in situ testing, and
laboratory tests documented in De la Maza et al. (2017) [22] and Barrueto et al. (2017) [41]. Likewise,
the papers of Bartlett and Youd (1992) [42] and Gillins and Bartlett (2014) [19] show test field data
from the Matanuska site.
For the Lo Rojas site, the same modeling section selected by De la Maza et al. (2017) [22] wasAppl. Sci. 2020, 10, 6503 12 of 21
3.2.1. Description of Field Conditions
For the Lo Rojas site, there is reliable information on layer stratification, in situ testing,
and laboratory tests documented in De la Maza et al. (2017) [22] and Barrueto et al. (2017) [41].
Likewise, the papers of Bartlett and Youd (1992) [42] and Gillins and Bartlett (2014) [19] show test field
data from the Matanuska site.
For the Lo Rojas site, the same modeling section selected by De la Maza et al. (2017) [22] was
used for validation. This geotechnical model was developed according to the bathymetry and field test
information provided by the Ports Department of the Ministry of Public Works. According to Barrueto
et al. (2017) [41], the soil profile was composed of four soil units, from top to bottom: poorly graded
sand (~10 m thick), clayey sand (~9 m thick), high plasticity clay (~5 m thick), and low plasticity clay
(down to 70 m deep before a highly cemented soil). Several laboratory tests were conducted to obtain
the mechanical parameters for the soil layers: monotonic triaxial, cyclic triaxial, and column shear test
(details in De la Maza et al. (2017) [22] and Barrueto et al. (2017) [41]). Table 6 shows the calibrated
parameters used for the Lo Rojas model in this study. Using the pore water pressure-based criteria by
Wu et al. 2004 [43], the numerical results show that the upper poorly graded sand liquefied as the
excess pore pressure ratio (ru ) reached 1.0 after 20 seconds during the seismic event.
Table 6. Model parameters for the Lo Rojas site.
Unit [USCS] Depth [m] ρ [kN/m3 ] Vs [m/s] coeff k0 φ [◦ ] PT [◦ ] Su [kPa] K [m/s] NYS
SP 0–10 16 203 0.50 0.50 31.4 26.5 - 3.3 ×10⁻⁵ 25
SC 10–20 20 224 0.50 0.65 35 26.5 - 6.6 × 10⁻⁵ 20
CH 20–35 20 224 0 0.65 - - 75 1.0 × 10⁻⁷ 20
CL 35–70 21 254 0 0.65 - - 150 1.0 × 10⁻⁷ 20
For the Matanuska site, the modeling section was developed considering the boreholes taken at
the Railroad Bridge Mile Post near the Matanuska River (Bartlett and Youd (1992) [42]). According to
Gillins and Bartlett (2014) [19] the selected soil profile was composed, from top to bottom, of gravel
sand (~6 m thick), well-graded gravel (~2 m thick), poorly graded sand (~5 m thick), clayed sand (~9
m thick), and low plasticity clay (down to 70 m deep before a highly cemented soil). Table 7 shows the
parameters used in the Matanuska model. Figure 15 shows the soil geotechnical layout at both sites.
Table 7. Model parameters for the Matanuska site.
Unit [USCS] Depth [m] ρ [kN/m3 ] Vs [m/s] coeff k0 φ [◦ ] PT [◦ ] Su [kPa] K [m/s] NYS
SM 0–6 20 203 0.50 0.50 31.6 26.5 - 1.2 × 10⁻³ 20
GP 6–9 20 204 0.50 0.67 31.4 26.5 - 1.0 × 10⁻⁷ 20
SM 9–17 20 204 0.50 0.67 31.4 24 - 6.6 × 10⁻⁵ 20
SP 17–25 20 224 0.50 0.67 31.4 22 - 6.6 × 10⁻⁵ 20
CL 25–70 21 300 0 0.67 - - 75 1.0 × 10⁻⁹ 20
The Lo Rojas and the Matanuska sites have a stratigraphy of alluvial sediments characterized
by upper layers of liquefiable sands underlain by clay. For both sites, default values of Cyclid1D
were adopted for the contraction, dilation, and liquefaction parameters (c1, c2, d1, d2, liq), and the
number of yield surfaces (Elgamal et al. (2015) [26]). The coefficient of lateral pressure was estimated
using Jaky’s equation (Jaky (1944) [37]). Mass density was estimated from the Standard Penetration
Test (SPT) sounding from De la Maza et al. (2017) [22] for the Lo Rojas case, and the SPT sounding
from Gillins and Bartlett (2014) [19] for the Matanuska case. Shear wave velocities were obtained
from geophysical field tests from Barrueto et al. (2017) [41] for the Lo Rojas case, and using Mayne
(2007) [44] correlations for the Matanuska case. For the clays in the Lo Rojas site, peak shear strain,
friction angle, and undrained shear strength were obtained from the geotechnical model of De La
Maza et al. (2017) [22] and Barrueto et al. (2017) [41] which were based on monotonic and dynamicAppl. Sci. 2020, 10, x FOR PEER REVIEW 13 of 21
Appl. Sci. 2020, 10, 6503 13 of 21
triaxial tests. For the Matanuska site, we chose pre-defined Cyclic 1D values based on the information
from the2020,
Appl. Sci. boreholes documented
10, x FOR PEER REVIEWin Bartlett and Youd (1992) [42] and Gillins and Bartlett (2014) 13
[19].
of 21
(a) (b)
Figure 15. Soil layout at (a) the Lo Rojas site, and (b) the Matanuska site
3.2.2. Model Input Ground Motion
The 2010 Maule Mw8.8 earthquake caused extensive damage to ports and bridges (Bray et al.
(2012) [45] and Ledezma et al. (2012) [46]). Liquefaction-induced lateral spreading significantly
damaged the Lo Rojas fishermen port in Coronel, Bío-Bio Region. As De la Maza et al. (2017) [22]
(a) (b)
indicated, only strong motions recorded in rock stations are adequate for the numerical analyses. In
Figure 15. Soil layout at (a) the Lo Rojas site, and (b) the Matanuska site
this case, recordings Figure
in rock15. Soil layoutwere
stations at (a)obtained
the Lo Rojas site,RAP
at the and (b) the Matanuska
(Rapel), site
COV (Convento), and USM
(Santa Maria University). According to the USGS coseismic slip model (Pollitz et al. (2011) [47]), the
3.2.2.
3.2.2. Model Input Ground Motion Motion
3-D distance to the Rapel Station and the interplate fault is 31 km. That distance is very similar to the
one atThethe 2010
The 2010
Lo Maule
Maule
Rojas site,Mw8.8
whichearthquake
Mw8.8 is approximately caused32extensive
km. For thatdamage reason,to ports
De laand Maza bridges (Bray [22]
et al. (2017) et al.
(2012)
(2012) [45]
selected [45] and
and Ledezma
the Rapel Ledezma
(RAP) ground etetal. (2012)
(2012) [46]).
al.motion. [46]).
We Liquefaction-induced
the same criterion tolateral
Liquefaction-induced
used select spreading
the station significantly
spreading significantly
to simulate
damaged
damaged the
the Lo
Lo Rojas
Rojas fishermen
fishermen port
port in
in Coronel,
Coronel, Bío-Bio
Bío-Bio Region.
Region.
the lateral spreading in the Lo Rojas site in this study. Figure 16 shows the chosen record As De
De la
la Maza
Maza et
et al.
al. (2017)
(2017) [22]
[22]
(both
indicated,
indicated,only
directions) onlystrong
with astrong motions
motions
significant recorded
recorded
duration ofinapproximately
rock
in stations
rock stationsare adequate
34are
s andadequatefor the
a PGA for numerical
theg.numerical
of 0.2 analyses. In this
analyses. In
case,
thisTherecordings
case, recordings
1964 in rock
Alaska in
Mwstations
rock were obtained
9.2stations
earthquakewere caused at the
obtained RAP
at
ground the(Rapel),
RAP
failures COV
and (Convento),
(Rapel), COV (Convento),
collapsing and USM
structures and(Santa
USM
from
Maria
lateral University).
(Santaspreading, andAccording
Maria University). According
the associated to thetsunami
USGS
to coseismic
the USGS
caused slip 130
coseismic
about model
slip (Pollitz
model
deaths et al.and
(Pollitz
(Bartlett (2011)
et al.
Youd [47]),
(2011) the[2]).
[47]),
(1995) 3-D
the
distance
According toto
3-D distance the toRapel Station
the Rapel
Mavroeidis and
etStation
al. the
and
(2008) interplate fault isfault
the interplate
[40], no strong 31 km.
is 31That
motion km.distance is very
That distance
instruments were issimilar towhen
very similar
operative the oneto at
the
that
the
oneLoat Rojas
the Lo
destructive site,
Rojas
seismic which
site,iswhich
event approximately
occurred, 32direct
is approximately
so no km. For
32 that For
km. reason,
measurement that De la Maza
reason,
of near De
fieldet
la al.
Maza (2017)
ground [22]
et motions
al. selected
(2017) [22]
are
the Rapelthe
selected
available. (RAP)
Rapel ground
Consequently, (RAP)motion.
ground
we used We aused
motion. the
Wesame
simulated used criterion
the same
ground tocriterion
motion select
at the to station
select
Anchorage to simulate
the station tothe
site shared lateral
simulateby
spreading
the lateralin
Mavroeidis the
al. Lo
spreading
et Rojas
(2008) sitetoLo
in[40]
the inreproduce
this study.
Rojas Figure
sitethe this16study.
inlateral showsFigure
spreadingthe case.
chosen record17
16 Figure
shows (both
the directions)
chosen
shows therecord with
simulated(botha
significant
directions) duration
with a of approximately
significant duration 34
of s and a PGA
approximately of 0.2
34 sg. and
record (both directions) with a significant duration of approximately 152 s and a PGA of 0.25 g. a PGA of 0.2 g.
The 1964 Alaska Mw 9.2 earthquake caused ground failures and collapsing structures from
lateral spreading, and the associated tsunami caused about 130 deaths (Bartlett and Youd (1995) [2]).
According to Mavroeidis et al. (2008) [40], no strong motion instruments were operative when that
destructive seismic event occurred, so no direct measurement of near field ground motions are
available. Consequently, we used a simulated ground motion at the Anchorage site shared by
Mavroeidis et al. (2008) [40] to reproduce the lateral spreading case. Figure 17 shows the simulated
record (both directions) with a significant duration of approximately 152 s and a PGA of 0.25 g.
(a) (b)
Figure
Figure16.
16.(a)
(a)North-South
North-South(NS)
(NS)and
andEast-West
East-West(EW)
(EW)acceleration
accelerationtime
timehistories
historiesfor
forthe
theRapel
Rapelstation,
station,
(b)
(b)spectral
spectralacceleration
acceleration(5%
(5%damping)
damping)ofofthe
theNS
NSand
andEW
EWcomponents
componentsfor forthe
theRapel
Rapelstation.
station.
The 1964 Alaska Mw 9.2 earthquake caused ground failures and collapsing structures from
lateral spreading, and the associated tsunami caused about 130 deaths (Bartlett and Youd (1995) [2]).
(a) (b)
Figure 16. (a) North-South (NS) and East-West (EW) acceleration time histories for the Rapel station,
(b) spectral acceleration (5% damping) of the NS and EW components for the Rapel station.Appl. Sci. 2020, 10, 6503 14 of 21
Appl. Sci. 2020, 10, x FOR PEER REVIEW 14 of 21
According to Mavroeidis et al. (2008) [40], no strong motion instruments were operative when that
destructive seismic event occurred, so no direct measurement of near field ground motions are available.
Consequently, we used a simulated ground motion at the Anchorage site shared by Mavroeidis et al.
(2008) [40] to reproduce the lateral spreading case. Figure 17 shows the simulated record (both
directions)
Appl. Sci. 2020, with a significant
10, x FOR duration of approximately 152 s and a PGA of 0.25 g.
PEER REVIEW 14 of 21
(a) (b)
Figure 17. (a) Acceleration time-histories of the NS and EW components of the simulated ground
motion in Anchorage by Mavroeidis et al. (2008) [40] (b) spectral Acceleration (5% damping) of the
NS and EW components.
3.2.3. Simulation Results
(a) (b)
Tables 6 and 7 show the constitutive models’ parameters used for the numerical runs. They were
based on the
Figure
Figure 17.recommendations
17. (a)
(a)Acceleration by Elgamal of
Accelerationtime-histories
time-histories (2015)
ofthe [26]
theNSNSandandEW
and thecomponents
EW available
components geotechnical
ofofthe data of
thesimulated
simulated the sites
ground
ground
(Demotion
la Maza inet al. (2017)
Anchorage
motion in Anchorage by [22],
by Barrueto
Mavroeidis et al. (2017) [41], Bartlett and Youd (1992) [42] and
et al. (2008) [40] (b) spectral Acceleration (5% damping) of thethe
et al. (2008) [40] (b) spectral Acceleration (5% damping) Gillins
of and
NS
Bartlett
NSand (2014)
and
EWEW [19]). For
components.
components. each field site, horizontal motions in both directions were analyzed and
simulated. The average slope of the Lo Rojas site was based on the geotechnical model of the cross-
3.2.3.
3.2.3. Simulation
Simulation
section Results
by De la Results
Maza et al. (2017) [22]. In Matanuska’s case, Youd et al. (2002) [5] and Rauch (1997)
[48] reported
Tables66and the ground
and77show showtheslope of that location
theconstitutive
constitutive models’ in their database.
parameters usedfor
forthe
thenumerical
numericalruns.runs.They
Theywere
were
Tables models’ parameters used
based Figures
on the 18 and 19 show the
recommendations by numerical
Elgamal modeling
(2015) [26] results
and the of the historical
available geotechnicalcasesdata
in terms
of the of
sites
based on the recommendations by Elgamal (2015) [26] and the available geotechnical data of the sites
acceleration,
(DelalaMaza excess
Mazaetetal.al. pore
(2017) pressure
[22], ratio,
Barrueto and lateral
et (2017)
al. (2017) displacement time history. The results in Table 8
(De (2017) [22], Barrueto et al. [41],[41], Bartlett
Bartlett and Youd
and Youd (1992) (1992) [42]Gillins
[42] and and Gillins
and
demonstrate
and Bartlett the applicability of the proposed model. The simulated displacements were reasonably
Bartlett (2014)(2014)
[19]). [19]).
For eachFor field
each site,
fieldhorizontal
site, horizontal motions motions
in bothin directions
both directionswere were
analyzedanalyzed
and
closesimulated.
and to the measured The ones, with
average a maximum
slope of the Lo difference
Rojas site of about
was based30%.on the geotechnical model of the
simulated. The average slope of the Lo Rojas site was based on the geotechnical model of the cross-
cross-section
section by De la byMaza
De laetMaza et al. [22].
al. (2017) (2017) In [22]. In Matanuska’s
Matanuska’s case, case,etYoud
Youd et al.[5]
(2002)
and [5] and(1997)
Rauch
Table 8. Comparison of results for the historical fieldal. (2002)
cases. Rauch
(1997) [48] reported the ground slope of that
[48] reported the ground slope of that location in their database.location in their database.
Figures18
Figures 18 and19 Maximum
19 show Measured modeling
the numerical Maximum Simulated
results Measured/Simulated
of the historical cases in terms of
Historical and Case show the numerical modeling results of the historical cases in terms of
acceleration, excess pore Displacement
pressure ratio, and lateral Displacement
displacement
acceleration, excess pore pressure ratio, and lateral displacement time history. The results time history. Ratio
The resultsininTable
Table88
demonstrate Lo Rojas
the applicability of 2.85
the m
proposed model. The 2.44
simulated
demonstrate the applicability of the proposed model. The simulated displacements were reasonably displacements 1.20were reasonably
Matanuska
closetotothe
themeasured
measuredones, with2.50
ones,with m of3.10 1.30
close aamaximum
maximum differenceof
difference about30%.
about 30%.
Table 8. Comparison of results for the historical field cases.
Maximum Measured Maximum Simulated Measured/Simulated
Historical Case
Displacement Displacement Ratio
Lo Rojas 2.85 m 2.44 1.20
Matanuska 2.50 m 3.10 1.30
(a) (b) (c)
Figure 18.
Figure 18. Numerical
Numericalmodeling
modeling results using
results bothboth
using horizontal motions
horizontal from from
motions the Rapel station.station.
the Rapel (a)
horizontal
(a) acceleration
horizontal at theatsurface,
acceleration (b) excess
the surface, pressure
(b) excess pore ratio
pressure poreat ratio
a 5 matdepth,
a 5 mand (c) lateral
depth, and (c)
displacement at the surface.
lateral displacement at the surface.
(a) (b) (c)
Figure 18. Numerical modeling results using both horizontal motions from the Rapel station. (a)
horizontal acceleration at the surface, (b) excess pressure pore ratio at a 5 m depth, and (c) lateral
displacement at the surface.You can also read