Online Footsteps to Purchase: Exploring Consumer Behaviors on Online Shopping Sites

Page created by Don Harris
 
CONTINUE READING
Online Footsteps to Purchase: Exploring Consumer Behaviors on Online Shopping Sites
Online Footsteps to Purchase:
  Exploring Consumer Behaviors on Online Shopping Sites
                        Munyoung Lee                                               Taehoon Ha                         Jinyoung Han
                 Dept. of Computer Science                              Dept. of Computer Science                 Dept. of Electrical and
                      and Engineering                                        and Engineering                      Computer Engineering
                  Seoul National University                              Seoul National University             University of California, Davis
              mylee@mmlab.snu.ac.kr thha@mmlab.snu.ac.kr    rghan@ucdavis.edu
                            Jong-Youn Rha      Ted “Taekyoung” Kwon
                                            Dept. of Consumer Science                         Dept. of Computer Science
                                             Seoul National University                             and Engineering
                                                    jrha@snu.ac.kr                             Seoul National University
                                                                                                   tkkwon@snu.ac.kr

ABSTRACT                                                                                      Keywords
As an important part of the Internet economy, online mar-                                     Online Markets, E-commerce, Internet Economy, Consumer
kets have gained much interest in research community as                                       Behaviors, Behavior Trajectory, Purchase Prediction
well as industry. Researchers have studied various aspects
of online markets including motivations of consumer behav-
iors on online markets. However, due to the lack of log data                                  1.    INTRODUCTION
of consumers’ online behaviors including their purchase, it                                      Online markets have played an important role in the fast
has not been thoroughly investigated or validated on what                                     growth of the Internet economy over the last decade. With-
drives consumers to purchase products on online markets.                                      out any temporal or spatial constraints, people can purchase
Our research moves forward from prior studies by analyz-                                      a variety of items from online markets anytime and any-
ing consumers’ actual online behaviors that lead to actual                                    where. It is expected that total sales of online markets in
purchases, and using datasets from multiple online shopping                                   the USA will be over 370 billion dollars by 2017 [16].
sites that can provide comparisons across different types of                                      The huge popularity of online markets has attracted the
online shopping sites. We analyzed consumers’ buying pro-                                     research community to investigate various aspects of online
cess and constructed consumers’ behavior trajectory to gain                                   markets including motivations of online shoppers [20, 12],
deeper understanding of consumer behaviors on online mar-                                     consumer behaviors [4, 13, 7, 2, 15], and usage patterns of
kets. We find that a substantial portion (24%) of consumers                                    various online shopping sites [3, 10]. However, due to the
in a general-purpose marketplace (like eBay) discover items                                   lack of log data of consumers’ online behaviors including
from external sources (e.g., price comparison sites), while                                   their purchase, it has not been thoroughly investigated or
most (>95%) of consumers in a special-purpose shopping                                        validated on what drives consumers to purchase products
site directly access items from the site itself. We also re-                                  on online markets.
veal that item browsing patterns and cart usage patterns                                         This paper moves forward from prior studies by (i) ana-
are the important predictors of the actual purchases. Using                                   lyzing consumers’ actual online behaviors that lead to ac-
behavioral features identified by our analysis, we developed                                   tual purchases, and (ii) using datasets from multiple online
a prediction model to infer whether a consumer purchases                                      shopping sites that can provide comparisons across differ-
item(s). Our prediction model of purchases achieved over                                      ent types of online shopping sites. We believe that tracking
80% accuracy across four different online shopping sites.                                      and analyzing the consumers behaviors on online shopping
                                                                                              sites can lead to predict consumers’ actual purchases. Such
Categories and Subject Descriptors                                                            predictions would allow for business practitioners to deliver
                                                                                              more customized interaction with their customers in order
J.4 [Computer Applications]: Social and Behavioral Sci-                                       to increase the likelihood of purchases on the site. Such ef-
ences
                                                                                              forts in turn would be beneficial for consumers by making
General Terms                                                                                 the decision process more convenient and satisfactory.
                                                                                                 In this paper, we strive to shed light on such issues by
Measurement, Human Factors                                                                    understanding the factors relevant to predicting consumers’
                                                                                              actual purchases. In particular, we seek answers to the fol-
Permission to make digital or hard copies of all or part of this work for personal or
classroom use is granted without fee provided that copies are not made or distributed
                                                                                              lowing questions: How do consumers actually browse items
for profit or commercial advantage and that copies bear this notice and the full cita-        and make purchases on online markets? What are the simi-
tion on the first page. Copyrights for components of this work owned by others than           larities and differences in the browsing and purchase behav-
ACM must be honored. Abstracting with credit is permitted. To copy otherwise, or re-          iors depending on the characteristics of the online shopping
publish, to post on servers or to redistribute to lists, requires prior specific permission   sites such as price range and items sold? What are the dis-
and/or a fee. Request permissions from Permissions@acm.org.
                                                                                              tinct behavioral patterns of online consumers who actually
WebSci’15, June 28–July 01, 2015, Oxford, United Kingdom.
Copyright 2015 ACM 978-1-4503-3672-7/15/06 ...$15.00.
                                                                                              purchase items? Can we predict whether a consumer will
http://dx.doi.org/10.1145/2786451.2786456.                                                    make a purchase for an item or not?
To address the questions, we analyze the massive log data       which is a key to designing product recommendations or
obtained from four popular online shopping sites that col-         marketing strategies. Bayus [1] proposed a model to pre-
lectively contain more than 100 million consumer activity          dict sales of hardware and software. They applied the pro-
entries. We construct each customer’s behavior trajectory          posed model to the compact disc (CD) market to forecast
for each item by keeping track of the HTTP messages of             future sales of CD players (hardware) and CDs (software).
around 0.7 million consumers on four online shopping sites         Thiesing and Vornberger [21] proposed a model based on
from March 1st to March 24th, 2014.                                neural networks with a back propagation algorithm to fore-
   We highlight the key contributions of this paper as follows:    cast the future values of time series that consist of weekly
                                                                   demands of items in a supermarket. Park et al. [17] analyzed
  1. Comparisons on different types of online shop-
                                                                   the multi-category customer base and proposed a model to
     ping sites: In this paper, we analyze and compare
                                                                   predict the purchase time interval for each consumer, which
     four online shopping sites in South Korea including one
                                                                   was applied to a dataset that contains transaction histories
     general-purpose marketplace (like eBay), where mul-
                                                                   of 2,870 customers who purchased beauty care products at
     tiple retailers sell a variety of items, and three special-
                                                                   department stores.
     purpose shopping sites for clothes, home decoration,
                                                                      Recently, as online markets have become crucial in the
     and sports items (like Brooks Brothers, IKEA, and
                                                                   Internet economy, many researchers have investigated con-
     NIKE, respectively). Our results show that there is
                                                                   sumer behaviors on online markets [20, 12, 4, 13, 7, 2, 15].
     a notable difference in how consumers access items.
                                                                   Rohm and Swaminathanss [20] investigated the motivation
     We find that a substantial portion (24%) of consumers
                                                                   behind consumers who visit online markets, and showed that
     in the general-purpose site discover items from exter-
                                                                   convenience of information seeking is their major motiva-
     nal sources such as search engines, while most (>95%)
                                                                   tions. Kau et al. [12] classified 3,700 consumers into six
     of consumers in the special-purpose sites directly ac-
                                                                   groups based on their motivations in visiting online mar-
     cess items from the sites themselves (e.g., browsing sub
                                                                   kets, and examined characteristics of consumers in the six
     menu). Such difference implies that the promotional
                                                                   groups. Close and Kukar-Kinney examined cart usage pat-
     touch points for different shopping sites should be dif-
                                                                   terns of consumers on online markets [4, 13], and showed
     ferent depending on the nature of the site.
                                                                   that consumers usually put items in their virtual carts be-
  2. Consumer behavior trajectories: We keep track of              cause of (i) price promotion events, (ii) personal organiz-
     the behavior trajectory of each consumer, which con-          ing purposes as a wish list, or (iii) information seeking pur-
     sists of accessing an item, browsing its pages, putting       poses. They further showed that online cart usage leads to
     the item in her cart, and finally making a purchase.           increase consumers’ purchase probabilities. Some studies [7,
     Our result shows that item browsing and cart usage be-        2, 15] paid attention to “clickstream” data to investigate con-
     haviors are strongly related to actual purchases. Our         sumers’ purchases. However, the dataset was limited to one
     behavior trajectory model reveals that if a consumer          single site and a small number of consumers are examined
     accesses an item from an external source, browses the         in their work, which makes it difficult to generalize their
     web page of the item at least three times, and places         findings. This paper analyzes (per-item) behavior trajec-
     the item into the cart, then the probability of pur-          tories of individual consumers on four online markets with
     chases ranges from 58% to 88% across the four shop-           large-scale data that collectively contains around 1.9 million
     ping sites, which provides an important implication for       items accessed by around 0.7 million consumers. We further
     online market stakeholders.                                   build a learning-base model to forecast whether a consumer
                                                                   will purchase items, which gives an important implication in
  3. Predicting purchases of consumers: Leveraging                 resource allocation of online market stakeholders, e.g., tar-
     the implications of our findings, we develop a predic-         geted marketing.
     tion model whether a consumer will purchase an item.             Some studies have investigated what information (e.g.,
     We show that consumers’ behavior features (e.g., item         item properties or social relationships) can be used to pre-
     viewcount or cart usage) are more important predic-           dict item purchasing on online markets. Wu and Bolivar [23]
     tors of their purchases than item features (e.g., price       examined whether properties of items or seller information
     or popularity). Our proposed model for predicting the         can be good predictors for future item purchasing. Zhang et
     actual purchase of consumers achieved over 80% accu-          al. [24, 25] showed that user’s profile information extracted
     racy across the four shopping sites.                          from social media can be used to predict the user’s prefer-
  The rest of this paper is organized as follows. After re-        ences on categories or product brands. Guo et al. [9] ana-
viewing the related work in Section 2, we explain the mea-         lyzed a social commerce site “Taobao”, and showed that buy-
surement methodology and datasets in Section 3. We then            ers are likely to select the sellers from which their friends al-
show how consumer behaviors differ depending on the shop-           ready have bought. Interestingly, similar observations were
ping sites in Section 4. In Section 5, we explore each con-        also found in offline markets [6, 8]. While these studies have
sumer’s behavior trajectory, and examine what consumer             showed how the external information (e.g., information in
activities in the trajectory lead to actual purchases. From        external social media) affect purchases, we investigate how
our analyses, we build and evaluate a prediction model of          on-site consumer behaviors lead to actual purchases.
purchases in Section 6. Finally, we conclude the paper in             More recently, there have been some studies to investigate
Section 7.                                                         the characteristics of new types of recent online markets.
                                                                   Christin [3] performed a measurement study on Silk Road,
2. RELATED WORK                                                    an anonymous online market. The authors examined how
                                                                   anonymous sellers sell products on Silk Road. Based on the
  There have been great efforts in predicting future sales or
                                                                   lessons learned, they further estimated the total revenue of
product demands in traditional offline markets [1, 21, 17],
Table 1: Information of four online markets is summarized (collected from Mar. 1st to Mar. 24th, 2014).
        site     category     # logs # consumers total sales  browsing count  purchasing count # items
         S1       general      79 M     564,786      $59.9 M    9,069,290        2,071,134     1,808,893
         S2       clothes      16 M      64,467      $15.5 M    3,799,471         147,885       50,492
         S3 home decoration    5M        45,271       $6.9 M     826,804          111,761       23,988
         S4       sports       3M        17,229       $2.3 M     264,660           26,911        1,681

the anonymous online market. Hannak et al. [10] investi-             and each consumer’s behavior trajectory is constructed for
gated how online markets provide different personalization            each item.
services to their consumers, and revealed that there are price
discrimination (i.e., customizing different prices for different       3.2    Datasets
consumers) and price steering (i.e., manipulating products              The first dataset for the four online shopping sites (S1,
to be displayed for different consumers) on online markets.           S2, S3, and S4) containing the web access histories of all
We analyze the on-site consumer behaviors across different            the consumers had been collected from Mar. 1st to Mar.
types of online markets, and investigate whether consumers           24th, 2014. The numbers of HTTP request logs for S1,
in those markets show different transaction activities.               S2, S3, and S4 are 79,375,439, 16,836,901, 5,062,218, and
                                                                     3,348,474, respectively. Table 1 summarizes the information
3. METHODOLOGY                                                       of the four sites. S1 is a general-purpose marketplace (like
                                                                     eBay) while the other three sites are special-purpose shop-
  In this section, we illustrate our methodology for data
                                                                     ping sites. S1 is one of the largest e-commerce platform op-
collection from the four sites. We also describe the datasets
                                                                     erators in South Korea, where multiple retailers sell a wide
used in this paper.
                                                                     variety of items; there are 58 item categories in S1. The
                                                                     number of consumers2 in S1 is 10,208,331. Among these
                                                                     consumers, the number of consumers who have purchased
                                                                     at least one item during our measurement, called effective
                                                                     consumers, is 564,786. The ratio of the effective consumers
                                                                     to all of the consumers (shortly, effective ratio) in S1 is thus
                                                                     5.5%. The total sales of S1 reach around 59.9 million US
                                                                     dollars3 in our dataset. S2 is a popular online shopping site
                                                                     that sells clothing goods (like Brooks Brothers). The num-
                                                                     bers of all the consumers and effective consumers in S2 are
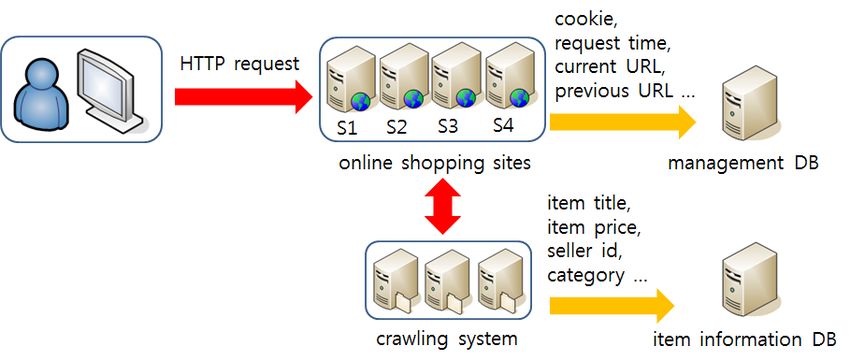
Figure 1: A data collection process for the online                   913,951 and 64,467, respectively, and thus its effective ratio
shopping sites is illustrated.                                       is 7.1%. The total sales of S2 is about 15.5 million dollars.
                                                                     S3 is also a popular online store that provides home deco-
3.1 Data Collection                                                  ration items such as kitchenware and furniture (like IKEA).
   We conduct a measurement study on consumer behaviors              The numbers of all the consumers and effective consumers
on the four online shopping sites: S1, S2, S3, and S41 .             in S3 are 521,098 and 45,271, respectively. The effective
Figure 1 illustrates a data collection process for the online        ratio of S3 is 8.7% and the total sales of S3 reach around
shopping sites.                                                      6.9 million dollars. S4 is an online shopping site that sells
   There are two datasets. The first dataset was collected by         sports items such as shoes and sportswear (like NIKE ). The
a third party company that manages the site-based web ac-            numbers of all the consumers and effective consumers in S4
cess history. If a consumer visits a web page on a site, a col-      are 580,516 and 17,229, respectively. The effective ratio of
lection module in the page collects the HTTP request infor-          S4 is 3.0%, and its total sales is about 2.3 million dollars.
mation such as IP address, cookie, URL address, and request          Note that we take into account effective consumers since we
time from the consumer’s browser. All the collected data of          characterize the purchasing behaviors of consumers in our
consumer’s web access history is stored in the management            analysis. The numbers of collected item information from
database (the first dataset). To further collect the detailed         S1, S2, S3, and S4 are 1,808,893, 50,492, 23,988, and 1,681,
information of items (e.g., title, price, seller, or category), we   respectively. Some item pages were not collected because
developed our crawling software for the second dataset. The          sellers have deleted the corresponding web pages, which were
collected information of the corresponding items is stored in        not considered in our analysis.
the item information database (the second dataset). Using
the two datasets, we examine the (per-item) behavior tra-
jectory of each consumer on the sites. For example, suppose          4.    ONLINE SHOPPING SITES
that a consumer visits the web pages for item1, item2, and              In this section, we examine the characteristics of the four
item3 in a sequential order, and places item1 into a shopping        sites (S1, S2, S3, and S4) in terms of their item proper-
cart after revisiting the page of item1. Then, her behavior          ties (e.g., popularity and price range) and on-site consumer
trajectory (i.e., a sequence of activities) for item1 consists       behaviors (e.g., visiting time, referral source of item access,
of 3 parts: 1st browsing, 2nd browsing, and 1st cart usage.          and transaction activity).
Note that each consumer is identified by cookie information,          2
                                                                       It means the number of consumers whose visits are mea-
1                                                                    sured in our dataset, not the registered consumers of sites
 Upon requests from the dataset provider (i.e., a third party
company), we make anonymized the names of the four online            S1-S4.
                                                                     3
shopping sites: S1, S2, S3, and S4.                                    Note that 1 USD is about 1,000 KRW.
1.00                                                          1.00                                                                               S1                         S2                                                  S1                         S2
                                                                                                                                        0.08                                                                           0.08
                                                                                                                                        0.06                                                                           0.06
       0.75                                                          0.75

                                                                                                                                                                                                  Purchases(portion)
                                                                                                                                        0.04                                                                           0.04

                                                                                                                     Browses(portion)
                                                                                                                                        0.02                                                                           0.02
 CDF

                                                               CDF
       0.50                                                          0.50                                                               0.00                                                                           0.00
                                                                                                                                                        S3                         S4                                                  S3                         S4
                                             S1                                                                S1                       0.08                                                                           0.08
                                             S2                                                                S2                       0.06
       0.25                                                          0.25                                                                                                                                              0.06
                                             S3                                                                S3                       0.04                                                                           0.04
                                             S4                                                                S4
                                                                                                                                        0.02                                                                           0.02
       0.00                                                          0.00
                                                                                                                                        0.00                                                                           0.00
              10                1000                                                10                  1000                                   0   5   10    15   20     0    5   10    15   20                               0   5   10    15   20     0    5   10    15   20
               Browsing Count                                                        Purchasing Count                                                                  Hour                                                                           Hour

 (a) CDF of                     browsing                   (b) CDF of purchasing                                     (a) Distribution of total                                                    (b) Distribution of total
 counts of items                                           counts of items                                           browsing counts of each                                                      purchasing counts of each
                                                                                                                     site is plotted at one hour                                                  site is plotted at one hour
Figure 2: Distributions of browsing counts and pur-                                                                  intervals.                                                                   intervals.
chasing counts of items show that online behaviors
are different depending on the shopping sites.                                                                       Figure 4: Temporal changes in browsing and pur-
                                                                                                                    chasing counts on online markets are shown, which
                                                                                                                    is somewhat bi-modal.
4.1 Item Properties by Sites
   We analyze two representative consumer behaviors for                                                             4.1.2                              Item Price
items with different properties (e.g., popularity and price)
                                                                                                                       We next analyze the distribution of item prices on the four
on the shopping sites: browsing behaviors (i.e., browsing
                                                                                                                    sites S1-S4; in particular, we separately plot the prices of
item pages) and purchasing behaviors.
                                                                                                                    browsed items, and the prices of (actually) purchased items.
                                                                                                                    Figure 3 shows the distributions of prices of the browsed and
4.1.1 Item Popularity
                                                                                                                    purchased items on the four sites. We find there is a dis-
   We first examine the item popularity of the four sites                                                            crepancy between the prices of the browsed and purchased
by counting how many times an item is browsed by all                                                                items. For example, the median price of the browsed items
consumers (shortly, browsing count) and how many times                                                              in site S1 is $19.9, whereas that of the purchased items is
an item is purchased (shortly, purchasing count) for each                                                           $9.9. The median prices of browsed items in sites S2-S4 are
item. Figure 2(a) plots the cumulative distribution func-                                                           $99.5, $35.9, and $89 respectively, while those of purchased
tion (CDF) of browsing counts of items on the four sites.                                                           items are $70, $19.9, and $85, respectively. The median
As shown in Figure 2(a), only a small number of items are                                                           prices of purchased items of sites indicate relatively inex-
browsed more than 1,000 times by consumers, which indi-                                                             pensive items are popularly purchased in site S1, compared
cates the high skewness of item popularity. Among the four                                                          with other sites. Obviously, the price distribution of the
sites, site S1 exhibits the highest skewness. In site S1, 90%                                                       purchased items is located to the left (i.e., lower prices) in
of items are browsed less than 8 times, whereas the most                                                            Figure 3 compared with that of the browsed items, which
popular item is browsed 11,177 times. Likewise, 90% of                                                              signifies a price gap between the browsed items and the pur-
items in sites S2, S3, S4 are browsed less than 184, 59, and                                                        chased items. The price gap can be explained as follows:
363 times respectively. The median browsing counts in sites                                                         a consumer first browses relevant items, and she tends to
S1, S2, S3, and S4 are 1, 19, 5, and 84, respectively.                                                              purchase one with relatively low price among the browsed
   Figure 2(b) shows the distribution of the purchasing counts                                                      ones. Also, some consumers who browse online shopping
of items across the four sites. When we look at Figures 2(a)                                                        sites merely for obtaining the product information or for en-
and 2(b), the purchasing counts are much smaller than the                                                           tertainment [20] can help increase the price gap since such
browsing counts, which implies that online consumers tend                                                           consumers usually browse a variety of items including expen-
to purchase items selectively. 90% of items in sites S1-S4                                                          sive items without purchasing intentions. Finally, the price
are purchased less than 1, 6, 5, and 30 times, respectively.                                                        gap shows the empirical manifestation of the price lining
To sum up, Figures 2(a) and 2(b) show that a small por-                                                             strategy [14] of sellers. Sellers separate items (of the same
tion of items account for most of browsing and purchasing                                                           type) into different levels of quality with different prices
activities across the four sites.                                                                                   to help consumers decide purchases, which usually leads to
                                       S1                                    S2                                     price comparison.
                         1.00

                         0.75

                         0.50
                                                                                                                    4.2                            On-site Consumer Behaviors
                         0.25
                                                                                                                       We next focus on the consumer behaviors on four online
                         0.00
                                                                                                                    shopping sites, in terms of consumers’ visiting times, sources
                   CDF

                         1.00
                                       S3                                    S4
                                                                                                                    of item accesses, and transaction activities.
                         0.75

                         0.50
                                                                                                                    4.2.1                              Visiting Online Shopping Sites
                         0.25                                                      Purchased
                                                                                   Browsed
                                                                                                                       We first examine the visiting times of consumers across the
                         0.00                                                                                       four sites by analyzing all the consumers’ browsing and pur-
                                100    200        300    400           100   200    300        400
                                                    Item Price(USD)                                                 chasing behaviors. Figure 4(a) shows the distribution of the
                                                                                                                    sum of browsing counts over all the items with one-hour time
Figure 3: Distributions of the prices of browsed and
                                                                                                                    interval in each site. Note that 5 AM indicates the period
purchased items are shown. Interestingly, site S4
                                                                                                                    between 05:00 AM and 05:59 AM. As shown in Figure 4(a),
shows the smallest difference between the two dis-
                                                                                                                    in all the sites, most of consumers’ browsing behaviors occur
tributions.
                                                                                                                    during 10 AM - 3 PM and during 8 PM - 0 AM. However,
100                                                 100                                                                  S1                     S2                1.00
                                                                                                                       1.00
              75                                                  75                                                   0.75
 Percentage

                                                     Percentage
                                                                                                                       0.50                                                     0.75
              50                                                  50                                                   0.25

                                                                                                                                                                          CDF
                                                                                                                       0.00

                                                                                                                 CDF
                                                                                                                                                                                0.50
              25                                                  25                                                                   S3                     S4
                                                                                                                       1.00                                                                                    S1

                                                                                                                       0.75                                                                                    S2
               0                                                   0                                                                                                            0.25
                                                                                                                       0.50                                                                                    S3
                    S1   S2          S3         S4                      S1     S2            S3            S4                                                 Purchased
                              Site                                                    Site                             0.25                                                                                    S4
                                                                                                                                                              Browsed
                                                                                                                       0.00                                                     0.00
                         Inside      External                                Search      Ads      Social                      0   20   40    60    0   20     40   60                  250     500       750        1000
                                                                                                                                            Number of items                             Total Expense(USD)

 (a) Whether an item is ac-                          (b) External sources are                                    (a) Numbers of browsed                                   (b) Total expenses for pur-
 cessed from an external                             classified.                                                  items and purchased items                                chased items per consumer
 source or within the site.                                                                                      per consumer are plotted.                                are shown.
Figure 5: Whether customers access items from ex-                                                               Figure 6: Consumers’ transaction activities on the
ternal sites or from the sites themselves is plotted.                                                           four sites are shown, which indicates the price ranges
Also the classification of external sources is shown                                                             of items affect the expenses.
for the former case.
the four sites show somewhat different temporal changes.                                                         most of the consumers who have preferences for sites S2-S4
For example, the numbers of visits for browsing in sites S1,                                                    visit the sites to browse the items in specialized categories.
S2, and S3 increase from 5 AM to 11 AM and then decrease                                                        Notice that such difference between general-purpose mar-
until 7 PM. After that, the number of consumer’s visits for                                                     ketplace and special-purpose shopping site implies that the
browsing items increases until midnight. On the other hand,                                                     promotional touch points for different shopping sites should
the number of visits for browsing in site S4 increases from                                                     be different depending on the nature of the site.
5 AM to 11 PM. The peak times of the sites S1-S4 are 11                                                            Figure 5(b) classifies the external sources. Across the four
AM, 10 AM, 11 PM, 10 PM, respectively.                                                                          sites, search engines for price comparison are a major source
   Figure 4(b) shows the distribution of the sum of purchas-                                                    to access the items. The portions of search engines in sites
ing counts over all the items at one-hour intervals in each                                                     S1-S4 are 88.6%, 56.2%, 71.8%, and 80.8%, respectively.
site. Notice that the temporal patterns of purchasing times                                                     Advertisements (like banners) are the second major source,
are similar to those of browsing ones across the four sites.                                                    and the portions of advertisement in sites S1-S4 are 7.4%,
For example, the numbers of visits for purchasing in sites S1,                                                  30.6%, 24.0%, and 17.5% respectively. Also, 3.9%, 13.3%,
S2, and S3 increase from the morning (5 AM) and show the                                                        4.0%, and 1.6% of consumers in sites S1-S4 discover the
peak times around noon. After the peak times, the numbers                                                       item information from social communities for product re-
of visits for purchasing decrease until evening (7 PM) and                                                      views (e.g., engadget.com).
gradually increase until midnight. On the other hand, the
number of visits for purchasing in site S4 increases from the
morning (6 AM) until midnight and shows the peak time at                                                        4.2.3              Transaction Activities
midnight. The peak times of sites S1 and S2 are close to                                                           We also investigate how many items are browsed and pur-
noon, while those of S3 and S4 are close to midnight, which                                                     chased by individual consumers for 24 days. Figure 6(a)
indicates a discrepancy.                                                                                        plots the distributions of numbers of browsed and purchased
                                                                                                                items. The medians of numbers of browsed and purchased
4.2.2 Sources of Item Accesses                                                                                  items per consumer are 9 and 3, respectively, in site S1.
   We next investigate how consumers come to access items,                                                      Similarly, the medians of numbers of browsed items (and
i.e., whether they visit item pages from external sites (as                                                     purchased items) in sites S2, S3, and S4 are 25, 11, and
referral sources), or start from the sites themselves. To                                                       9, (and 1, 2, and 1), respectively. Note that the consumers
this end, we examine consumers’ previous URL addresses                                                          who visit the site S2 usually browse substantially more items
when they visit the site for the first time. As shown in                                                         compared with the other sites, whereas the consumers who
Figure 5(a), most of consumers visit item pages from the                                                        visit the site S1 purchase more items since they may usu-
online shopping sites themselves (e.g., searching within the                                                    ally have specific products in mind already. The maximum
sites or browsing sub menus). Interestingly, there are signif-                                                  numbers of purchased items per consumer in sites S1-S4 are
icant differences between the general-purpose marketplace                                                        140, 235, 25, and 61, respectively.
S1 (like eBay) and the other special-purpose shopping sites.                                                       Figure 6(b) shows the total expenses per consumer (for
In site S1, a substantial portion (24%) of item pages are                                                       her purchased items) over the 24 days. The median values
visited by consumers from external sites, while only 1-5% of                                                    in sites S1-S4 are $47.5, $152, $69.7, and $109, respectively,
items in sites S2-S4 are referred to from external sites. This                                                  while top 10% of consumers spend more than $201, $517,
phenomenon can be due to the different characteristics of                                                        $361, and $231, respectively. The consumers who visit site
different sites. Since site S1 is a general e-commerce plat-                                                     S1 are likely to spend less than those who visit the other
form operator that offers a wide variety of products, many                                                       sites, but purchase more items partly because site S1 deals
consumers just enter the site S1 from the external sites like                                                   with various and mostly inexpensive goods. Notice that con-
search engines, although they have no preference for the site                                                   sumers in sites S2 and S4 spend more although they pur-
S1. It has been reported that consumers are rarely loyal to a                                                   chase less items than those in site S1. This indicates that
particular online shopping site when they search for a partic-                                                  the total expenses of consumers on a site is strongly linked
ular product [7]. On the other hand, special-purpose shop-                                                      to the price range of items on that site. Note that the me-
ping sites S2-S4 offer items in specialized categories (i.e.,                                                    dian price of a purchased item in site S1 is $9.9, while the
clothes, home decoration, and sports, respectively). Thus,                                                      ones in sites S2-S4 are $70, $19.9, and $85, respectively.
S1                              S2                                                        S1                        S2                                                              S1                                   S2
                                                                                                                                                                                                                    0.8
                                                                                                                         7.5         Median
                            0.4                                                                                                                                                                                     0.6
                                                                                                                                     Average
 The Portion of Consumers

                                                                                                                         5.0                                                                                        0.4

                                                                                                                                                                                             Purchase Probability
                            0.2
                                                                                                                         2.5                                                                                        0.2

                                                                                                             Viewcount
                            0.0                                                                                          0.0                                                                                        0.0
                                                    S3                              S4                                                        S3                        S4                                                              S3                                   S4
                                                                                                                                                                                                                    0.8
                                                                                                                         7.5
                            0.4                                                                                                                                                                                     0.6

                                                                                                                         5.0                                                                                        0.4
                            0.2
                                                                                                                         2.5                                                                                        0.2

                            0.0                                                                                          0.0                                                                                        0.0
                                  0             5        10       0          5             10                                  0    250     500    750   1000
                                                                                                                                                           0      250   500    750   1000                                 0   10   20        30   40     50 0      10   20        30   40   50
                                                              Viewcount                                                                            Item Price(USD)                                                                                     Viewcount

Figure 7: Distribution of view-                                                                              Figure 8:  Distribution of the                                                 Figure 9:       The probability
counts (for items) of consumers                                                                              viewcounts (for items) of con-                                                 whether a consumer purchases
who purchased them is plotted as                                                                             sumers who purchased them is                                                   an item for a given viewcount
the viewcount increases.                                                                                     shown as the price increases.                                                  is plotted as the viewcount in-
                                                                                                             There is a weak correlation be-                                                creases. There is a strong positive
                                                                                                             tween the viewcount and item                                                   correlation between the purchase
                                                                                                             price.                                                                         probability and viewcount when
                                                                                                                                                                                            the viewcount is less than 10.

5. BEHAVIORS TOWARDS PURCHASE                                                                                                                                   5.2     (Per-Item) Behavior Trajectory
  In this section, we first examine consumers’ online shop-                                                                                                        In this section, we investigate consumer activities in the
ping process. We then characterize what consumer behav-                                                                                                         behavior trajectory to find distinct patterns relevant to pur-
iors lead to actual purchases.                                                                                                                                  chases. Specifically, we focus on the behaviors of consumers
                                                                                                                                                                such as item browsing and cart usage.
5.1 Online Shopping Process
   We use a notion of an online shopping process to keep                                                                                                        5.2.1         Item Browsing
track of consumers’ behaviors on online markets. Figure 10                                                                                                         We first investigate how the browsing behaviors of con-
illustrates an online shopping process for purchasing an item.                                                                                                  sumers lead to their purchases. To this end, we define a
The shopping process for an item mainly consists of three                                                                                                       viewcount for each item, which indicates how many times
parts: (i) an item access, (ii) a sequence of consumer behav-                                                                                                   a consumer has viewed the given item. We then calculate
iors, and (iii) an item purchasing. We call the second part                                                                                                     the viewcounts of all the purchased items. Figure 7 plots the
“behavior trajectory”. The behavior trajectory shows the his-                                                                                                   portion of consumers (who purchase the item) with the given
tory of consumer’s behaviors (in the site) for the item. Even                                                                                                   viewcount as the viewcount increases. Note that a majority
if a consumer browses or buys multiple items at a time, we                                                                                                      of consumers who have bought items browse the same item
consider a single online shopping process (and a single be-                                                                                                     multiple times before purchasing; 44%, 78%, 63%, and 78%
havior trajectory) for each item.                                                                                                                               of consumers in sites S1-S4 browse the same item more than
   As shown in Figure 10, a consumer first accesses an item                                                                                                      twice. Interestingly, some consumers (S1: 0.4%, S2: 5.1%,
from external sources (e.g., search engines for price compar-                                                                                                   S3: 1.2%, and S4: 3.4%) browse the same item more than
ison, social communities, advertisements) or from the site                                                                                                      10 times before purchasing. We find that relatively more
itself. The item accesses in the four online sites are ana-                                                                                                     number of consumers in sites S2 and S4 browse the same
lyzed in Section 4.2.2. A behavior trajectory may encompass                                                                                                     item several times. Note that the median prices of the sold
the following consumer activities. (i) the consumer visits an                                                                                                   items (S2: $70, S4: $85) are more expensive than those of
item page and browses the item; note that the consumer may                                                                                                      S1 and S3 (S1: $9.9, S3: $19.9).
come back to browse the same item later. (ii) she places the                                                                                                       To further examine how the item price affects the browsing
item into her cart (cart usage), (iii) she checks out the item                                                                                                  behaviors of consumers in each shopping site, we analyze
for purchasing (i.e., not yet makes the payment), and (iv)                                                                                                      the relation between the viewcount of an item and its price.
she leaves the item page for browsing other items.                                                                                                              Figure 8 plots the distribution of the viewcounts for the
                                                                                                                                                                purchased items against their prices. We find that there is
                                                                       item 1                                                                                   a weak correlation between consumers’ viewcounts and item
                                                                                                                    checkout                                    prices within the same site.
                                                                                               revisit                                                             We next analyze the relation between the viewcount and
                                  Site itself                    item browsing
                              Search engine                                              add                                                                    purchase probability. The purchase probability (shortly, pur-
                                                                          revisit
                              Advertisement                    leave                                                                                            chase prob.) is defined as follows:
                                                                                                                               purchasing
                            Social community                                 leave/delete
                                                                                                                 checkout                                                         # of purchased items on a particular condition
                             item access                       other pages                                                                                      purchase prob. =
                                                                 or sites
                                                                                                cart usage                                                                          # of total items on a particular condition
                                                                                                                                                                                                                        (1)
                                                                       behavior trajectory
                                                                                                                                                                Figure 9 plots the purchase probability against the view-
Figure 10: The shopping process from accessing an                                                                                                               count. For example, if 40 items are purchased among 100
item to purchasing on a shopping site is depicted.                                                                                                              items which are browsed 7 times, the purchase probabil-
                                                                                                                                                                ity on the condition of the viewcount as 7 is calculated by
S1                                     S2
                                                                                                                                                                   1.00
       1.00
                                                                                                                                                                   0.75
                       S1                                                               0.6                                           S1

                                                                 Purchase probability
                       S2                                                                                                             S2                           0.50
       0.75

                                                                                                                                            Purchase Probability
                       S3                                                                                                             S3                           0.25

                       S4                                                               0.4                                           S4
 CDF

                                                                                                                                                                   0.00
       0.50                                                                                                                                                                                 S3                                     S4
                                                                                                                                                                   1.00

                                                                                        0.2                                                                        0.75
       0.25
                                                                                                                                                                   0.50

                                                                                                                                                                   0.25
       0.00                                                                             0.0
                 0.0           0.4          0.8                                                       Using Cart     Not Using Cart                                0.00
                                                                                                                                                                          0.0   0.2   0.4        0.6   0.8   1.0 0.0   0.2   0.4        0.6   0.8   1.0
                        The Portion of Sold Items                                                                                                                                                  Relative Cart Position

Figure 11: Portion of purchased                                 Figure 12: Purchase probability                                            Figure 13: There is a positive
items among all the items in a                                  of an item with and without using                                          correlation between the purchase
cart is plotted. Items placed in                                a cart is plotted for the four sites.                                      probability and relative cart posi-
the cart tend to be purchased, but                              The cart usage definitely increases                                         tion.
the purchase probabilities differ                                the purchase probability.
across the sites.

40/100 = 0.4. As shown in Figure 9, across the four sites,                                                         estingly, 67% of consumers in site S4 purchase all the items
the growth of the viewcount up to a particular point (e.g.,                                                        placed in their carts.
8 in S2) accompanies the increase of the purchase probabil-                                                           We further analyze how the cart usage behaviors are re-
ity. After that point, the purchase probability mostly shows                                                       lated to purchases. To this end, we compare the purchase
slight drop as the viewcount increases. We define the partic-                                                       probability against the cart usage behavior. Figure 12 plots
ular point of the viewcount as a view threshold, at which the                                                      (i) the ratio of purchased items among items placed in the
purchase probability becomes the highest. The view thresh-                                                         cart, and (ii) the ratio of purchased items among items not
olds of the sites S1-S4 are 7, 8, 21, and 8, respectively and                                                      placed in the cart. As shown in Figure 12, the purchase
there is a strong positive correlation between the purchase                                                        probabilities of S1-S4 are 57.1%, 37.4%, 58.4%, and 70.2%,
probability and the viewcount until the view threshold (the                                                        respectively, when items are placed in the cart. On the con-
Pearson’s correlation coefficient [19] ρ values of S1-S4: 0.86,                                                      trary, the purchase probabilities of sites S1-S4 become much
0.96, 0.72, and 0.92). It then shows a strong negative cor-                                                        lower (5.4%, 2.3%, 4.7%, and 9.2%) when consumers do not
relation (S1: -0.89, S2: -0.76, S3: not available, and S4:                                                         utilize their carts (for the items). This result is in line with
-0.81) when the viewcount exceeds the view threshold. This                                                         the report [4] that online consumers tend to place items into
result implies the browsing behaviors of consumers can be                                                          their carts when they consider purchasing.
used as a good factor to predict their purchases.                                                                     To understand the effect of the moment of placing an item
                                                                                                                   into a cart during the trajectory on the purchases, we define
Table 2: The portions of consumers who utilize carts                                                               a relative cart position of a given item as follows:
are shown across the four sites.                                                                                                             viewcount before placing into a cart
                                                                                                                   relative cart position =
              site      # of consumers              # of cart users                           ratio                                                     total viewcount
               S1          564,786                     324,356                                57%                                                                              (2)
                                                                                                                   For example, assuming that a consumer browses an item
               S2           64,467                     45,253                                 70%
                                                                                                                   5 times (viewcount 5) total, if she places the item into her
               S3           45,271                     33,236                                 73%
                                                                                                                   cart after browsing it 3 times (viewcount 3), the relative cart
               S4           17,229                      7,409                                 43%
                                                                                                                   position is calculated as 3/5 = 0.6. Figure 13 plots the pur-
                                                                                                                   chase probability against relative cart position. As shown in
                                                                                                                   Figure 13, the higher value of the relative cart position usu-
5.2.2 Cart Usage                                                                                                   ally results in the increase of the purchase probability. This
   We next investigate how many consumers utilize online                                                           result implies that consumers who use their carts in the lat-
shopping carts for their online shoppings. To this end, we                                                         ter part of behavior trajectory are more likely to buy items.
examine consumers whose carts are used at least once. Ta-                                                          The Pearson correlation ρ values between the purchase prob-
ble 2 shows the ratio of consumers who ever utilize shopping                                                       ability and the relative cart position in S1-S4 are 0.85, 0.97,
carts. As shown in Table 2, a majority of consumers in the                                                         0.90, and 0.80, respectively, which signifies a strong positive
four sites utilize carts. The portions of cart users in sites                                                      correlation. In this way, the cart usage patterns can be used
S1-S4 are 57%, 70%, 73%, and 43%, respectively.                                                                    to predict purchases.
   Figure 11 plots the portion of purchased items among all
the items in the cart for each consumer. For example, if a                                                         5.2.3       Analysis of Consumer’s Shopping Trajectory
consumer has placed five items in her cart and purchases                                                               From the above analysis of behavior trajectories, we can
only two items, her portion of purchased items is calculated                                                       conclude that a consumer’s browsing and cart usage behav-
as 2/5 = 0.4. As shown in Figure 11, the median consumers                                                          iors are strongly related to her purchases. We now inves-
of sites S1-S4 purchase 86%, 50%, 80%, and 100% of items                                                           tigate consumers’ online shopping processes from a proba-
placed in their carts. This result shows that most of the                                                          bilistic viewpoint. Figure 17 shows a transition diagram of a
items placed in the cart are likely to be purchased. Inter-                                                        consumer’s shopping process on a shopping site. There are
S1                             S2
                                                S1                             S2                                                            S1                      S2
                                                                                                                                                                                                                                             0.6

                                                                                                                              90
 The Portion of Consumers

                                                                                                   Consideration time(hour)
                            0.04                                                                                                                                                                                                             0.4
                                                                                                                              60

                                                                                                                                                                                                                      Purchase Probability
                            0.02                                                                                                                                                                                                             0.2
                                                                                                                              30
                            0.00                                                                                               0                                                                                                             0.0
                                                                                                                                                                                                                                                                   S3                             S4
                                                S3                             S4                                                            S3                      S4
                                                                                                                                                                                                                                             0.6
                                                                                                                              90
                            0.04
                                                                                                                              60                                           Median                                                            0.4
                            0.02                                                                                                                                           Avergae
                                                                                                                              30                                                                                                             0.2
                            0.00                                                                                              0
                                                                                                                                                                                                                                             0.0
                                   0       50     100     150     0       50    100   150                                          0   250   500   750 1000
                                                                                                                                                         0    250    500   750 1000                                                                0    25        50    75   100    0    25   50       75   100
                                                Consideration Time(min)                                                                            Item Price(USD)                                                                                                      Consideration Time(min)

Figure 14: Portion of consumers                                                                  Figure 15: There is a weak corre-                                                                                Figure 16: Purchase probability
who purchased items with the                                                                     lation between the consideration                                                                                 increases sharply and then drops
given consideration time among                                                                   time and item price.                                                                                             gently as the consideration time
all the purchased consumers is                                                                                                                                                                                    increases.
shown against the consideration
time for the four sites.

four stages in the online shopping process, and each stage                                                                                                                                             0.25

represents different options of consumer behaviors. Each line
indicates a possible choice from a state, and the values along                                                                                                                                         0.20

                                                                                                                                                                                Purchase Probability
the line mean the transition probabilities in case of S1-S4.
                                                                                                                                                                                                                                                                                    S1
For example, look at the red arrows and the first values along                                                                                                                                          0.15                                                                         S2

the arrows (i.e., for case S1), which means that (i) among                                                                                                                                                                                                                          S3
                                                                                                                                                                                                                                                                                    S4
all items, 23% of items in S1 are discovered by consumers                                                                                                                                              0.10

from external sites, (ii) among items browsed by those con-
sumers referred to S1, 11% of items were viewed more than                                                                                                                                              0.05

3 times4 , (iii) among the items browsed at least 3 times,
                                                                                                                                                                                                              0   5                                10        15         20
40% of them are placed in carts, and (iv) among the items                                                                                                                                                                                           Hour

in the cart, 57% are actually purchased. Overall, the path                                                                                                 Figure 18: Purchase probability is plotted as the
of “external - viewcount:3+ - (use cart)” exhibits the highest                                                                                             visiting time varies.
purchase probabilities (S1: 57.9%, S2: 71.2%, S3: 79.5%,
and S4: 87.8%), while the path of “(site itself )- viewcount:1
- (not use cart)” shows the lowest purchase probabilities (S1:                                                                                                We next investigate how temporal factors affect purchases.
3.7%, S2: 0.4%, S3: 1.7%, S4: 3.2%).                                                                                                                       In particular, we focus on a consumer’s consideration time
                                                                                                                                                           and visiting time. We first analyze how long a consumer
                                                                                      6WDUW
                                                                                                                                                           stays in a site before purchasing since she first looks at an
                                                5555                                                                                               item. To this end, we define two metrics: (i) a visiting time
                                                                                                                                                           is a moment when a consumer visits the item page, and (ii)
                             KVGOCEEGUU                    ([WHUQDO                                                       6LWHLWVHOI                 a consideration time is the interval between the first visit-
                                                                                                                                                           ing time and last visiting time. For example, suppose that a
                                                                                                                                                           consumer has browsed an item twice at 1 PM and at 3 PM,
                                                                                                                                                           and then she may (or may not) purchase the item later. In
                                                                                                                                                           this case, her consideration time is 2 hours and we assume
                            KVGODTQYUKPI                                                                                         
                                                                                                                                                           she spends 2 hours in making a purchase decision. Figure 14
                                                                                                                                                           plots the portion of consumers who purchase an item with
                                                                                                                                                           the given consideration time among all the purchased con-
                                                                                                                                                           sumers as the consideration time increases. About 32-42%
                                   ECTV                   8VHFDUW                           1RWXVH&DUW                                               of consumers in the four sites spend less than 10 min to pur-
                                           
                                                                                                                                                           chase an item. The medians of the consideration times of
                                                                                                                       
                                                                                                                                                           consumers in S1-S4 are 24 min, 29 min, 36 min, and 21 min,
                              RWTEJCUG                   3XUFKDVH                            1RWSXUFKDVH
                                                                                                                                                           respectively.
                                                                                                                                                              We next analyze the relation between the consideration
Figure 17: The probability of each transition in the                                                                                                       time and the item price. Figure 15 shows the distribution of
online shopping process is shown across the four                                                                                                           consideration times for the purchased items against the item
sites.                                                                                                                                                     prices. The Pearson correlation ρ values for the considera-
                                                                                                                                                           tion time and the item price in S1-S4 are 0.12, 0.18, 0.14,
                                                                                                                                                           and 0.12, respectively, which indicates a weak correlation.
5.3 Temporal Factors on Purchase                                                                                                                              We also investigate the relation between the consideration
                                                                                                                                                           time and purchases. Figure 16 plots the purchase probability
4                                                                                                                                                          against the consideration time. For example, suppose that
  Each state in the item browsing stage means the viewcount
for the given item.                                                                                                                                        there are 100 items, each of which is browsed for 20 min
Table 3: Performance results of our prediction models using different features.
                                                S1 (General)                                         S2 (Clothes)
                             Precision   Recall   F1 score   Accuracy    AUC      Precision   Recall   F1 score   Accuracy     AUC
                   Not buy     0.56       0.87      0.68                            0.64       0.37      0.47
          Item                                                 0.60       0.67                                      0.58       0.58
                    Buy        0.72       0.32      0.45                            0.55       0.79      0.65
                   Not buy     0.73       0.92      0.82                            0.81       0.89      0.85
        Behavior                                               0.80       0.78                                      0.84       0.84
                    Buy        0.90       0.67      0.77                            0.88       0.79      0.83
                   Not buy     0.74       0.92      0.82                            0.81       0.89      0.85
          All                                                  0.80       0.79                                      0.84       0.84
                    Buy        0.90       0.67      0.77                            0.88       0.79      0.83
                                           S3 (Home decoration)                                      S4 (Sports)
                             Precision   Recall   F1 score   Accuracy    AUC      Precision   Recall   F1 score   Accuracy     AUC
                   Not buy     0.54       0.96      0.69                            0.55       0.91      0.68
          Item                                                 0.57       0.56                                      0.58       0.59
                    Buy        0.79       0.17      0.29                            0.74       0.27      0.39
                   Not buy     0.80       0.88      0.84                            0.78       0.89      0.83
        Behavior                                               0.83       0.83                                      0.82       0.81
                    Buy        0.86       0.78      0.82                            0.87       0.75      0.81
                   Not buy     0.80       0.88      0.84                            0.79       0.90      0.84
          All                                                  0.83       0.83                                      0.83       0.82
                    Buy        0.86       0.78      0.82                            0.88       0.77      0.82

before purchasing. If 30 items are purchased, the purchase              6.1      Prediction as a Learning Problem
probability at the consideration time of 20 min is calculated
as 30/100 = 0.3. As shown in Figure 16, the growth in                   6.1.1     Problem Definition
the consideration time up to a particular point increases the              Our aim is to identify whether a consumer will purchase an
purchase probability. The particular point of time is termed            item or not based on the observed features (as described in
as a time threshold at which the purchase probability shows             Section 5). For this, we define two random variables: (i) x =
the highest value. The time thresholds of sites S1-S4 are 25            (x1 , x2 , ..., xn ) is a set of features where xi indicates the i-th
min, 15 min, 30 min, and 20 min, respectively, and there is             feature of a consumer, and (ii) y is a target variable where
a strong positive correlation (ρ values of S1-S4: 0.73, 0.92,           y is 1 if the consumer has bought an item and 0 otherwise.
0.74, and 0.69) between the purchase probability and the
consideration time up to the time threshold. Also, there is             6.1.2     Factors driving Purchase
a weak negative correlation (S1: -0.23, S2: -0.2, S3: -0.14,              To predict the consumer’s purchase, we observe a set of
and S4: -0.17) after the time threshold. This result suggests           distinct features associated with the consumer behaviors as
that the consideration time can be also used as a factor to             described in Section 5.
predict purchases.
   We finally analyze how visiting times of consumers affect                 • Behavior features are associated with the behaviors
their purchases. Figure 18 plots the ratio of purchased items                toward purchase: source of item access (e.g., site itself,
to all the items browsed at the interval of one hour. For ex-                from external sources), viewcount, view threshold, cart
ample, when 100 items are browsed by consumers from 5 AM                     usage, relative cart position, consideration time, and
to 6 AM and 18 items are purchased among them, the pur-                      time threshold.
chase probability at 5 AM is calculated as 18/100 = 0.18. As
                                                                           • Item features are associated with item properties: price,
there is no notable correlation between the purchase proba-
                                                                             total browsing count for an item, and total purchasing
bility and the visiting time, the visiting time information is
                                                                             count for an item.
not used in the purchase prediction.
                                                                        6.1.3     The Classifier
6. PREDICTION ON PURCHASE                                                 We build a model based on a support vector machine
   We have revealed that there exist distinct patterns of con-          (SVM) classifier [11, 5] using the radial basic function (RBF)
sumers behaviors that are associated with their purchases.              as a kernel function. We measure the performance metrics
In this section, we seek answers to the following questions:            including precision, recall, F1 score, accuracy, and area un-
(i) how we can predict whether a consumer will buy an item              der the ROC curve (AUC) [18] as shown in Table 3. To
or not, and (ii) what features we can use for predicting a              ensure the consistency of our model, we perform 5-fold cross
consumer’s purchase with an acceptable precision. Lever-                validation.
aging insights gained from our measurement study, we pro-
pose a machine-learning-based prediction model to identify              6.2      Performance Results
whether a consumer will buy an item or not.                               Table 3 shows the results of our prediction model using the
   We believe such a model has great utility on online shop-            features described in Section 6.1.2. Note that the model la-
ping sites as follows. First, retailers and sellers can provide         beled All considers all the features collectively. As shown in
more customized interactions with consumers. For example,               Table 3, the model using Behavior features shows higher ac-
for consumers who are expected to purchase an item, more                curacy (i.e., from 0.80 to 0.84) than the Item model across
details of the item can be provided to enhance the consump-             four online shopping sites, meaning that the model based
tion experience and satisfaction of purchase. For consumers             on Behavior features is substantially effective in predict-
who do not have confidences in the items, or are likely not to           ing a purchase. Interestingly, the model based on Behavior
purchase the items, an additional promotion (e.g., discount             features shows comparable performance with the model us-
coupons) could be provided at an appropriate moment to                  ing All features, which confirms that the behavior features
help their purchase decisions. Second, our model may be                 are the important factors to predict consumer’s purchase.
useful for managing inventories like Amazon’s anticipatory              Notice that the Behavior model exhibits consistent perfor-
shipping [22].                                                          mances across different shopping sites, which suggests that
consumer’s purchase can be predicted with an acceptable                  use. Journal of Business Research, 63(9-10):986–992,
performance with behavioral patterns of consumers. When                  2010.
we look at the site S1, the AUC value of the model using           [5]   C. Cortes and V. Vapnik. Support-vector networks.
Item features is higher than the ones in the other sites, which          Journal of Machine Learning, 20(3):273–297, 1995.
indicates that Item features (e.g., price and popularity) are      [6]   A. M. Degeratu et al. Consumer choice behavior in
more effective to predict consumer’s purchase on online mar-              online and traditional supermarkets: The effects of
kets where a large number of and a variety of products are               brand name, price, and other search attributes.
provided.                                                                Journal of Research in Marketing, 17(1):55–78, 2000.
   In conclusion, the Behavior features are good predictors        [7]   D. V. den Poel and W. Buckinx. Predicting
for the actual purchase on online markets. we believe our                online-purchasing behaviour. Journal of Operational
analyses provide a valuable implication for online market                Research, 166(2):557–575, 2005.
stakeholders, as the Behavior features can be extracted from       [8]   P. DiMaggio and H. Louch. Socially embedded
consumer behaviors on online shopping sites without con-                 consumer transactions: For what kinds of purchases
sidering any personal information such as gender, age, or                do people most often use networks? Journal of
account of social media [24, 25].                                        American Sociological Review, 63(5):619–637, 1998.
                                                                   [9]   S. Guo et al. The role of social networks in online
7. CONCLUSIONS                                                           shopping: Information passing, price of trust, and
   We have comprehensively analyzed consumer behaviors                   consumer choice. In Proc. of ACM EC, 2011.
on the four online sites, by keeping track of the behavior        [10]   A. Hannak et al. Measuring price discrimination and
trajectory of each consumer, which consists of accessing an              steering on e-commerce web sites. In Proc. of ACM
item, browsing its page, putting the item in her cart, and               IMC, 2014.
finally making a purchase. Based on the behavior trajecto-         [11]   T. Joachims. Learning to Classify Text Using Support
ries of consumers, we analyzed: (i) how consumer behav-                  Vector Machines: Methods, Theory and Algorithms.
iors differ by the characteristics of online shopping sites,              Kluwer Academic Publishers, 2002.
(ii) how the sequential components of consumer behaviors          [12]   A. K. Kau et al. Typology of online shoppers. Journal
lead to purchases, and (iii) what consumer activities from               of Consumer Marketing, 20(2):139–156, 2003.
the behavior trajectories could be used to predict the like-      [13]   M. Kukar-Kinney and A. G. Close. The determinants
lihood of actual purchases. We found that a substantial                  of consumers’ online shopping cart abandonment.
portion (24%) of consumers in a general-purpose market-                  Journal of the Academy of Marketing Science,
place (like eBay) discover items from external sources (e.g.,            38(2):240–250, 2010.
price comparison sites), while most (>95%) of consumers
                                                                  [14]   M. Levy and B. Weitz. Retailing Management.
in special-purpose shopping sites directly access items from
                                                                         McGraw-Hill/Irwin, 2011.
the sites themselves. We also revealed that item browsing
                                                                  [15]   W. W. Moe and P. S. Fader. Capturing evolving visit
patterns and cart usage patterns are the important predic-
                                                                         behavior in clickstream data. Journal of Interactive
tors of the actual purchases. Based on the lessons from our
                                                                         Marketing, 18(1):5–19, 2004.
analyses, we developed a prediction model to infer whether
a consumer will purchase the item of interest. Our proposed       [16]   S. Mulpuru et al. US Online Retail Forecast, 2012 To
model achieved over 80% accuracy in predicting consumers’                2017. Forrester, 2013.
purchases across the four online shopping sites.                  [17]   C. H. Park et al. A multi-category customer base
                                                                         analysis. Journal of Research in Marketing,
                                                                         31(3):266–279, 2014.
8. ACKNOWLEDGMENTS                                                [18]   D. M. Powers. Evaluation: from precision, recall and
  This research was supported in part by Basic Science Re-               f-measure to roc, informedness, markedness and
search Program through the “National Research Foundation                 correlation. Journal of Machine Learning
of Korea(NRF)” funded by the Ministry of Science, ICT                    Technologies, 2(1):37–63, 2011.
& future Planning (2013R1A2A2A01016562) and in part               [19]   J. Rodgers and W. Nicewander. Thirteen ways to look
by the National Research Foundation of Korea(NRF) grant                  at the correlation coefficient. Journal of The American
funded by the Korea government(MSIP)                                     Statistician, 42(1):59–66, 1988.
(No. 2013K1A3A7A03078191).
                                                                  [20]   A. J. Rohm and V. Swaminathan. A typology of
                                                                         online shoppers based on shopping motivations.
9. REFERENCES                                                            Journal of Business Research, 57(7):748–757, 2004.
 [1] B. L. Bayus. Forecasting sales of new contingent             [21]   F. Thiesing and O. Vornberger. Sales forecasting using
     products: An application to the compact disc market.                neural networks. In Proc. of Neural Networks, 1997.
     Journal of Product Innovation Management,                    [22]   WSJ.D. Amazon wants to ship your package before
     4(4):243–255, 1987.                                                 you buy it - jan 17, 2014.
 [2] R. E. Bucklin et al. Choice and the internet: From           [23]   X. Wu and A. Bolivar. Predicting the conversion
     clickstream to research stream. Journal of Marketing                probability for items on c2c ecommerce sites. In Proc.
     Letters, 13(3):245–258, 2002.                                       of ACM CIKM, 2009.
 [3] N. Christin. Traveling the silk road: A measurement          [24]   Y. Zhang and M. Pennacchiotti. Predicting purchase
     analysis of a large anonymous online marketplace. In                behaviors from social media. In Proc. of WWW, 2013.
     Proc. of WWW, 2013.                                          [25]   Y. Zhang and M. Pennacchiotti. Recommending
 [4] A. G. Close and M. Kukar-Kinney. Beyond buying:                     branded products from social media. In Proc. of ACM
     Motivations behind consumers’ online shopping cart                  RecSys, 2013.
You can also read