Parks and recreation NATIONAL DATABASE REPORT
←
→
Page content transcription
If your browser does not render page correctly, please read the page content below
Parks and recreation
NATIONAL DATABASE REPORT

                  2014

               Po w er ed B y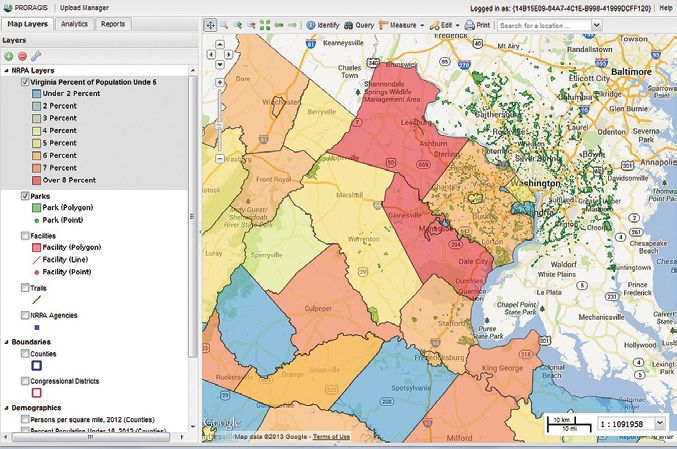
Executive Summary

    Across the country, park and recreation agencies       increases and other support from local or state
    provide people with the resources they need to         governments. By employing the Eco-Benefit Cal-
    build sustainable, healthy communities with            culator and Custom Reports functions of PROR-
    opportunities for all. Offering a broad range of       AGIS, you can demonstrate specific, positive
    programs and services to support the natural           impacts on the environmental, public health
    environment, encourage nourishing lifestyles           and social equity benefits that your agency’s pro-
    and level the playing field for all members of the     grams, parks and facilities bring to a community
    community, park and recreation agencies often          — strengthening your case.
    do much more than their local officials may re-
    alize. In their work, professionals in this field as   Impacting Communities
    well as citizen advocates help establish a strong      As more agencies add their information to the
    foundation for the nation as a whole.                  PRORAGIS database, patterns begin to emerge
                                                           that show trends in the ways that park and recre-
    To help communicate this message of impact,            ation agencies impact their communities. Often,
    NRPA developed the three pillars — Conserva-           these trends directly align with the pillars, clearly
    tion, Health and Wellness, and Social Equity —         illustrating these key areas of influence deliv-
    which together showcase the ways in which park         ered by parks and recreation and allowing agen-
    and recreation agencies help build and strength-       cies to measure how their programs compare
    en their communities.                                  to others in relation to the pillars. For example,
                                                           in 2012 and 2013, health and wellness, fitness
    But while the broader benefits of parks and rec-       and team sports programs topped the charts as
    reation are generally easy to convey, it’s often       programs offered by agencies. In 2013, more
    much more difficult to quantify this information       agencies offered community gardens, where
    in ways that translate to more funding and sup-        families were able to grow healthy foods and
    port. PRORAGIS™, the Park and Recreation Op-           lessen their environmental impact. Also in 2013,
    erating Ratio and Geographic Information Sys-          more departments offered feeding programs for
    tem developed by NRPA, is a resource to help           before-school programs than ever before.
    you do just that.
                                                           Reading This Report
    Now in its fifth year, the PRORAGIS database tool      We divided responses into median (middle 50
    has become the most comprehensive and largest          percent), lower quartile (lowest 25 percent) and
    collection of detailed data on municipal, county       upper quartile (highest 25 percent) divisions to
    and state park systems in the U.S. With thousands      help you determine where your agency stands in
    of data points and more than 500 completed pro-        the spectrum of responses. Although hundreds
    files, PRORAGIS contains reliable, detailed data       of agencies have logged data into the PRORAGIS
    on a wide range of park agency metrics, allowing       system, each park system may not answer every
    agencies to compare their operations and offer-        question; this accounts for the fluctuating num-
    ings to other agencies of similar size and popula-     ber of responses in each data set.
    tion as they self-evaluate. NRPA encourages park
    systems to update their information every year to      Figure 1: Jurisdiction Operating Budget
    keep data as current as possible. Each year, as        Improvement in these budgets from 2012 to
    participating agencies update their profiles and       2013, continuing the trend seen in 2011 to
    new agencies register, PRORAGIS becomes an             2012. Lower-quartile, median and upper-quar-
    ever-stronger tool that agencies can use to learn      tile groups all increased from 2012 to 2013.
    and apply insight into trends and realities of park    Continues the encouraging trend from previous
    systems across the country.                            years of increasing budgets.
                                                           Figure 2: Jurisdiction Capital Budget
    By comparing and evaluating your program of-           Similarly, these budgets have also continued
    ferings, operation cost per resident or direct         to increase from 2012 to 2013, as was seen in
    revenue per capita, you can develop sound,             2011 to 2012. Increased for lower quartile, me-
    fact-based arguments when asking for budget            dian and upper quartiles.

2       National Recreation and Park Association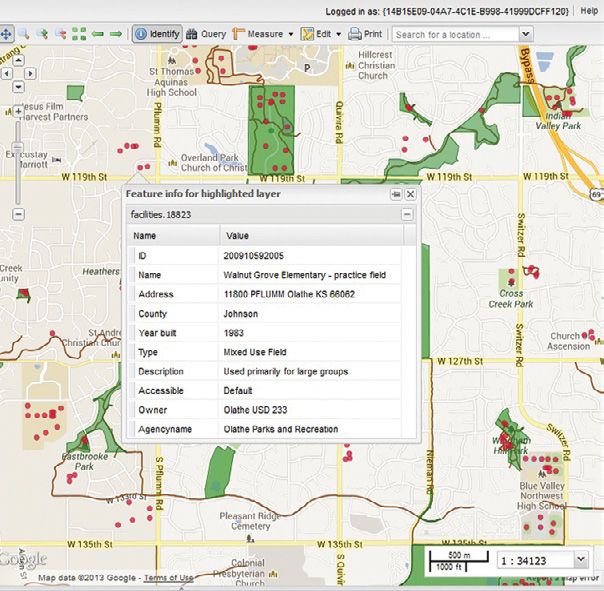
Figure 1                                Jurisdiction Operating Budget
   Thousands
  $120,000

  $100,000
                           2010
    $80,000
                           2011
    $60,000                2012
    $40,000                2013

    $20,000

            $0
                       Lower Quartile                     Median                        Upper Quartile

Figure 2                                 Jurisdiction Capital Budget
  Thousands
  $30,000

  $25,000
                          2010
  $20,000
                          2011
  $15,000                 2012
  $10,000                 2013

    $5,000

           $0
                      Lower Quartile                      Median                        Upper Quartile

                                                         To see what PRORAGIS can do for you, visit:
                                                         www.nrpa.org/PRORAGIS.
                                                ew?
                                   W h a t ’s N
    Better Navigation: A completely redesigned, user-friendly interface with more intuitive organization
    makes for smoother navigation and easier data entry. In addition, more reliable and secure access
    allows agencies to control who can enter and edit data.

    Updated GIS: The new layout includes two new tools (Identify and Query) to help users navigate maps
    and get information more quickly. The Identify feature allows users to click on a map feature to see
    key attributes. With the Query tool activated, users can complete in-depth searches keyed to particular
    conditions (e.g, “view all parks smaller than 25 acres”). Users can also measure areas and distances,
    search for locations, and examine topographic and street maps.

    Eco-Benefit Calculator: This ever-expanding calculator helps park professionals understand
    the complex and intangible — yet valuable — assets that parks, land, programs and facilities
    offer to a community. Using mathematical algorithms, the Eco-Benefit Calculator estimates
    the dollar value of your park or facility in terms of health, ecology, local business revenue,
    tax revenue and other factors. Using this tool, park professionals can gain a clearer picture
    of a park or facility’s true worth to a community or region. Additional enhancements will
    soon include values for stormwater mitigation, aquatic environments, health and well-
    ness, and crime reduction for teens.

                                                        2014 Parks and recreation national database report    3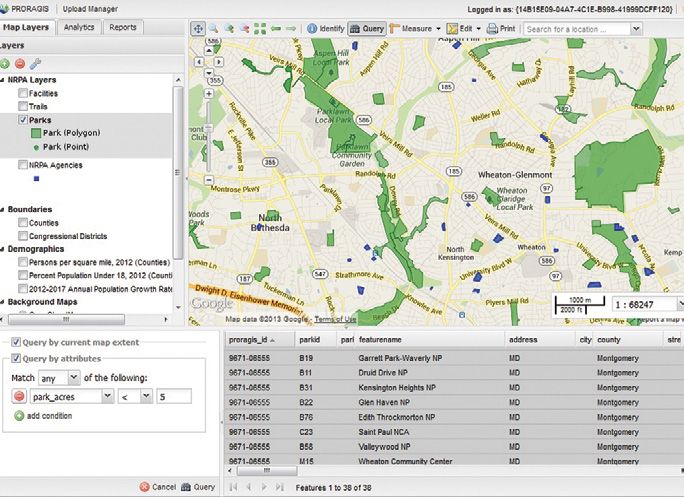
Table of contents

              Responsibilities
    5         Many park systems oversee more than just parkland and recreational programs.

              Staffing and Volunteers
    6         Park personnel and volunteers work hard to keep community residents active and make
              park systems a regional asset.

              Budget
    8         Budgets have shrunk, but park professionals are making the most of fewer dollars.

              Programming and Attendance
    10        Although park programming and attendance have dropped over the last several years,
              departments still offer a wide variety of programs that keep people healthy and engaged.

              Operations, Maintenance and Benchmarking
    12        Gauge your agency’s spending by examining the maintenance costs, facilities and budgets
              of other agencies across the U.S.

              GIS and Mapping
    14        New mapping tools make the GIS mapping system more flexible and
              user-friendly than ever.

              Trends in Regional Park Systems
    16        Information from the PRORAGIS database allows PRORAGIS
              administrators to spot the trends that help you justify
              spending, make decisions and plan for the future.

              This special report and the PRORAGIS database are produced by:
              National Recreation and Park Association
              22377 Belmont Ridge Rd.
              Ashburn, VA 20148
              703.858.0784
              www.nrpa.org

4        National Recreation and Park Association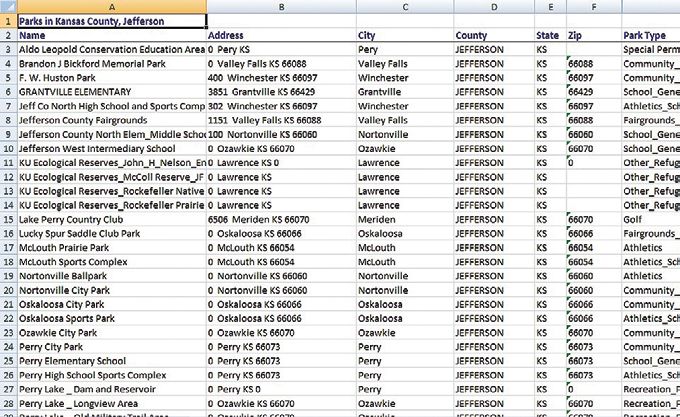
Responsibilities

     Today’s park and recreation departments have more on their plates than just park maintenance and
     recreational programming. Park systems have diverse responsibilities that range from overseeing spe-
     cial events (85 percent) — such as themed 5K runs and summer concerts — to managing open space
     (80 percent), maintaining jurisdiction public areas (55 percent), overseeing outdoor sports event
     complexes (59 percent), operating aquatic centers (50 percent), supervising historic properties (50
     percent) and running community gardens (46 percent). Use this chart to see how your park agency’s
     responsibilities stack up against those of other agencies across the country.

Figure 3                                     Responding Agencies That...

                                                                                                                 97.4%
                                                                                                                 96.7%
            Provide recreation programming and services
                                                                                                                95.3%
                                                                                                                95.4%

                                                                                                                 98.3%
                                                                                                                96.7%
                              Operate parks and facilities
                                                                                                                97.1%
                                                                                                                 98.6%

                                                                                                     81.6%
                                                                                                    80.7%
                             Actively manage open space
                                                                                                    81.2%
                                                                                                    80.4%

                                                                                  51.1%
                                                                                 49.0%
                       Maintain jurisdiction public areas
                                                                                       58.2%
                                                                                     54.9%

                                                                                         63.8%
                          Manage major aquatic complex
                                                                                     57.9%                      2010
                                                                                     57.4%
                                                                                 50.2%                          2011
                                                                              43.4%                             2012
                                                                               45.1%
                              Manage historic properties                                                        2013
                                                                                46.8%
                                                                                  49.5%

                                                                          35.8%
                                                                             41.2%
                          Administer community gardens
                                                                            39.3%
                                                                                46.0%

                                                                                          62.4%
           Administer or manage tournament/event quality                                59.9%
                               outdoor sports complexes                                    64.2%
                                                                                        59.1%

                                                                                                   77.5%
                                                                                                     80.5%
           Conduct major jurisdiction-wide special events
                                                                                                     80.5%
                                                                                                        85.1%

                                                                                       58.8%
              Provide environmental education or natural                             56.6%
                            history interpretive programs                           54.7%
                                                                                   52.8%

                                                             2014 Parks and recreation national database report          5
Staffing and Volunteers

     Staff and volunteers form the backbone of any park and recreation agency, so the PRORAGIS survey
     asks for detailed responses on all aspects of agency personnel — from the number of full-time staff
     members to the number of volunteer hours worked and information on salaries and wages.

     In 2013, staff filled more full-time positions (Figure 4) across all quartiles than in 2010 to 2012. In
     addition, the number of part-time employees (Figure 5) also rose since 2011 for the lower quartile —
     and increased dramatically in the case of the upper quartile, where an average of 300 non-full-time
     positions rebounded back to 2010 levels after dipping over the previous two years. Taken together,
     both data sets indicate that departments are hiring, but they are hiring part-timers more frequently
     than full-timers.

    Figure 4                             Full-Time Positions Authorized
         120
                                                       Lower Quartile
         100                                           Median                                    97
                        91                             Upper Quartile
          80
                                                                          73
          60
                                                55
          40                                                                                     39
                            27                                           27
                                                 20
          20
                         9                                               8                  10
                                                 7
           0
                       2010                    2011                     2012               2013

    Figure 5                          Non-Full Time Positions Authorized
          350                                          Lower Quartile
                      321                                                                   300
          300                                          Median
                                                       Upper Quartile   239
          250
                                                200
          200
                        144
          150
                                                                        110                103
          100                                    77
                         41                                                                 40
           50                                                            34
                                                 20
               0
                        2010                    2011                    2012               2013

6         National Recreation and Park Association
Figure 6                        Total Full-Time Equivalents Available
     200
                      180                         Lower Quartile
     180
                                                  Median
     160
                                                  Upper Quartile
     140
                                                                                        118
     120                                                           109
                                         99
     100
      80
                       52
      60
                                                                                        40
                                                                    33
      40                                  26
                       15                                           13
      20                                  9                                                 11
       0
                      2010              2011                       2012                2013

Volunteering (Figure 7) has remained somewhat steady in the past two years, with slight volunteer
increases in the median quartile and a small drop in volunteers in the upper quartile (where volunteer
numbers dropped dramatically between 2010 and 2011). As for volunteer hours, the number of annu-
al hours jumped in all three quartiles compared to the last two years.

Figure 7                         Recreation Department Volunteers

      7A Number of Volunteers                                2010           2011     2012          2013
           Lower Quartile                                      50            25       35            35
           Median                                             225           150      175           200
           Upper Quartile                                   1,333           575      788           733
      7B Number of Hours Worked by Volunteers                2010           2011     2012          2013
           Lower Quartile                                   1,000           253      463           850
           Median                                           6,000          3,981    4,383         4,663
           Upper Quartile                                  40,031         18,000   22,645        26,125
      7C Number of Hours Worked per Volunteer                2010           2011     2012          2013
           Lower Quartile                                      12             8        7            10
           Median                                              22            20       19            22
           Upper Quartile                                      40            60       43            48

                                      Tailor your comparison
     For the most complete comparison of your agency’s workers against staff and volunteers in
     other similar agencies, use the Custom Report feature on your PRORAGIS profile, which will
     help account for variations in seasonal employment, geographic location, agency responsi-
     bilities and other factors.

                                                   2014 Parks and recreation national database report     7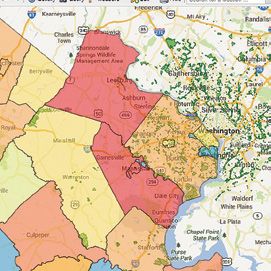
Budget

    Budgets across most local jurisdictions have tightened in the past six years, making it difficult for
    park and recreation departments to secure the funds they need. To help justify your budget pro-
    posal and keep valuable programs and operations running smoothly, compare your spending and
    revenue to that of similar agencies.

    Total operating expenditures (Figure 8) have dipped but remain fairly constant with past years.
    While 2011 reveals a drop that most departments experienced as tax resources dried up, 2012
    shows a slow return of funding; we don’t yet know if that trend will continue. Because more small
    agencies have joined in contributing to PRORAGIS in the past couple of years, we see more fluctua-
    tion in the distributions.

        Figure 8                            Total Operating Expenditures (in 000s)
                                        $20,000
                           Thousands

                                        $18,000
                                        $16,000
                                        $14,000
                                        $12,000
                                        $10,000
                                         $8,000
                                         $6,000
                                         $4,000
                                         $2,000
                                             $0
                                                       2010          2011         2012         2013
                        Lower Quartile              $1,178,134    $1,090,848   $1,410,188    $1,034,033
                        Median                      $5,076,683    $3,652,900   $4,197,927    $3,575,026
                        Upper Quartile              $17,833,720   $9,515,617   $10,056,771   $8,830,587

        Figure 9                                  Annual Direct Revenue (in 000s)
                                        $7,000
                            Thousands

                                        $6,000
                                        $5,000
                                        $4,000
                                        $3,000
                                        $2,000
                                        $1,000
                                            $0
                                                      2010          2011          2012         2013
                       Lower Quartile                $371,206     $269,705      $390,249     $210,575
                       Median                       $2,152,000    $1,026,854   $1,275,307    $958,925
                       Upper Quartile               $5,765,397    $3,891,576   $3,360,671    $3,237,188

8       National Recreation and Park Association
Through the last four years, annual direct reve-
     nue — revenue from classes, programs, mem-                               Figure 11A                             Total Capital Budget
     berships, concessions, permits, rentals and oth-
     er nontax sources — shows a downward trend                                                        $7,000

                                                                                           Thousands
     that may reflect how families across the country                                                  $6,000
     have cut back on leisure spending. Attendance                                                     $5,000
     figures have also dropped, indicating a strong                                                    $4,000
     correlation between fewer users and less reve-
                                                                                                       $3,000
     nue. Data also experienced fluctuations due to
                                                                                                       $2,000
     more small agencies reporting to PRORAGIS in
                                                                                                       $1,000
     the past two years than in the years before.
                                                                                                           $0
                                                                                                                   2010          2011         2012          2013
     In 2013, about every slice of the direct reve-                                  Lower Quartile              $107,750      $26,000       $100,000      $48,676
     nue pie (Figure 10) has remained steady over                                    Median                      $791,150      $405,700      $600,000     $506,047
                                                                                     Upper Quartile             $6,100,928    $2,450,000    $3,000,000    $2,542,838
     the past three years, even as agency fees and
     charges are down overall. That may be in part
     because more agencies are outsourcing their
     revenue-generating programs (for instance,
     hiring contractors to run fitness programs). The
     graph showing departments’ total capital bud-
     gets (Figure 11A) also reflects more small-agen-                         Figure 11B                        Amount of Renovation Need
     cy reporting and mirrors the fluctuations in op-
     erating budgets.                                                                      Thousands
                                                                                                       $8,000
                                                                                                       $7,000
     Amount of renovation needs (Figure 11B) is                                                        $6,000
     closely tied to new capital needs (Figure 11C).                                                   $5,000

     Many agencies had to delay renovations and                                                        $4,000

     repairs as a result of the recession, and since                                                   $3,000
                                                                                                       $2,000
     2010, departments (particularly large ones)
                                                                                                       $1,000
     saw major cuts in available funds. Agencies
                                                                                                           $0
     seem to be shifting from renovation requests                                                                  2010          2011         2012          2013
     to having older facilities that need total re-                                  Lower Quartile              $200,000      $150,000      $250,000     $200,000
                                                                                     Median                     $1,750,000     $800,000     $2,000,000    $836,406
     placement. In addition, there was a significant
                                                                                     Upper Quartile             $7,000,000    $4,800,000    $6,500,000    $4,000,000
     increase in bonds and levies for park and recre-
     ation departments in 2013, and more than 80
     percent were successful.

Figure 10                 Sources of Direct Revenue                           Figure 11C                               New Capital Need
    Facility entry fees/memberships     Programs and class fees and charges                        $16,000
                                                                                       Thousands

    Facility rentals                    Facility or property leases                                $14,000
    Concessions, resale items           Sale of real property                                      $12,000
    Other                                                                                          $10,000
                  0.06%                                                                                $8,000
            4.83%               9.90%                                                                  $6,000
              1.97%                                                                                    $4,000
                                           22.59%                                                      $2,000
                       16.15%                                                                             $0
                                                                                                                   2010          2011          2012          2013
                                                                                     Lower Quartile              $351,200      $108,375      $312,000      $390,000
                                            44.49%
                                                                                     Median                     $2,050,000    $1,937,500    $2,000,000    $2,100,000
                                                                                     Upper Quartile             $10,000,000   $10,100,000   $15,000,000   $9,900,000

                                                                              2014 Parks and recreation national database report                                       9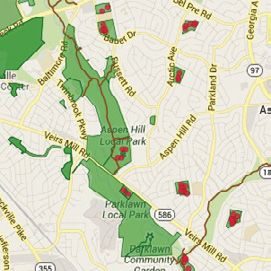
Programming and Attendance

     It’s through programs, classes, organized teams and social services that park and recreation
     departments connect with and teach local residents. Park and recreation professionals can use
     the graphs on these pages to find out how their agency’s programming, program spending and
     attendance stack up against other agencies’ offerings across the country. For tailored compari-
     sons to agencies with similar racial, age or socioeconomic populations, log on to your PRORAGIS
     profile to run a comparison.

     Soon, park and recreation departments across the country will be able to use our GIS program to
     examine distributions of race, age or socioeconomic populations within their district.

     Figure 12         Total Annual Attendance, Programs, Classes, and Small Events
                                    160
                        Thousands

                                    140
                                    120
                                    100
                                     80
                                     60
                                     40
                                     20
                                      0
                                           2010          2011                               2012                      2013
                  Lower Quartile           4,414         3,659                             6,000                      4,443
                  Median                  25,812        15,160                             21,025                    18,000
                  Upper Quartile          137,334       68,039                            101,970                    98,175

     In 2013, the total annual number of par-         Figure 13                         Total Park Attendance
     ticipants attending programs, classes
     and small events (Figure 12) dropped,                                    2,500
                                                                  Thousands

     likely a reflection of smaller depart-
                                                                              2,000
     ments entering their data. Use PRORAG-
     IS to find much more accurate data by                                    1,500
     accessing the online Custom Reports or
                                                                              1,000
     by looking at the Miscellaneous Ratios in
     the Aggregate Custom Analysis Reports.                                    500
     Total park attendance (Figure 13) is also
                                                                                 0
     down, possibly because of the increased                                            2010          2011        2012          2013
     smaller department participation in the                Lower Quartile             57,000        35,847      55,000        50,000
     PRORAGIS survey.                                       Median                    400,000       300,000     300,000       176,535
                                                            Upper Quartile            2,000,000     1,500,000   1,198,083     1,000,000

10         National Recreation and Park Association
Figure 14 Programs Offered by Agencies Park Programming and Attendance Trends
78.8%
Visual arts and crafts 75.7%
76.9% What are some of the overall trends we’re seeing?
75.7%
Fewer agencies are offering programs such as per-
68.5% forming arts programs, martial arts, trips, tours,
Performing arts 64.1%
63.9%
58.5%
organized sports, golf and water safety (Figures
90.2%
14 and 15). The number of agencies offering or-
Health and wellness 84.7% ganized team sports, fitness, health and wellness,
86.2%
85.0% and environmental programs, however, remains
88.4% strong, indicating the importance of these values
86.7%
Fitness
85.7% to communities and their park and recreation de-
86.5% partments for keeping area residents healthy and
70.8%
67.9%
teaching about local environmental health.
Martial arts
68.6%
59.5%
2010
Fewer agencies are also offering summer camps
73.3%
Trips and tours 69.7% 2011
— only 73 percent in 2013, down from 77 percent
69.8%
67.2% in 2012 and more than 80 percent in 2010 — al-
2012
82.9%
though those that do offer summer camps saw av-
2013
Organized team sports 82.6%
83.2%
erage camper attendance per week rise from 98
80.0% participants in 2012 to 125 in 2013.
61.5%
55.1%
Golf program
56.0% Program fees and charges per participant dropped
52.4% significantly (from a median of $25 to $30 in the
80.0%
76.5%
last three years to a median of less than $9 in
Tennis programs
79.7% 2013), likely due to an attempt by agencies to in-
73.4%
crease participation as well as fewer overall pro-
77.1%
Water safety 66.0% grams offered.
68.8%
67.2%
64.7% What does this mean for my agency? Increases
Environmental 59.1%
58.4%
in social services show that these services are
64.2% needed and used. Park professionals can use
these figures — found in more detail in their online
PRORAGIS Custom Report comparisons — to show
Figure 15 Recreation Opportunities Offered how such programs meet community needs and
By Agencies ensure social equity. By examining social service
81.5% offerings within PRORAGIS, park professionals can
78.6%
Summer camp
76.5% determine if their facilities, staff and resources are
72.7%
adequate to meet the social equity needs within
46.5%
44.9% their community. This can assist in developing the
Before- and after-school programs 48.0%
41.8% 2010 total cost of service, allowing the department to
40.0% determine the level of subsidization needed.
33.1% 2011
Preschool
39.0%
32.7% 2012 Likewise, an agency’s figures for health and fitness
9.5%
6.4% 2013 programs and environmental offerings can show
Full daycare 9.0%
6.9% park planners where additional programs, events
69.2%
or classes would benefit both individuals and the
Specific teen programs 62.6%
62.8%
larger community.
60.1%
77.0%
72.9%
How can I know if our agency’s programming is
Senior programs
72.4%
70.4%
worthwhile? Check out the cost-versus-revenue
66.5%
benchmarks on page 13 and compare median
Programs for people with
disabilities
59.6%
61.8%
revenue per visitor, program fees and charges per
59.9% program participant, and operative expenditures
37.8%
43.1%
per visitor with your own figures. For instance, the
Community gardens
41.1%
46.3%
median operating expenditures per capita was
73.1%
$77. Use these benchmarks to begin examining
Major special events 79.3%
82.2%
your own spending.
86.5%
2014 Parks and recreation national database report 11Operations, Maintenance and Benchmarking
This section features just some of the facts and figures describing the size, type, acreage and popu-
lation served that NRPA has collected through the PRORAGIS database. By comparing your agency’s
facility sizes (Figure 16) and type (Figure 17) to the facilities at other similar agencies, you could make
the case for adding certain types of facilities or for increasing budgets for certain expenses. For an ap-
ples-to-apples comparison that’s tailored to your agency, use the Custom Reports tool to find agencies
in your area with comparable budgets and populations.
Figure 16 Square Feet Per Facility, Fiscal Year 2013
Facility Type Lower Quartile Median Upper Quartile
Recreation/Community center 10,169 24,978 50,129
Fitness center 1,600 4,000 9,000
Senior center 4,963 10,000 12,500
Figure 17 Facility Types, Fiscal Year 2013
Median Jurisdiction
Departments Offering
Population Per Facility
Playground 96.1% 3,840
Diamond fields (e.g., baseball/softball) 92.0% 3,403
Rectangular fields (e.g., football/soccer) 89.1% 4,242
Tennis court (outdoor) 85.3% 4,283
Basketball court (outdoor) 84.6% 6,644
Recreation/community center 74.3% 24,645
Swimming pool (outdoor) 59.7% 30,376
Community gardens 47.1% 32,529
Dog park 47.1% 50,852
Golf course (9 holes) 34.7% 29,631
Swimming pool (indoor) 32.8% 61,322
Tennis court (indoor) 9.8% 22,852
12 National Recreation and Park AssociationFigure 18 Acres of Park Maintained
2013 Operating Expenditures per Acre of Land
2013 Acres of Parkland Maintained Per FTE
Managed or Maintained
Lower Upper Lower Upper
Median Median
Number of Acres Quartile Quartile Quartile Quartile
250 or less 6,454 16,523 34,000 2.7 5 9.8
251 to 1,000 3,487 8,974 18,747 6 8.7 19.6
1,001 to 3,500 1,855 4,808 6,904 9 21.6 54.7
More than 3,500 1,213 3,001 3,846 18.4 32.8 66.3
Use the data from Figure 18 to estimate where your agency stands in its spending per acre and in a
staff-to-acres ratio. Keep in mind that factors include equipment used, percentage of parkland that’s
developed, degree of maintenance required and topography. Acres of parkland maintained per full-
time equivalent dropped lower than in recent years, perhaps reflecting an upward turn in hiring.
Benchmarking
Our benchmarking ratios table (Figure 19) can be used to compare your own direct revenue per capita
or acreage of parkland per 1,000 people. Because these figures are given as ratios, these bench-
marks can be used to compare unit costs for small park and recreation departments as well as for
large urban departments.
Figure 19 Miscellaneous Benchmarking Ratios
2010 Median 2011 Median 2012 Median 2013 Median
Operating expenditures per capita $82 $74 $85 $77
Operating expenditures per FTE $94,797 $95,851 $95,237 $84,859
Operating expenditures per acre of land
$6,397 $6,539 $6,538 $7,357
managed or maintained
Acreage of parkland per 1,000 population 14.9 10.5 11.1 9.1
Acres of parkland maintained per FTE 15.6 15.2 13.5 9.1
Revenue per capita $27.56 $19.22 $24.92 $17.04
Revenue as a percent of total operating expense 32.0% 28.2% 30.1% 26.9%
Revenue per visitor $4.52 $3.76 $4.60 $5.11
Total operating expenditures per visitor $14.47 $12.27 $14.17 $16.25
Total capital plus total operating expenditures
$101.14 $85.58 $105.27 $90.46
per capita
Tax cost per capita $47.66 $29.55 $48.30 $54.95
Program attendance per program staffing (FTE) 2,576.7 2,376.9 2,202.8 2,717.0
Program fees and charges per program
$25.74 $31.33 $24.67 $8.84
participant
2014 Parks and recreation national database report 13Geographic Information System and Mapping
Tools embedded within our GIS mapping program can help park professionals plan for programs and
facilities that boost Health and Wellness, Conservation and Social Equity for their communities. For
instance, GIS views reveal proximity of facilities to population centers where underserved people are
in need of places to walk or bike. Other reports may reveal the types of facilities and diversity of trails
offered to residents, and perhaps indicate a need for certain types of new trails or facilities for fitness
and exercise.
Other mapping functions can assist with operations and maintenance issues. Measuring tools may
help in planning for maintenance needs, such as mowing, landscaping and construction requirements.
The Identify tool (Figure 21) allows users to quickly view information about parks and facilities directly
from the map interface. The new Query tool (Figure 22) can help planners quickly locate outdated
facilities that need renovation or replacement.
Just introduced and under continuous improvement, the Population Layers tool (Figure 23) will help park
and recreation departments analyze their community demographics to make better planning decisions.
A population layer showing age distributions could reveal where programs for kids or seniors are needed
most — areas with high percentages of children may need more playgrounds or summer camps, while
areas with more seniors might consider installing warm-water therapy pools for individuals with arthritis
or other conditions associated with aging. Soon, GIS users will be able to view obesity rates layered onto
their map, helping park planners better distribute fitness trails, gym facilities and health classes, and
a crime-rate layer may help with planning and staffing skateparks or other youth facilities. Information
about parks and facilities is exportable to Microsoft Excel using the new Reports feature (Figure 24).
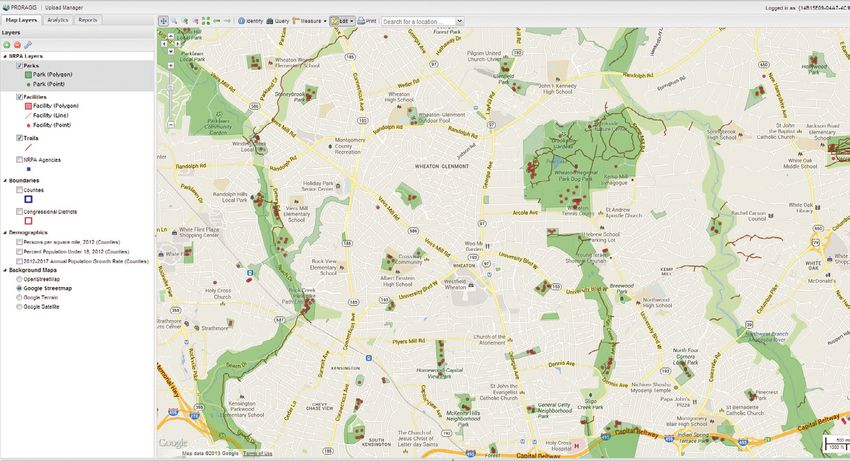
Figure 20 User-Friendly Mapping Interface
As an open-source platform, the new mapping interface functions similarly to desktop-GIS software and has the ability
to connect to external data sources. Here, in this area within Montgomery County, Maryland, parks are shaded dark
green, trails are marked and facility locations are indicated by red dots.
14 National Recreation and Park AssociationFigure 21 New “Identify” Tool Figure 22 New “Query” Tool
With the new “Query” tool, users can search for parks
or facilities that meet certain conditions or criteria —
such as park size or year the park opened. In this ex-
After clicking the “Identify” button on the upper tool- ample, a query shows all parks smaller than five acres
bar, users can easily access detailed information about in a section of Montgomery County, Maryland. Use this
a park or feature by clicking on it. Simply highlight the tool to perform quick searches in your own parks inven-
layers you wish to appear in the map and click the “Iden- tory to help with estimating maintenance costs or study
tify” button; then, click on any park or facility for the pop- park distribution.
up information box.
Figure 23 New Population Layers Figure 24 County Reports
Under the Reports tab, the new County Report feature
Using new available population layers, view county population allows users to access an Excel spreadsheet detailing
information — such as median age by county or percent of any U.S. county’s parks, trails and facilities. Within the
county population under age 5 — layered onto your map. Al- spreadsheet, users will find information including park/
though this function is currently only available for Virginia, it trail/facility names, addresses, types and other informa-
will be available nationwide soon. Figure 23 shows the per- tion, including trail length for each trail, park acres for
cent of the population under age 5 for counties in northern each park and facility type for each facility. Here, a report
Virginia. Counties with higher percentages of small children for Jefferson County, Kansas, shows parks listed in alpha-
(indicated by red) may use this type of mapping data to adjust betical order as well as park type.
planning and development of parks, facilities and programs.
In the near future, users will be able to view population data
broken down even further to Census tract or block level.
2014 Parks and recreation national database report 15Looking Forward
As PRORAGIS continues to mature, trends tied to the three pillars will continue to highlight significant
work that agencies are doing in each of these areas. User agencies will find that their benchmarked
data will gain more statistical significance as more departments input and update their data for com-
parison, and all participating agencies will find themselves equipped with more hard facts and figures
quantifying their impact that they can share with local officials and community members.
NRPA’s research team constantly studies the PRORAGIS database to find shifts and changes in oper-
ations, services and development — trends that can help you in planning for the future. We use our
extensive resources to determine the causes and meanings behind these trends and what they might
mean for your agency and region. For instance, in recent years, climate changes — including more
frequent and intense natural storms — have affected the planning, design and materials used to build
parks and facilities. In addition, these powerful storms have sometimes resulted in higher costs of de-
velopment and maintenance for park facilities, while possibly reducing discretionary funds. Because
of these reductions, we may see more public-private agreements to support programming, cultural
events and upper-skill-level activities begin to emerge in the coming years.
Below are more current trends that may affect how the park and recreation field does business. Here,
we define “Opportunity” as a trend that creates a win for both progressive departments and users.
“Challenges” may present difficult decisions surrounding current operations, but with proper planning,
can create benefits for everyone. “Conflicts” indicate that a trend runs counter to best practices, so
options need to be carefully considered:
PAST AND CURRENT PRACTICES FUTURE DIRECTION PRESENTS…
Programming and Offerings
Focus on service to users who seek their Due to increasing isolation of people of all ages, ethnic- Opportunity
programs in their facilities. ities and locations, outreach programming to traditional
nonparticipating groups may have significant health and
social benefits for communities.
Increasing awareness of immediate health Growing awareness of long-term physical and mental Opportunity
value from activity participation. health value from an active lifestyle.
Programming focus on organized team Individualized sports, e.g., walking, running, swimming Opportunity
sports and activities. and biking, represent the top 10 activities participated in
by active Americans.
Programming focus on organized team Safety issues (concussions) may impact activities such Challenge
sports and activities. as youth tackle football, resulting in options such as flag
football leagues.
Department roles: facility upkeep and Community roles: public health, social transition for Challenge
recreational activities. youth, conservation initiatives in addition to current roles.
Capital Development and Maintenance
Facilities and parks are viewed as costs to Facilities and parks are viewed as long-term benefits to Opportunity
the budget. jurisdictions.
Reasonably stable national weather The unstable weather patterns in recent years and the Opportunity
patterns in recent decades have dictated increased frequency of violent storm events may affect
facility designs and types of materials. planning and design of parks and facilities as they
increase costs.
Both large and small municipalities have Large amounts of infrastructure development were last Conflict
been accruing maintenance deficits in all funded 45 years ago; infrastructure renovation will make
types of infrastructure (e.g., parks, recre- new development funds scarce.
ation facilities, transportation, water and
sewer systems, and similar).
Environment
Open space and natural areas of de- The pervious surface of open space and undeveloped Opportunity
veloped parks are considered valuable parkland has increasing value for mitigating stormwater
additions to the community. runoff and flooding in communities.
16 National Recreation and Park AssociationYou can also read


