Dynamics of Muddy Rain of 15 June 2018 in Nepal - MDPI
←
→
Page content transcription
If your browser does not render page correctly, please read the page content below
atmosphere
Article
Dynamics of Muddy Rain of 15 June 2018 in Nepal
Ashok Kumar Pokharel 1,2, *, Tianli Xu 1 , Xiaobo Liu 1 and Binod Dawadi 1,3
 1   Kathmandu Center for Research and Education, Chinese Academy of Sciences-Tribhuvan University,
     Kathmandu 44613, Nepal; xutianli@itpcas.ac.cn (T.X.); xbliu@itpcas.ac.cn (X.L.);
     dawadibinod@gmail.com (B.D.)
 2   Weather Extreme Ltd., Incline Village, NV 89451, USA
 3   Central Department of Hydrology and Meteorology, Tribhuvan University, Kathmandu 44613, Nepal
 *   Correspondence: ashokpokharel@hotmail.com

 Received: 13 April 2020; Accepted: 15 May 2020; Published: 21 May 2020

 Abstract: It has been revealed from the Modern-Era Retrospective analysis for Research and
 Applications MERRA analyses, Moderate Resolution Imaging Spectroradiometer MODIS/Terra satellite
 imageries, Naval Aerosol Analysis and Prediction System NAAPS model outputs, Cloud –Aerosol Lidar
 and Infrared Pathfinder Satellite Observations CALIPSO imageries, Hybrid Single Particle Lagrangian
 Integrated Trajectory HYSPLIT model trajectories, atmospheric soundings, and observational records
 of dust emission that there were multiple dust storms in the far western parts of India from 12 to
 15 June 2018 due to thunderstorms. This led to the lifting of the dust from the surface. The entry of
 dust into the upper air was caused by the generation of a significant amount of turbulent kinetic
 energy as a function of strong wind shear generated by the negative buoyancy of the cooled air
 aloft and the convective buoyancy in the lower planetary boundary layer. Elevated dust reached a
 significant vertical height and was advected towards the northern/northwestern/northeastern parts of
 India. In the meantime, this dust was carried by northwesterly winds associated with the jets in the
 upper level, which advected dust towards the skies over Nepal where rainfall was occurring at that
 time. Consequently, this led to the muddy rain in Nepal.

 Keywords: thunderstorm; dust storm; muddy rain; transport; convection; buoyancy; turbulent
 kinetic energy

1. Introduction
      It has been found that the lofted dust from wind erosion causes environmental effects at regional
and global scales. Atmospheric dust affects climate globally by altering the radiation balance of the
atmosphere [1,2]. Similarly, high concentrations of dust cause negative health effects [3,4] as well as,
on a regional scale, lower economic status by deteriorating visibility with an increase in the cost of
visibility impairment on national parks and wilderness areas. A positive correlation has been indicated
between drought years and increased dust lofting [5], whereas others indicated that the intrusion
of dust into the atmosphere occurs when freshly deposited sediment caused by the intense storms
becomes dried up [6]. A dust climatology study over the southwestern US mentioned that the annual
mean number of dust events, the annual mean duration of dust events, and the ratio of duration to
number of dust events was directly proportional to the visibility range [7]. This study also found that
the higher the percentage of total seasonal precipitation, the lower the total dust events percentage in
the summer and the winter, and the lower the percentage of total seasonal precipitation, the higher the
total dust event percentage in the spring and the autumn.
      It has been stated that the capability of the wind to deflate the dust particles (erosivity), the soil’s
susceptibility to entrainment (erodibility), and the supply of erodible sediment are three major
controlling factors on the dust emission process [8]. It is found that the downslope winds and the

Atmosphere 2020, 11, 529; doi:10.3390/atmos11050529                          www.mdpi.com/journal/atmosphere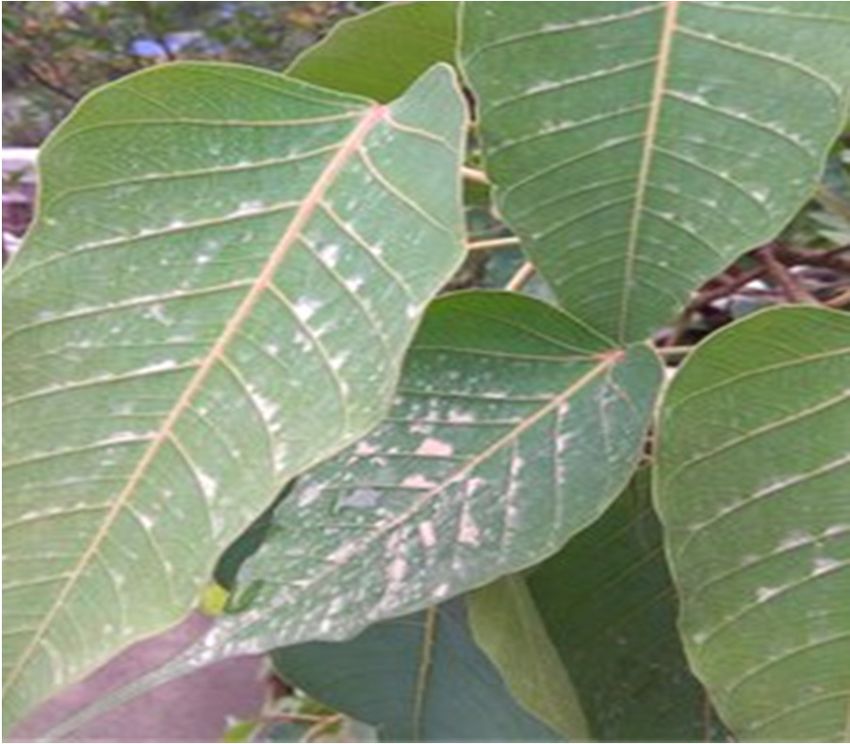
Atmosphere 2020, 11, 529                                                                                 2 of 13

unbalanced adjustment processes in the lee of the mountain ranges are the terrain-induced wind
storms that also lift the dust from the surface, and produce larger-scale dust aerosol mobilization,
and transport [9–13].
      On the other hand, there are some examples that show thunderstorms produce very strong
downburst winds leading to dust storms (i.e., strong and turbulent wind events by which dust is lofted
from the surface and carries clouds of fine dust, soil, and sand over a large area) [14]. In happening
thus, the wall of dust created by this kind of storm can be miles long and several thousand feet
high [15]. In southwest Asia, dust storm activity is also controlled by thunderstorm occurrence,
lifting dust from the ground surface. Though the highest frequency of thunderstorms is during the wet
months—July and August,—there is also substantial thunderstorm activity in May and June, prior to
major precipitation occurrence over this region [16]. Similarly, dust storms are most frequent in the
afternoon, when turbulent mixing is most pronounced, due to the abundant insolation. This was found
in Mexico Basin, where events were associated with strong downdraughts generated by the convective
process-dry thunderstorms [17]. As far as the thunderstorm over Nepal is concerned, lightning activity
starts in March; it intensifies quickly, reaching its peak in May, while in June the activity decreases
rapidly as the southwest monsoon starts [18].
      Due to extreme dust storms of 28 March 2016 over Kathmandu, Nepal and its surrounding areas
there was a significant reduction in visibility (2 km), effects in aviation and ground transportation,
and air quality deterioration. This reveals how vulnerable Nepal is to dust storm and how severely
dust storms affect Nepal. On the other hand, unfortunately there are a lack of studies about the origin
of dust storms, transport and deposition of dust, and a detailed understanding of the climatological
and meteorological characteristics that influence dust event frequency and dust rain dynamics in
Nepal. This type of knowledge is necessary to understand the regional, local dust climatology, and the
atmospheric phenomena that affect the transport and deposition of the dust in Nepal. In this regard,
the study of recent muddy rain (a kind of rain which contains enough dust (e.g., desert dust) to be
clearly visible. This occurs when dust and dirt particles mix with the rain [19] of 15 June 2018 in Nepal,
which might have increased the pH of rain water, has become quite a newsworthy issue as it is a quite
unusual activity over Nepal and its neighbors, and the dust particles can neutralize acid rain in a
manner similar to the way antacids counteract excess acid in an upset stomach [20]. For example,
the increased level of pH was observed in southern Corsica in 1984 when the chemistry of precipitation
mixed with Saharan dust was analyzed [21]. It is to be noted here that based on the findings of previous
studies increase of pH has been suspected during this particular muddy rain. However, this study
does not incorporate any discussion of the possible impacts of pH caused by this particular event due
to beyond the scope of the study.
      According to Meteorological Forecasting Division (MFD) of Nepal, there was a muddy rain over
Nepal on 15 June 2018 [22], which was also observed by the public, as shown in Figure 1. They did
not discuss the detailed atmospheric dynamics regarding the processes responsible for causing that
muddy rain. To address these issues, this study is accomplished, which describes different processes
below. As far as the previous studies of detail atmospheric dynamics of muddy rain in Nepal are
concerned, no such studies have been carried out in Nepal. For the first time, this study will reveal the
scientific understanding of muddy rain dynamics over Nepal.
      Nepal is situated between China in the north and India to the south, east and west (i.e., 26.37◦ –30.07◦ N
and 80.07◦ –88.20◦ E). It is a country of tremendous geographic diversity. Elevation ranges from 59 m in
Terai to Earth’s highest point, the 8848 m Mount Everest. It has a warm temperate climate with dry
winters and hot summers. Average annual precipitation ranges from 160 to 5500 mm.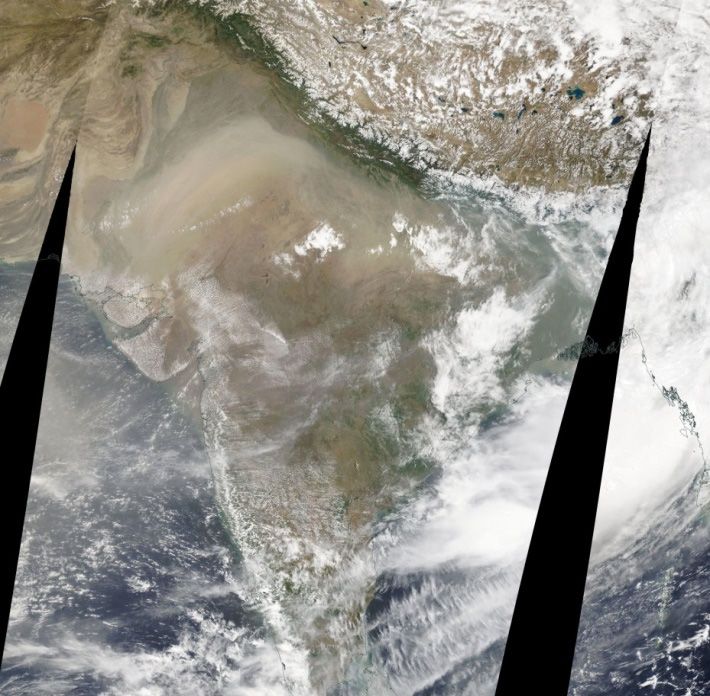
Atmosphere 2020, 11, 529 3 of 13
Atmosphere 2020, 11, x FOR PEER REVIEW 3 of 13
Figure
Figure 1.
1. Red
Red arrow
arrow indicates
indicates deposited
deposited dust
dust on
on leaves
leaves [23].
[23].
Methodology
2. Methodology
For this study, surface meteorological data and a map of regional overview of Indian
subcontinent were
subcontinent werecollected fromfrom
collected the Department
the Department of Meteorology and Hydrology,
of Meteorology and Nepal (DHM-Nepal)
Hydrology, Nepal
and weatherunderground.com
(DHM-Nepal) [24,25]. Satellite
and weatherunderground.com imagery
[24,25]. from
Satellite Moderate
imagery ResolutionResolution
from Moderate Imaging
Spectroradiometer
Imaging (MODIS)/Terra
Spectroradiometer [26] were collected
(MODIS)/Terra [26] wereand analyzed
collected andin depth.
analyzed Forin thedepth.
synopticForscale
the
observational atmospheric processes analysis, the reanalysis datasets of surface
synoptic scale observational atmospheric processes analysis, the reanalysis datasets of surface pressure, geopotential
height, airgeopotential
pressure, temperature,height,
precipitable water, windprecipitable
air temperature, speed and direction,
water, wind andspeed
verticalandmotion obtained
direction, and
from the Modern
vertical motion Era Retrospective-Analysis
obtained from the Modern for Research and Applications (MERRA)
Era Retrospective-Analysis (0.50◦ × 0.67
for Research and ◦)
were used to (MERRA)
Applications make horizontal
(0.50° ×cross
0.67°)sections
were used[27].toVertical cross sections
make horizontal crossof wind speed
sections components
[27]. Vertical cross
and potential
sections of wind temperature were plotted
speed components and from the selected
potential reanalysis
temperature weredatasets.
plottedAn evolution
from of the
the selected
dust by an datasets.
reanalysis aerosol modelling
An evolutionsystem the1◦dust
of at × 1◦ by
horizontal
an aerosolresolution
modellingfrom the Navy
system at 1°Aerosol Analysis
× 1° horizontal
and Prediction
resolution fromSystem
the Navy(NAAPS)
Aerosol[28] was considered.
Analysis and PredictionIn addition
Systemto this, Modern-Era
(NAAPS) Retrospective
[28] was considered. In
Analysis
addition for Research
to this, and Applications-2
Modern-Era Retrospective (MERRA-2)
Analysis model (spatialand
for Research resolution 0.5◦ × 0.625
Applications-2 ◦ ) hourly
(MERRA-2)
datasets(spatial
model were used to analyze
resolution 0.5 ×the dust hourly
0.625°) scattering aerosolwere
datasets optical
usedthickness
to analyze(AOT)the 550 nm
dust of 1 µm
scattering
particulate
aerosol matter
optical [29] over
thickness this region
(AOT) 550 nm of interest.
of 1 μm Rawinsonde data were
particulate matter [29]obtained
over thisfrom theof
region University
interest.
of Wyoming,data
Rawinsonde USAwere [30]. obtained
Similarly,from
the dust backward trajectories
the University of Wyoming, were USAanalyzed using thethe
[30]. Similarly, Hybrid
dust
Single Particle
backward Lagrangian
trajectories Integrated
were analyzedTrajectory
using (HYSPLIT)
the Hybridmodel [31].
Single To analyze
Particle the vertical
Lagrangian reach of
Integrated
dust, imageries
Trajectory of Cloud-Aerosol
(HYSPLIT) model [31].Lidar and Infrared
To analyze Pathfinder
the vertical reach Satellite
of dust, Observation
imageries of(CALIPSO)
Cloud-Aerosol [32]
were
Lidaralso
and taken
InfraredintoPathfinder
account. Satellite Observation (CALIPSO) [32] were also taken into account.
3. Results
3. Results and
and Discussion
Discussion
3.1. Observation
3.1. Observation of of Dust
Dust Storms
Storms from
from Some
Some Surface
Surface Stations
Stations
Locations of
Locations of surface
surface stations
stations close
close to
to the
the area
area of
of dust
dust storms
storms is
is shown
shown inin the
the regional
regional overview
overview
◦N
of Indian subcontinent (Figure 2) [24,25]. Observational data of Safdarjung Airport, India (28.58
of Indian subcontinent (Figure 2) [24,25]. Observational data of Safdarjung Airport, India (28.58° N
77.21◦ E)
77.21° E) and
and Sardar
Sardar Vallabhbhai
Vallabhbhai Patel Patel International Airport, India
International Airport, (23.07◦ N
India (23.07° 72.63◦ E)
N 72.63° E) archived
archived by by
Weather Underground (Table 1) indicated that dust storms hit Safdarjung
Weather Underground (Table 1) indicated that dust storms hit Safdarjung Airport, India at 5:45 toAirport, India at 5:45 to
8:45 a.m. (local time) on 12 June 2018 with westerly/west-northwesterly winds
8:45 a.m. (local time) on 12 June 2018 with westerly/west-northwesterly winds ranging from 6.26 to ranging from 6.26
to 8.05
8.05 msm s−1 speed;
−1 speed; at 5:45
at 5:45 to 11:45
to 11:45 a.m.a.m.
on 13onJune
13 June
20182018
withwith westerly
westerly windwind
rangingranging
fromfrom 7.60
7.60 to to
9.39
9.39 m s −1 ; at 3:45 to 8:45 a.m. on 14 June 2018 with west-southwesterly wind ranging from 4.47 to
ms−1 ; at 3:45 to 8:45 a.m. on 14 June 2018 with west-southwesterly wind ranging from 4.47 to 7.15
ms s−1at
7.15−1;mand ; and
3:45atto3:45
5:45toa.m.
5:45ona.m.
15 on
June152018
June with
2018 west/west-southwesterly
with west/west-southwesterlywinds winds ranging
ranging fromfrom
6.26
6.26 to 7.60 m s −1 speed. Similarly, Sardar Vallabhbhai Patel Intl Airport, India experienced dust storms
to 7.60 ms speed. Similarly, Sardar Vallabhbhai Patel Intl Airport, India experienced dust storms at
−1
at 6:45
6:45 to 11:45
to 11:45 a.m.a.m.(local(local
time)time)
of 12 of
June12 2018
Junewith
2018westerly/southwesterly/west-southwesterly
with westerly/southwesterly/west-southwesterly winds
ranging from 4.02 to 5.36 ms−1; at 4:15 a.m. to 11:15 p.m. (local time) of 13 June 2018 with
westerly/southwesterly/west-southwesterly winds ranging from 2.68 to 6.26 ms−1; at 12:45 a.m. to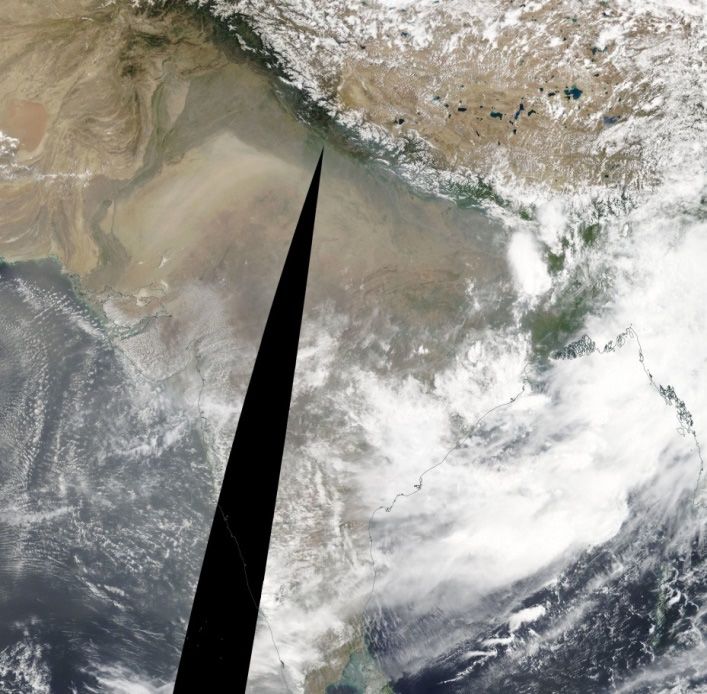
to 11:45                Westerly
  Safdarjung Airport,            2018                       9.39
                                               Am
         India
                                            3:45 Am
                              14 June                     4.47 to
                                             to 8:45                West-southwesterly
                               2018                         7.15
                                               Am
                              15 June       3:45 Am       6.26 to
Atmosphere 2020, 11, 529                                            West/west-southwesterly                      4 of 13
                               2018         5:45 Am         7.60
                                            6:45 Am
                              12 June                     4.02 to
                                            to −1
                                               11:45                Westerly/Southwesterly/West-southwesterly
winds ranging from 4.022018     to 5.36 m sAm     ; at 4:15 5.36
                                                            a.m. to 11:15 p.m. (local time) of 13 June 2018 with
westerly/southwesterly/west-southwesterly   4:15 Am       winds ranging from 2.68 to 6.26 m s−1 ; at 12:45 a.m.
                              13 June                     2.68 to
to 11:15 p.m. (local time) of 14 June       to 11:152018 with south-southwesterly/west-southwesterly
                                                                    Westerly/Southwesterly/West-southwesterly   winds
   Sardar Vallabhbhai          2018                         6.26
ranging    from    2.68  to 7.15  m   s−1 ; andPm at 5:45 a.m. to 5:45 p.m. (local time) of 15 June 2018 with
   Patel International
                                           12:45 Am
southwesterly/south-southwesterly/west-southwesterly
     Airport, India           14 June                     2.68 to   winds ranging from 2.68 to 7.70 m s−1 . Hence,
                                            to 11:15                South-southwesterly/West-southwesterly
                               2018
this clearly shows that there were multiple                 7.15
                                                        dust storms in the far western parts of India from 12 to
                                               Pm
15 June of 2018. It is to be noted here     5:45that
                                                 Am prior to these event days (e.g., 10–11 June 2018), there was
                              15 June                     2.68 to
no precipitation and the 2018                to 5:45
                                flow of strong wind 7.70            Southwesterly/South-southwesterly/West-southwesterly
                                                            at Safdarjung  Airport and Sardar Vallabhbhai Patel
                                               Pm
International Airport, India.

     Figure   2. Observation
      Figure 2.  Observation of
                             of dust
                                dust storms
                                     storms from
                                            from some
                                                 some surface
                                                      surface stations
                                                              stations are
                                                                       are shown
                                                                           shown byby red
                                                                                      red coloured
                                                                                          coloured triangles
                                                                                                   triangles
     in the map of regional overview of Indian subcontinent [24,25]. A triangle, which is shown in the side
      in the map of regional overview of Indian subcontinent [24,25]. A triangle, which is shown in the side
     of Himalyas, represents Safdarjung Airport, India, and another triangle represents Sardar Vallabhbhai
      of Himalyas, represents Safdarjung Airport, India, and another triangle represents Sardar
     Patel International Airport, India. Rawinsonde sounding station at Ahamadabad in India is also shown
     by a yellow coloured star.

                         Table 1. Surface weather data observed at two stations of India [24].

  Name of Surface        Date of                                  Wind Speed
                                             Local Time                                               Wind Direction
     Stations          Dust Storms                                  (m s−1 )
                       12 June 2018     5:45 a.m. to 8:45 a.m.    6.26 to 8.05   Westerly/West-northwesterly

 Safdarjung Airport,   13 June 2018     5:45 a.m. to 11:45 a.m.   7.60 to 9.39   Westerly
        India          14 June 2018     3:45 a.m. to 8:45 a.m.    4.47 to 7.15   West-southwesterly
                       15 June 2018       3:45 a.m. 5:45 a.m.     6.26 to 7.60   West/west-southwesterly
                       12 June 2018     6:45 a.m. to 11:45 a.m.   4.02 to 5.36   Westerly/Southwesterly/West-southwesterly
 Sardar Vallabhbhai    13 June 2018     4:15 a.m. to 11:15 p.m.   2.68 to 6.26   Westerly/Southwesterly/West-southwesterly
 Patel International
   Airport, India      14 June 2018   12:45 a.m. to 11:15 p.m.    2.68 to 7.15   South-southwesterly/West-southwesterly
                       15 June 2018     5:45 a.m. to 5:45 p.m.    2.68 to 7.70   Southwesterly/South-southwesterly/West-southwesterly

3.2. Dust Storms and the Dust Advection
      The MODIS/Terra images [26] captured useful images of massive dust storms of thick dust over
the far West to Northwest to North of India from 12 June to 15 June 2018, as shown in Figure 3a–d,
respectively. Although these figures are not able to indicate the exact location and the time of the
initiation of the dust storm, based on the earliest available images among them and observational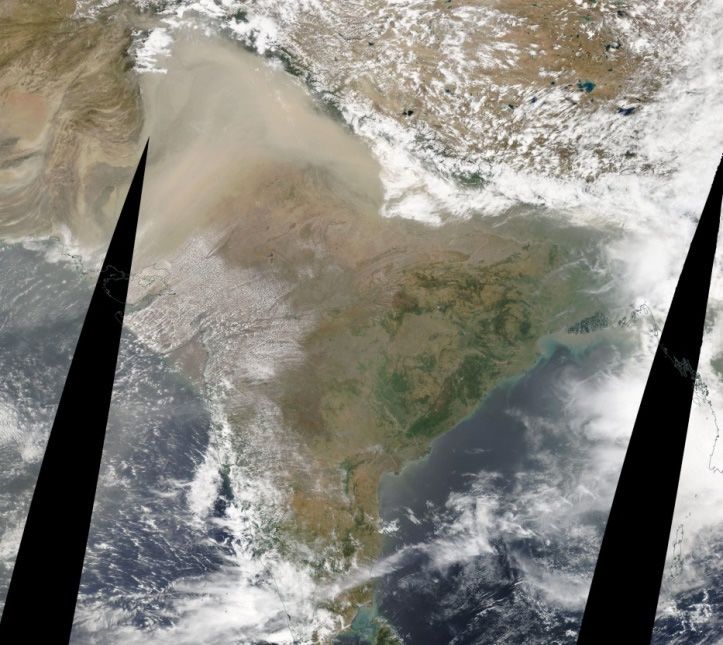
Vallabhbhai Patel International Airport, India. Rawinsonde sounding station at Ahamadabad in
     India is also shown by a yellow coloured star.

3.2. Dust Storms and the Dust Advection
      The MODIS/Terra images [26] captured useful images of massive dust storms of thick dust over
    Atmosphere 2020, 11, 529                                                                                   5 of 13
the far West to Northwest to North of India from 12 June to 15 June 2018, as shown in Figure 3a–d,
respectively. Although these figures are not able to indicate the exact location and the time of the
initiation of the dust
    information,         storm,
                    it can       based onthat
                             be inferred  the the
                                              earliest
                                                    firstavailable
                                                          lifting ofimages among
                                                                     dust was      them and
                                                                               initiated    observational
                                                                                         around  26.3◦ N 73.01◦ E on
information, it can be inferred that the first lifting of dust was initiated around 26.3° N 73.01° E on 12
    12 June 2018 (Figure 3a).
June 2018 (Figure 3a).

                                   (a)                                                        (b)

                                 (c)                                                          (d)

         Figure 3.     Dust storms images captured by moderate resolution imaging spectroradiometer
     Figure 3. Dust storms images captured by moderate resolution imaging spectroradiometer
         (MODIS)/Terra
     (MODIS)/Terra    (1 km(1resolution)
                              km resolution)  on 12–15
                                         on 12–15       June ((a),
                                                  June 2018  2018(b),
                                                                   ((a–d),  respectively
                                                                       (c), and          [26]). Pink
                                                                                (d), respectively     colored
                                                                                                  [26]). Pink circles area
         show
     colored    the area
             circles dustshow
                          plume theareas
                                    dust of western
                                         plume areasto
                                                     ofnorthwestern    to northern
                                                       western to northwestern    to parts of India.
                                                                                     northern  parts of India.

   3.3. Synoptic Overview from the MERRA
        Based on the 0.50◦ × 0.67◦ MERRA reanalysis datasets [27], a meso-α/synoptic observational
   analysis was carried out to find out the roles of different atmospheric processes from the surface to the
   mid-troposphere at different time intervals that may have generated this particular favorable muddy
   rain environment. The mid tropospheric synoptic overview from the MERRA shows that there was a
   positively tilted trough (oriented along a southwest-northeast axis) in the far western/southwestern
   parts of India and southwestern/southern parts of Nepal from 12 June 2018 (Figure 4a). Over time,
   the geopotential height consistently showed a positively tilted trough (the presence of trough indicates
   the condition of static instability below it, the generation of strong positive vorticity advection, and the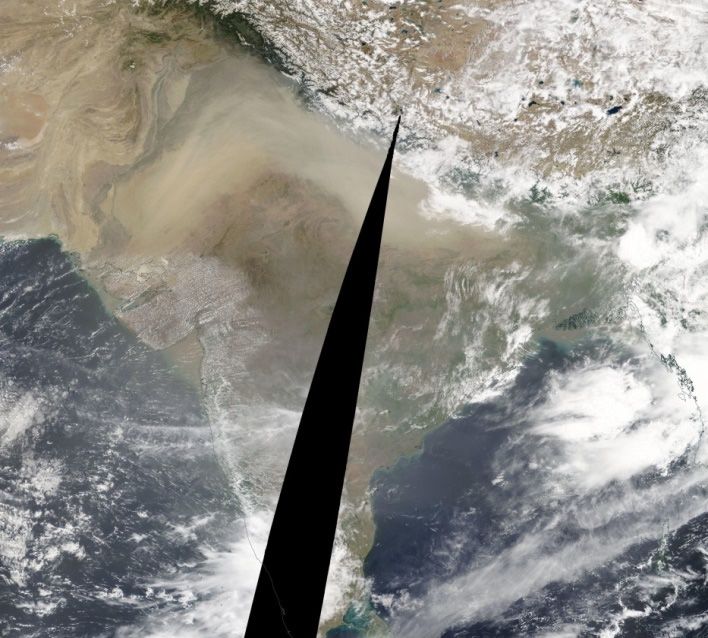
Atmosphere 2020, 11, 529                                                                              6 of 13

creation of differential temperature advection (i.e., upper level and low-level fronts)) with falling
heights rotated cyclonically to be oriented more southern to southwestern across Nepal till 15 June 2018
(Figure 4b). On 0630 UTC of 12 June 2018 a jet at 500 hPa (causes the upper level forcing) was
propagating from northwest of India to western to southern to eastern parts of Nepal, respectively,
with further amplification over time; therefore, it was continuously advancing on its way, influencing
the trough. The baroclinic amplification of the jet streak was consistent with the deepening of the trough
at that time. Similarly, on 0000 UTC of 15 June 2018, there were a juxtaposition of the jet with lower level
mesoscale jetlet between 700 and 850 hPa, referring to a possible coupling between the upper and lower
level wind maxima. Due to the presence of the upper level trough and the strong jet over our region of
interest it can be inferred that the combination of these lift mechanisms played significant roles for
occurrence of thunderstorms leading to downburst, kicking up the dust (Figure 3a–d), and carrying
the lofted dust into Nepal for causing a muddy rainfall over there. These processes are also discussed
in different sub-sections below.

3.4. Evolution of the Dust by an Aerosol Modeling of Navy Aerosol Analysis and Prediction System (NAAPS)
and Dust Scattering AOT by MERRA-2
     The NAAPS model is an additional supporting information regarding the occurrence of dust
storm data in aforesaid region of few observations. It is a 1◦ × 1◦ resolution aerosol model that depicts
dust predictions at 6-h intervals [28], is also used to diagnose the beginning and subsequent multiple
occurrences of dust storms over our region of interest. This model reveals the evolution of the dust,
including the concentration of sulfate over the region, and it can be related to the strength and track of
the dust transport over time. It is important to note that sulfate was associated with the initial emission
of the dust into the atmosphere, and over time, due to the lower density associated with sulfate
compared with dust it remains for a relatively long period of time in the environment. Though the
concentration of sulfate is lower than the dust in the composite form of the initial emission of the total
material from the surface, over time, sulfate can be recognized due to its longevity in the atmosphere
more than the dust due to its lower density. Here, we analyzed the NAAPS aerosol modeling image
from 0000 UTC of June 12 to 15, 2018. NAAPS shows that the strongest signal of dust and sulfate
emission into the atmosphere was largely over the 20–22◦ N 68–74◦ E region at 0600 to 1800 UTC of
13 June 2018 (Figure 5a–b). At 1800 UTC of 14 June 2018 and onwards, the strength and areal extension
of the dust and sulfate materials increased and mostly advected towards the northwest/north/northeast
region of India and its neighbors, 22–35◦ N 68–88◦ E (Figure 5c). Similarly, MERRA-2 model shows
that the dust-scattering AOT reached up to 0.874 when the intrusion of dust reached in maximum
vertical height in early of 14 June 2018 in the western parts of Nepal; and over time this value was
diluted [29] when the dust was advected towards the eastern parts of Nepal.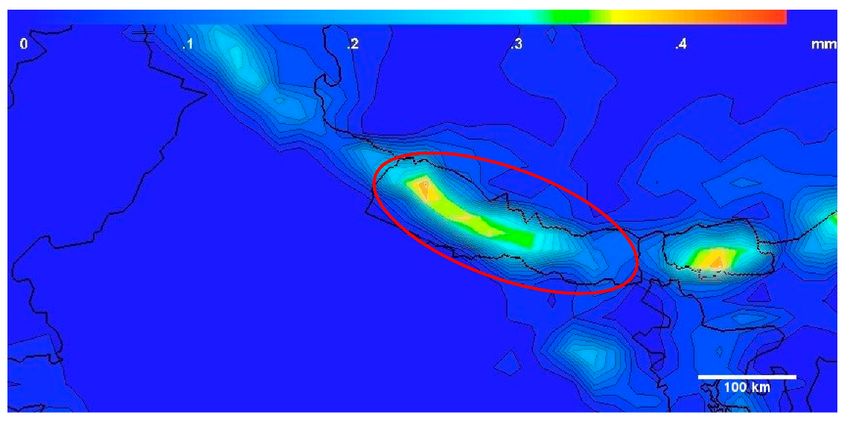
Atmosphere 2020, 11, 529                                                                                                                                                                                7 of 13
Atmosphere 2020, 11, x FOR PEER REVIEW                                                                            7 of 13

                                                 (a)                                                                                                 (b)

          Figure
     Figure  4. (a) 4. (a) Geopotential
                    Geopotential             height
                                     height and      and
                                                  wind    wind speed/direction
                                                        speed/direction  at 500 hPaatat500
                                                                                        0630hPa  at on
                                                                                               UTC  0630  UTC2018.
                                                                                                       12 June   on 12TheJune  2018.colored
                                                                                                                            yellow    The yellow    colored
                                                                                                                                            circle shows   thecircle
                                                                                                                                                               flow shows     thethe
                                                                                                                                                                     of jet and    flow of jet and the white
                                                                                                                                                                                      white
          dotted    line   indicates  a  trough   axis from  the  Modern-Era      Retrospective    analysis   for  Research   and   Applications    MERRA      reanalysis
     dotted line indicates a trough axis from the Modern-Era Retrospective analysis for Research and Applications MERRA reanalysis with horizontal resolution of 0.5 ×       with   horizontal  resolution of
              ◦
           [27].×The
     0.67°0.5           ◦
                  0.67light[27]. The
                              blue   light blue
                                   colored  circlecolored circle
                                                   shows the     shows
                                                              area      thestorm
                                                                   of dust   area of dust
                                                                                   and the storm  and the outbreak;
                                                                                            thunderstorm    thunderstorm     outbreak; (b)
                                                                                                                        (b) Geopotential    Geopotential
                                                                                                                                          height and wind height     and windatspeed/direction
                                                                                                                                                             speed/direction       500 hPa         at 500 hPa
     on 0930   UTC on
          on 0930    UTC  15 on
                             June152018.
                                    JuneThe   yellow
                                           2018.  The colored
                                                       yellow circle shows
                                                               colored       theshows
                                                                        circle   flow ofthe
                                                                                         jet flow
                                                                                             and the
                                                                                                  of white
                                                                                                     jet anddotted   line indicates
                                                                                                               the white            a trough
                                                                                                                           dotted line        axis from
                                                                                                                                         indicates       the Modern-Era
                                                                                                                                                    a trough   axis from theRetrospective
                                                                                                                                                                                Modern-Era Retrospective
     analysis  for Research
          analysis             and Applications
                      for Research                 (MERRA)
                                      and Applications        reanalysis
                                                           (MERRA)       with horizontal
                                                                       reanalysis          resolution of
                                                                                    with horizontal                 of 0.5◦ × 0.67◦ [27].
                                                                                                          0.5 × 0.67°[27].
                                                                                                       resolution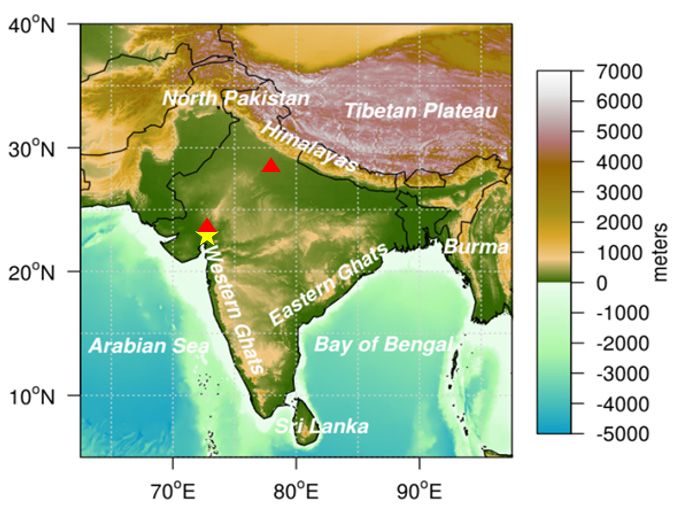
Atmosphere 2020, 11, 529 8 of 13
Atmosphere 2020, 11, x FOR PEER REVIEW 8 of 13
(a) (b)
(c)
Figure5.5.(a)
Figure (a)Dust
Dustconcentration (μg/m33) at
concentration (µg/m at 0060
0060 UTC on 13 June 2018 (Green (Green and
and yellow
yellow show
show the
the
dustand
dust andredredshows
showssulfate
sulfate (horizontal
(horizontal resolution of 11◦× ×1°))
resolution of 1◦ ))
[28]; (b)(b)
[28]; Dust
Dustconcentration
concentration(μg/m 3)
3) at
(µg/m
at1200
1200UTC
UTCon on1313June
June2018
2018(Green
(Greenand and yellow
yellowshow
show the the dust
dust andand redred shows
shows sulfate
sulfate (horizontal
(horizontal
resolution ◦
1 × ◦
1°)) [28]; (c) Dust concentration (μg/m 33) at 1800 UTC on 14 June 2018 (Green and yellow
resolution 1 × 1 )) [28]; (c) Dust concentration (µg/m ) at 1800 UTC on 14 June 2018 (Green and yellow
showthe
show thedust
dustand
andred
redshows
showssulfate
sulfate( (horizontal
horizontalresolution
resolution of of 11◦××1°))
1◦ ))[28].
[28].
3.5.
3.5.Rawinsonde
RawinsondeSoundings
SoundingsAnalyses
Analyses
To
Toobserve
observethe thevertical
verticaltemperature
temperatureand and wind
wind speed/direction
speed/direction profiles at different different atmospheric
atmospheric
pressure levels close to
pressure levels close to the the time period of the muddy rainfall in Nepal, the
period of the muddy rainfall in Nepal, the rawinsonde sounding rawinsonde sounding of
ofAhamadabad
Ahamadabad(23.06° ◦
(23.06N,N,72.63° ◦
72.63 E)E)ininIndia Indiaobtained
obtainedfrom fromUniversity
UniversityofofWyoming,Wyoming,USA USA[30] [30] was
was
analyzed
analyzedfromfrom12–1512–15June
June2018
2018(Figure
(Figure 6). 6). Since
Since this sounding
sounding stationstation is is close
close to
to the
the possible
possible dust dust
sources
sourceswe weexpect
expectthatthatthe
theinformation
information regarding
regarding the the vertical profiles of different different meteorological
meteorological
variables
variablesfrom
fromthese
thesestations
stationscould
couldbe bewell
wellrepresented
represented in in this
this analysis. sounding at
analysis. A sounding at Ahamadabad
Ahamadabad
(23.06 ◦ NN
(23.06° 72.63 ◦ E),E),
72.63° which
which is close
is close to theto the possible
possible areaarea
of a of
dusta dust
storm,storm,
at 1200at 1200
UTC UTCof June of12,
June2018 12,shows
2018
shows the likely condition of a thunderstorm because of the value
the likely condition of a thunderstorm because of the value of the convective available potential energyof the convective available
potential
(CAPE) energy
(1438 J/kg)(CAPE)
and the(1438
liftedJ/kg)
indexand the lifted
(−9.76) at thatindex
time(−9.76) at that time
(i.e., responsible for(i.e., responsible
lifting mechanism), for
lifting mechanism),
generation of the triggergeneration
effect due of tothethetrigger effect
presence ofdue
warm to the presence
air and moistureof warm air and
at a lower moisture
level (shown atbya
lower level (shown by the value of the dew point, ◦
which is greater than
the value of the dew point, which is greater than 21 C and veering directional change of wind 45 or 21 °C and veering directional ◦
change
more fromof wind
surface 45°toor700
more
hPa,from
850surface
to 700 hPato 700 hPa,was
wind 850 10.3
to 700m/shPa wind
(i.e., was 10.3jet)
low-level m/s or(i.e.,
greaterlow-level
in the
jet) or greater
observed in theand
sounding), observed sounding),
the presence of theand the presence
trough and jet as ofdiscussed
the troughinand the jet as discussed
earlier in the
section. Hence,
earlier
there wassection. Hence, there
a combination of high was a combination
planetary boundary of layer
high (PBL)
planetary boundary
moisture, stronglayer (PBL) moisture,
directional and wind
strong
shear, directional
low convective and wind shear,
inhibition, CAPE, low convective
and lifting inhibition,
mechanisms. CAPE, and lifting mechanisms.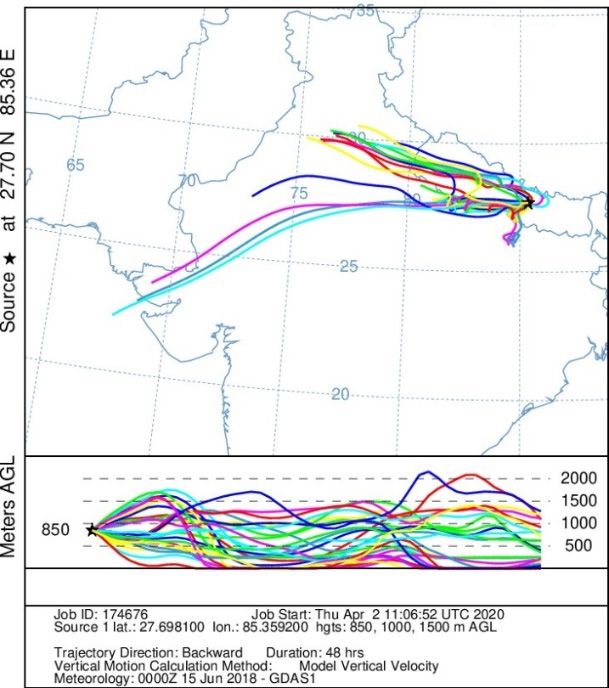
Atmosphere 2020, 11, 529 9 of 13
Atmosphere 2020, 11, x FOR PEER REVIEW 9 of 13
Figure Figure
6. Atmospheric sounding
6. Atmospheric observed
sounding observedatatAhamadabad, India
Ahamadabad, India at at 1200
1200 UTCUTC onJune
on 12 12 June 2018 [30].
2018 [30].
In addition to this, the sounding, which is presented in Figure 6, is inverted and “V”-shaped and
In addition to this, the sounding, which is presented in Figure 6, is inverted and “V”-shaped
is also showing that the dew point depression decreased significantly with height, dry air (low RH) in
and isthe
also showing
lower that the
troposphere withdew point
nearly depression
saturated air (highdecreased
RH) in thesignificantly with height,
middle troposphere, dry air (low
the presence
RH) inofthe lower separating
inversion troposphere the with
dry air nearly saturated
aloft and the moist airair
(high
nearRH) in the middle
the surface, and the troposphere,
convective the
presence of inversion
condensation separating
level (CCL) at a highthe dry air
elevation. aloftthis
Hence, and the moist
“V”-shaped air near
sounding thethat
reveals surface,
there was and the
convective condensation level (CCL) at a high elevation. Hence, this “V”-shaped sounding reveals
a quite appropriate condition for the generation of a strong downdraft from the severe thunderstorm.
For example,
that there was a when quiteanappropriate
inversion (also known as for
condition cap)the
existed from the surface
generation to a certain
of a strong height, heat,
downdraft from the
moisture, and instability could have built under this “capping” inversion. Over time, once the cap
severe thunderstorm. For example, when an inversion (also known as cap) existed from the surface
broke due to the addition of daytime sensible heating, then explosive convection occurred resulting in
to a certain height, heat, moisture, and instability could have built under this “capping” inversion.
wind gusts. This was due to the entrain of dry air aloft into the downdraft. This promoted evaporative
Over time,
coolingonce the cap
and further broke due
enhanced to the buoyancy
the negative addition of ofa daytime
parcel. Insensible
this case, heating, thenof explosive
a cold parcel air
convection occurred resulting in wind gusts. This was due to the entrain
surrounded by warm air descended faster than the surrounding air since the cold air was denser, of dry air aloft into the
downdraft.
and coolerThisairpromoted evaporative
is often noticed cooling
at the surface whenand further enhanced
the downburst air reachesthe negativeWhen
the observer. buoyancy
this of a
parcel.cooler air interacted
In this case, a with
coldtheparcel
warm buoyant
of air air column present
surrounded by in the lower
warm air troposphere,
descendedasfaster indicated
than the
by the sounding above, there was a lifting of the dust to 740 hPa and upward
surrounding air since the cold air was denser, and cooler air is often noticed at the surface when the caused by the generation
of the significant amount of turbulent eddies. This turbulence was the result of the summation of
downburst air reaches the observer. When this cooler air interacted with the warm buoyant air
the strong wind shear and the buoyancy, as suggested by [33]. All these aforesaid processes were
column present in the lower troposphere, as indicated by the sounding above, there was a lifting of
consequences of the thunderstorm and its effect in Ahamadabad and its surroundings. This is consistent
the dust
withtothe 740 hPa andofupward
observation dust storm caused
observed by atthe generation
Sardar of the
Vallabhbhai Patelsignificant
Intl Airport,amount of ◦turbulent
India (23.07 N,
eddies.72.63
This turbulence
◦ E), was the result of the summation of the strong wind
which is very close to this sounding station in Ahamadabad, as already mentioned in the shear and the buoyancy,
as suggested by [33]. All these aforesaid processes were consequences of the thunderstorm and its
earlier section.
effect in Ahamadabad and its surroundings. This is consistent with the observation of dust storm
3.6. Analyses of Backward Trajectory and Vertical Reach of Dust
observed at Sardar Vallabhbhai Patel Intl Airport, India (23.07° N, 72.63° E), which is very close to
this soundingThe station
HYSPLIT in model is run with
Ahamadabad, as full ensemble
already set-up, in
mentioned producing
the earliera variety
section. of parcel back
trajectories [31], as shown in Figure 7. It is used here to compute air parcel trajectories and the
deposition or dispersion of lofted dust from the source of dust to recipient of it (e.g., to find out where
3.6. Analyses of Backward Trajectory and Vertical Reach of Dust
did the dust come from to Nepal). In other words, this is used here to establish whether a high level of
dustHYSPLIT
The at one location (e.g.,is
model Nepal)
run iswith
caused
fullbyensemble
the transport of air contaminants
set-up, producing from anotherof
a variety location.
parcel back
For this analysis, Kathmandu (27.72◦ N, 85.32◦ E) in Nepal is considered as a recipient point.
trajectories [31], as shown in Figure 7. It is used here to compute air parcel trajectories and the
deposition or dispersion of lofted dust from the source of dust to recipient of it (e.g., to find out
where did the dust come from to Nepal). In other words, this is used here to establish whether a high
level of dust at one location (e.g., Nepal) is caused by the transport of air contaminants from another
location. For this analysis, Kathmandu (27.72° N, 85.32° E) in Nepal is considered as a recipient
point.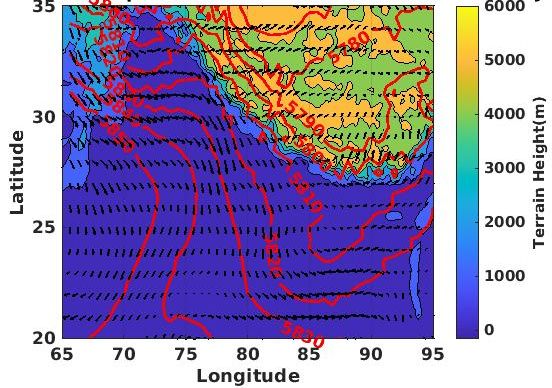
Atmosphere 2020, 11, 529 10 of 13
Atmosphere 2020, 11, x FOR PEER REVIEW 10 of 13
Figure 7. Figure
Backward Trajectory
7. Backward Trajectory by the
by the Hybrid
Hybrid SingleLagrangian
Single Particle Particle Integrated
Lagrangian Integrated
Trajectory (HYSPLIT)Trajectory
(HYSPLIT) model [31] ending at 2300 UTC on 15 June 2018.
model [31] ending at 2300 UTC on 15 June 2018.
HYSPLIT back trajectories of 10 to 16 June of 2018 combined with MODIS satellite imageries have
HYSPLIT back
provided trajectories
insight into whetherofhigh
10 to 16 June
muddy of caused
rain was 2018 combined with MODIS
by local air pollution sources or satellite
whether imageries
have provided
dust wasinsight
blown into
in thewhether highthe
wind. Further, muddy
backward rain was caused
trajectories (Figureby local air
7) clearly inferpollution
that the airsources or
parcel laden with dust was transported from the western parts (between 22 ◦ N 72◦ E and 27◦ N to
whether dust was blown in the wind. Further, the backward trajectories (Figure 7) clearly infer that
77◦ E) of India to Nepal (e.g., Kathmandu), as shown by the higher air currents. This also reveals
the air parcel laden with dust was transported from the western parts (between 22° N 72° E and 27°
that Thar desert of both Rajasthan and Gujarat states of India, which lie in the western part of India,
N to 77° E) of as
served India
a dusttosource
Nepal (e.g.,
in this Kathmandu),
particular event. as shown by the higher air currents. This also
reveals that Thar
This desert of bothby
is also supported Rajasthan and Gujarat
CALIPSO images states
[32], which of India,
show that which
the vertical reachlie
of in
dustthe
waswestern
6 km part of
(Figure 8a,b). This infers that when the dust
India, served as a dust source in this particular event. reached such a height, the strong westerly/northwesterly
current of air at that height, as discussed in an earlier section, advected dust towards the sky of Nepal,
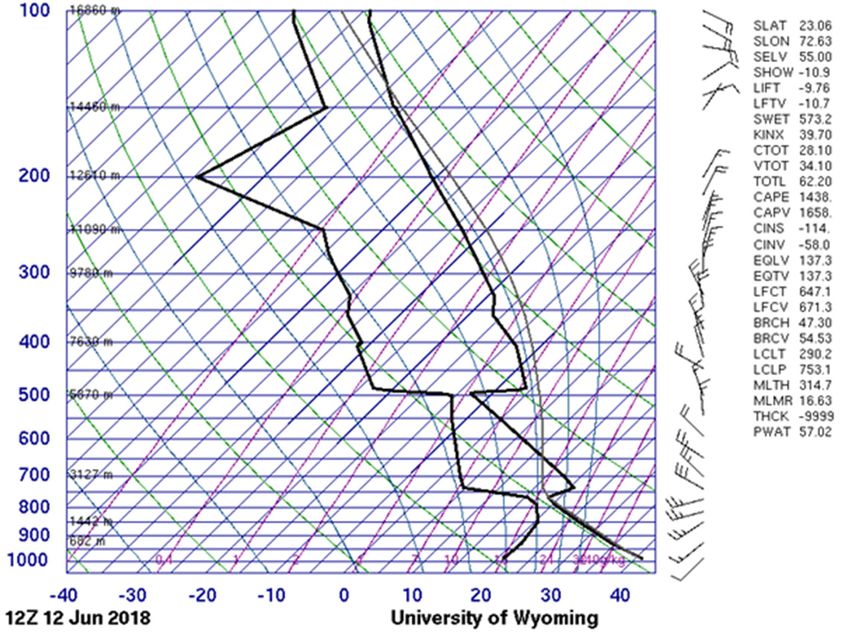
This is also supported by CALIPSO images [32], which show that the vertical reach of dust was
where the precipitable water was present at that time (Figure 9), leading to muddy rain in Nepal.
6 km (Figure 8a,b). This infers that when the dust reached such a height, the strong
westerly/northwesterly current of air at that height, as discussed in an earlier section, advected dust
towards the sky of Nepal, where the precipitable water was present at that time (Figure 9), leading to
muddy rain in Nepal.Atmosphere 2020, 11, 529 11 of 13
Atmosphere 2020, 11, x FOR PEER REVIEW 11 of 13
Atmosphere 2020, 11, x FOR PEER REVIEW 11 of 13
(a)
(a)
(b)
(b)
Figure 8.8. (a)
(a) Vertical
Vertical stretch
stretch of dust at 20:42:26.8
20:42:26.8 to 20:55:55.4
20:55:55.4 UTC on 13 June
June 2018 captured
captured by
Figure
Figure 8. (a) Vertical stretch ofof dust
dust at
at 20:42:26.8 to
to 20:55:55.4 UTC
UTC onon 13
13 June 2018
2018 captured by by
CALIPSO
CALIPSO [32].
[32]. The
The red
red circled
circled areaarea shows
shows vertical
vertical reachreach
of of
dust; dust;
(b) (b)
VerticalVertical
stretch stretch
of dust atof dust at
20:30:08.0
CALIPSO [32]. The red circled area shows vertical reach of dust; (b) Vertical stretch of dust at
20:30:08.0
to 20:43:36.7to UTC
20:43:36.7
on 15 UTC on 15captured
June 2018 June 2018by captured
CALIPSO.by CALIPSO. The redshows
circled area shows
20:30:08.0 to 20:43:36.7 UTC on 15 June 2018 captured byThe red circled
CALIPSO. Thearea
red circledvertical reach
area shows
vertical
of dust. reach of dust.
vertical reach of dust.
Figure 9. Total precipitable
9. Total precipitable water
water in in mm (shown
(shown in legend at upper part of Figure) over Nepal
Figure 9. Total precipitable water in mm (shown in legend at upper part of Figure) over Nepal
(shown by a red coloured circle area)
area) atat 1830
1830 UTC
UTC on
on 15
15 June
June 2018
2018 from
from the
the MERRA
MERRA reanalysis
reanalysis with
(shown by a red coloured circle area) at 1830 UTC on 15 June 2018 from the MERRA reanalysis with
horizontal resolution of 0.5◦××0.67°.
of 0.5 0.67◦ .
horizontal resolution of 0.5 × 0.67°.Atmosphere 2020, 11, 529 12 of 13
4. Conclusions
There were big surges of dust storms in the far western parts of India, especially Ahamadabad
and its surroundings, caused by thunderstorms from 12 to 15 June 2018, intermittently. There was a
lifting of dust into the upper air caused by the generation of significant amount of turbulent kinetic
energy as a function of strong gust wind, which had strong wind shear, and the convective buoyancy
at the lower boundary layer during the descending outflow of cold air caused by the generation of a
severe thunderstorm. When this lofted dust in the upper air came into contact with prevailing winds,
such as northwesterly/westerly associated with the jets, as discussed in the earlier sections, upper air
dust was advected towards Nepal, where rainfall was occurring, led to the muddy rain in Nepal.
Hence, the study of this particular event reveals that western parts of India were dust source regions
(i.e., Thar desert of both Rajasthan and Gujarat states of India, which plays a significant role as a source
of emission of dust caused by the dust storms during the months of March–June every year [34]) from
which dust was transported to Nepal as a long range transport. As this finding is still based on the
low-resolution datasets, it would be better if it could be done on the high-resolution datasets so that
the details of finer temporal and spatial processes, such as emission to transport to the deposition of
dust in this particular event, could be further understood. In addition to this, there is a need for more
cases in order to establish the representativeness of the event presented here.
Author Contributions: Conceptualization, methodology, software, validation, formal analysis, investigation,
and writing, A.K.P.; resources and project administration, T.X., X.L., and B.D. All authors have read and agreed to
the published version of the manuscript.
Funding: This research is funded by Kathmandu Center for Research and Education (KCRE), Chinese Academy
of Sciences (CAS)—Tribhuvan University (TU).
Acknowledgments: We would like to thank Tandong Yao and Tao Wang for their helpful advice and support.
Also, thanks goes to Kathmandu Center for Research and Education, Chinese Academy of Sciences-Tribhuvan
University, Kathmandu, Nepal for providing financial support for this study.
Conflicts of Interest: The authors declare no conflict of interest.
References
1. Seinfeld, J.; Carmichael, G.; Arimoto, R.; Conant, W.; Brechtel, F.; Bates, T.; Cahill, T.; Clarke, A.; Doherty, S.;
Flatau, P.; et al. ACE-ASIA: Regional climatic and atmospheric chemical effects of Asian dust and pollution.
Bull. Am. Meteor. Soc. 2004, 85, 367–380. [CrossRef]
2. Tegen, I. Modeling the mineral dust aerosol cycle in the climate system. Quat. Sci. Rev. 2003, 22, 1821–1834.
[CrossRef]
3. Appel, B.; Tokiwa, Y.; Hsu, J.; Kothny, E.; Hahn, E. Visibility as related to atmospheric aerosol constituents.
Atmos. Environ. 1985, 19, 1525–1534. [CrossRef]
4. Chan, Y.; Simpson, R.; Mctainsh, G.; Vowles, P.; Cohen, D.; Bailey, G. Sourceapportionment of
visibility degradation problems in Brisbane (Australia)—Using the multiple linear regression techniques.
Atmos. Environ. 1999, 33, 3237–3250. [CrossRef]
5. Okin, G.S.; Reheis, M.C. An ENSO predictor of dust emission in the southwestern United States.
Geophys. Res. Lett. 2002, 29. [CrossRef]
6. Reheis, M.; Kihl, R. Dust deposition in southern Nevada and California, 1984 1989: Relations to climate,
source area, and source lithology. J. Geophys. Res. 1995, 100, 8893–8918. [CrossRef]
7. Pokharel, A.; Kaplan, M. Dust Climatology of the NASA Dryden Flight Research Center (DFRC) in Lancaster,
California, USA. Climate 2017, 5, 15. [CrossRef]
8. Okin, G.S.; Gillette, D.A.; Herrick, J.E. Multi scale controls on and consequences of Aeolian process in
landscape change in arid and semi-arid environments. J. Arid Environ. 2006, 65, 253–275. [CrossRef]
9. Pokharel, A.; Kaplan, M.; Fiedler, S. Subtropical Dust Storms and Downslope Wind Events. J. Geophys.
Res. Atmos. 2017, 122, 10. [CrossRef]
10. Pokharel, A.; Kaplan, M. Organization of dust storms and synoptic scale transport of dust by Kelvin waves.
Earth Syst. Dynam. 2019, 10, 651–666. [CrossRef]Atmosphere 2020, 11, 529 13 of 13
11. Pokharel, A.; Kaplan, M.; Fiedler, S. The Role of Jet Adjustment Processes in Subtropical Dust Storms.
J. Geophys. Res. Atmos. 2017, 122, 12. [CrossRef]
12. Pokharel, A.; Kaplan, M.; Fiedler, S. Atmospheric Dynamics of the Harmattan Surge on March 2, 2004.
In Proceedings of the 2nd International Conference on Atmospheric Dust–DUST 2016, Taranto, Italy,
12–17 June 2016; pp. 85–93. [CrossRef]
13. Pokharel, A. Atmospheric Dynamics of Sub-Tropical Dust Storms. Ph.D. Thesis, University of Nevada,
Reno, USA, 2016. Available online: https://ui.adsabs.harvard.edu/abs/2016PhDT98P/abstract (accessed on
3 February 2020).
14. Brazel, A.; HSU, S. The climatology of hazardous Arizona dust storms. Desert Dust 1981, 186, 293–303.
[CrossRef]
15. SciJinks. Available online: https://scijinks.gov/dust-storm/ (accessed on 3 February 2020).
16. Goudie, A.; Middleton, N. Dust storms in South West Asia. Acta Universitatis Carilinae Suppl. 2000, 73–83.
17. Jauregui, E. The dust storms of Mexico City. Int. J. Climatol. 1989, 9, 169–180. [CrossRef]
18. Baral, K.N.; Mackerras, D. The cloud flash-to-ground flash ratio and other lightning occurrence characteristics
in Kathmandu thunderstorms. J. Geophys. Res. 1992, 97, 931–938. [CrossRef]
19. Zifa, W.; Hiromasa, U. Modelling of Long Range Transport of Yellow Sand and Muddy Rain in East Asia; Annuals
of Disasters Prevention Research Institute, Kyoto University: Kyoto, Japan, 1999; No. 42 B-1.
20. Hedin, L.; Likens, G. Atmospheric Dust and Acid Rain. Sci. Am. 1996, 275, 88–92. [CrossRef]
21. Loÿe-Pilot, M.D.; Martin, J.M.; Morelli, J. Influence of Saharan dust on the rain acidity and atmospheric input
to the Mediterranean. Nature 1986, 321, 427–428. [CrossRef]
22. The Himalayan. Available online: http://thehimalayantimes.com/nepal/kathmandu-valley-receives-muddy-
rain/ (accessed on 3 February 2020).
23. Twitter. Available online: https://twitter.com/rupajoshi/status/1007806022805700608/photo/1 (accessed on
3 February 2020).
24. Weather Underground. Available online: Weatherunderground.com (accessed on 3 February 2020).
25. Stolbova, V.; Martin, P.; Bookhagen, B.; Marwan, N.; Kurths, J. Topology and seasonal evolution of the
network of extreme precipitation over the Indian subcontinent and Sri Lanka. Nonlin. Processes Geophys.
2014, 21, 901–917. [CrossRef]
26. MODIS/Terra. Available online: https://worldview.earthdata.nasa.gov (accessed on 3 February 2020).
27. MERRA. Available online: https://disc.sci.gsfc.nasa.gov/mdisc/data-holdings/merra/merra_products_nonjs.
shtml (accessed on 3 February 2020).
28. NAAPS. Available online: https://www.nrlmry.navy.mil/aerosol_web/ (accessed on 3 February 2020).
29. MERRA-2/Giovanni. Available online: https://giovanni.gsfc.nasa.gov/giovanni/ (accessed on 3 February 2020).
30. University of Wyoming sounding. Available online: http://weather.uwyo.edu/upperair/sounding.html
(accessed on 3 February 2020).
31. HYSPLIT. Available online: https://www.ready.noaa.gov/HYSPLIT.php (accessed on 5 March 2020).
32. CALIPSO. Available online: https://www-calipso.larc.nasa.gov/tools/data_avail/index.php?d=2018 (accessed on
5 March 2020).
33. Stull, R. Meteorology for Scientists and Engineers, 2nd ed.; Brooks Cole: Pacific Grove, CA, USA, 1999.
34. Sarkar, S.; Chauhan, A.; Kumar, R.; Singh, R.P. Impact of deadly dust storms (May 2018) on air quality,
meteorological, and atmospheric parameters over the northern parts of India. GeoHealth 2019, 3, 67–80.
[CrossRef] [PubMed]
© 2020 by the authors. Licensee MDPI, Basel, Switzerland. This article is an open access
article distributed under the terms and conditions of the Creative Commons Attribution
(CC BY) license (http://creativecommons.org/licenses/by/4.0/).You can also read