Regulatory Investment Test for Distribution - Ergon Energy
←
→
Page content transcription
If your browser does not render page correctly, please read the page content below
Regulatory Investment
                   Test for Distribution

         Non-Network Options Report

  Cannonvale 66 kV Reinforcement

                                            This document describes the identified need for
                                            investment at Cannonvale. It includes description of
                                            the likely network options and to the extent possible,
                                            the characteristics of non-network options which
                                            may, either alone or in combination with network or
                                            other non-network options, represent a feasible
                                            solution for addressing the identified need.

                      Consultation Period Starts: 24 June 2019
     Consultation Period Closes: 19 September 2019

Disclaimer
While care was taken in preparation of the information in this Non Network Options Report, and it is provided in good faith, Ergon Energy
Corporation Limited accepts no responsibility or liability for any loss or damage that may be incurred by any person acting in reliance on this
information or assumptions drawn from it. This document has been prepared for the purpose of inviting information, comment and
discussion from interested parties. The document has been prepared using information provided by a number of third parties. It contains
assumptions regarding, among other things, economic growth and load forecasts which may or may not prove to be correct. All information
should be independently verified to the extent possible before assessing any investment proposal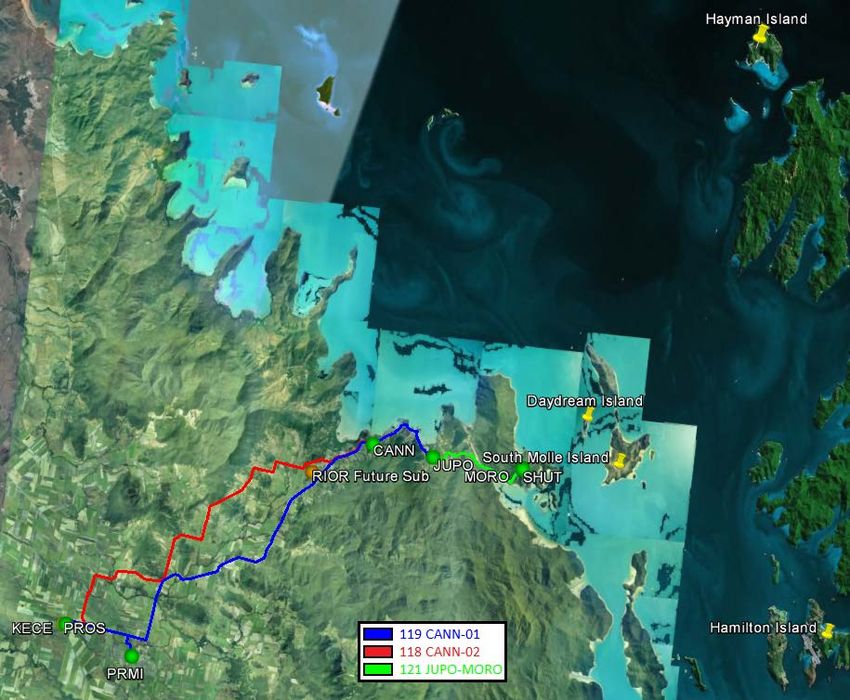
RIT-D Non-Network Options Report: Cannonvale 66 kV Reinforcement

Executive Summary
Ergon Energy Corporation Limited (Ergon Energy) is responsible (under its Distribution Authority)
for electricity supply to the Cannonvale / Airlie Beach area in North Queensland.

The Airlie Beach region is a nationally and internationally renowned tourism hub in North
Queensland located approximately 100 km north of Mackay. In addition to being a holiday
destination in its own right, Airlie Beach is the major tourism gateway to the Whitsunday Islands.

Ergon Energy’s 66 kV sub-transmission and distribution networks supply approximately
7,198 premises in the area, with major customers including Proserpine Sugar Mill, Hamilton Island,
Hayman Island, South Molle Island, Daydream Island and numerous hotels and marinas.

The customer base of 7,198 premises including the major international and national holiday
destinations of Airlie Beach and Hamilton, Hayman and Daydream Islands are supplied from radial
66 kV timber pole sub-transmission lines with no overhead earth-wire.

The combination of both the existing manual 66 kV switching arrangement at Cannonvale and the
radial supply has resulted in frequent outages. This has contributed to over 50 % of the ‘Urban’ and
‘Short Rural’ MSS categorised feeders supplied from this network experiencing ‘Amber’ or ‘Red’
class reliability in three of the last four years. This has also contributed to regular supply
interruptions to the island resorts.

The CANN-01 66 kV feeder cable entering the switchyard at CANN recently failed in January 2017.
It is probable that other failures in cables of this same type and age will occur over the next few
years as all cables in and out of CANN are of similar type and vintage as the failed CANN-01 entry
cable. Additionally, the transformer 66 kV circuit breakers at Cannonvale are planned for
replacement due to a known potentially explosive failure mode.

Ergon Energy’s preferred internal solution at this stage is to:
   •   Upgrade the Cannonvale 66/11 kV substation to a fully switched 66 kV yard (including the
       replacement of the 66 kV cables around Cannonvale).

This is a Non-Network Options Report, where Ergon Energy is seeking information about possible
solutions to address the identified need, which may be able to be provided by parties other than
Ergon Energy.

Ergon Energy is committed to the implementation of Non-Network Solutions to reduce the scope or
need for traditional network investments. Our approach to demand management is listed in
Chapter 7 of our Distribution Annual Planning Report but involves early market engagement
around emerging constraints as well as effective use of existing mechanisms such as the Demand
Side Engagement Strategy and Regulatory Investment Test for Distribution (RIT-D). We see that
the increasing penetration and improving functionality of customer energy technology, such as
embedded generation, Battery Storage Systems and Energy Management Systems, have the
potential to present a range of new non-network options into the future.

The primary investment driver for this project is AUGEX, supporting customer growth and network
security. A successful Non-Network Solution may be able to assist in reducing the scope or timing
for this project.

                                                                                                   page 1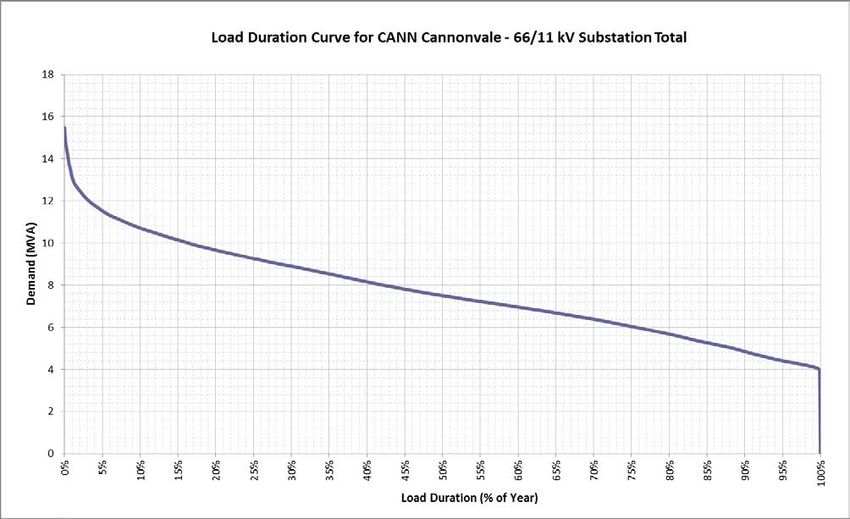
RIT-D Non-Network Options Report: Cannonvale 66 kV Reinforcement

Submissions in writing (electronic preferably) are due by 19 September 2019 and should be
lodged to Ergon Energy’s “Regulatory Investment Test for Distribution (RIT-D) Partner Portal”. The
portal is available at:

           https://www.ergon.com.au/network/network-management/network-
                       infrastructure/regulatory-test-consultations

For further information and inquiries please refer to the “Regulatory Investment Test for Distribution
(RIT-D) Partner Portal”.

                                                                                                  page 2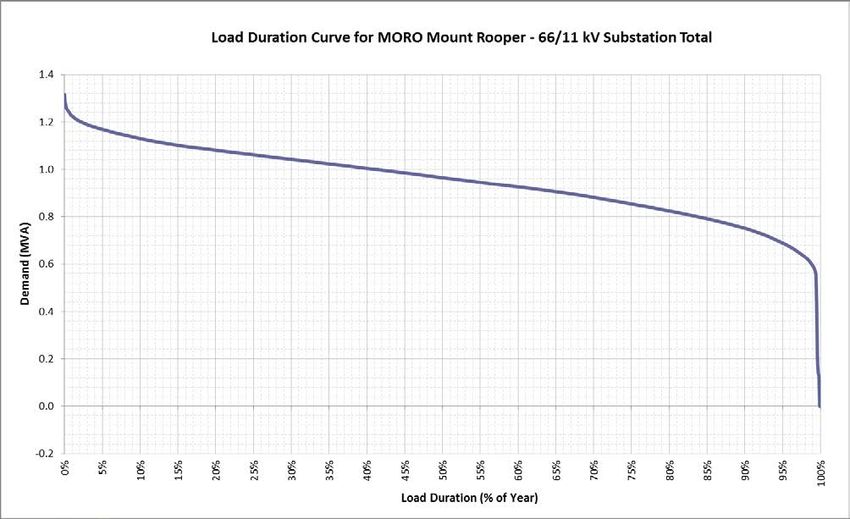
RIT-D Non-Network Options Report: Cannonvale 66 kV Reinforcement

Table of Contents
Executive Summary ........................................................................................................................ 1
Table of Contents............................................................................................................................ 3
List of Figures and Tables ............................................................................................................... 4
1.     Introduction .............................................................................................................................. 5
2.     Background.............................................................................................................................. 6
     2.1.    Geographic Region ........................................................................................................... 6
     2.2.    Existing Supply System .................................................................................................... 7
3.     Identified Need......................................................................................................................... 8
     3.1.    Description of the Identified Need ..................................................................................... 8
       3.1.1.       Low Reliability due to Reliance on Manual Switching at Cannonvale ......................... 8
       3.1.2.       Aged and Poor Condition Asset Replacement ........................................................... 9
       3.1.3.       Cable Constraints .................................................................................................... 10
     3.2.    Quantification of the Identified Need ............................................................................... 10
       3.2.1.       Reliability Impacts .................................................................................................... 10
       3.2.2.       Sub-transmission Network Limitations ..................................................................... 11
4.     Value of Customer Reliability ................................................................................................. 12
5.     Load Profiles .......................................................................................................................... 14
     5.1.    Cannonvale (CANN) 66/11 kV Substation....................................................................... 14
     5.2.    Jubilee Pocket (JUPO) 66/11 kV Substation ................................................................... 15
     5.3.    Mount Rooper (MORO) 66/11 kV Substation .................................................................. 17
     5.4.    Shutehaven (SHUT) 66/11 kV Substation ....................................................................... 19
6.     Assumptions in Relation to Identified Need ............................................................................ 20
     6.1.    Forecast Maximum Demand ........................................................................................... 20
     6.2.    Load Profile .................................................................................................................... 20
     6.3.    System Capability – Line Ratings.................................................................................... 21
7.     Technical Characteristics of Non-Network Options ................................................................ 21
     7.1.    Size ................................................................................................................................ 21
     7.2.    Location .......................................................................................................................... 21
     7.3.    Timing ............................................................................................................................. 22
       7.3.1.       Implementation Timeframe ...................................................................................... 22
       7.3.2.       Time of Year ............................................................................................................ 22
     7.4.    Compliance with Regulations & Standards ..................................................................... 22
     7.5.    Longevity ........................................................................................................................ 22
8.     Feasible vs Non Feasible Options.......................................................................................... 22
     8.1.    Potentially Feasible Options............................................................................................ 22

                                                                                                                                          page 3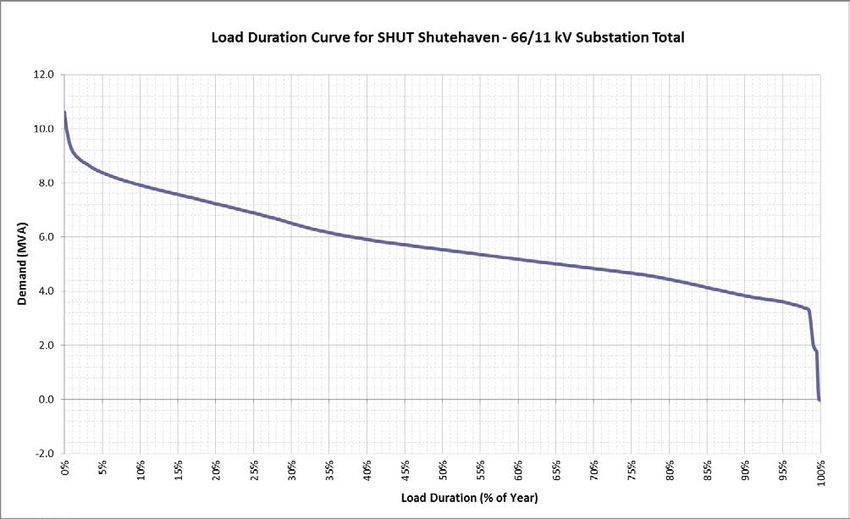
RIT-D Non-Network Options Report: Cannonvale 66 kV Reinforcement

     8.2.      Options that are Unlikely to be Feasible .......................................................................... 23
9.     Internal Options Identified ...................................................................................................... 23
     9.1.      Non-Network Options Identified ...................................................................................... 23
     9.2.      Distribution Network Options Identified ........................................................................... 23
10.         Submissions & Next Steps ................................................................................................. 24
     10.1.        Submissions from Solution Providers .......................................................................... 24
     10.2.        Next Steps................................................................................................................... 24

List of Figures and Tables
Figure 1: Cannonvale / Airlie Beach 66 kV Sub-transmission Network ............................................ 6
Figure 2: Existing 66 kV Sub-transmission Network ........................................................................ 8
Figure 3: Cannonvale (CANN) 66/11 kV Substation Existing Arrangement ..................................... 9
Figure 4: Outage Duration & Time of Occurrence of Sub-transmission Faults............................... 11
Figure 5: Forecast Substation & Feeder Loads (Including Contingency Arrangements) ................ 12
Figure 6: Lost Energy VCR Values due to Lack of Switchyard at Cannonvale .............................. 13
Figure 7: Historical Load of Cannonvale Substation (Since 2004) ................................................. 14
Figure 8: Cannonvale Average & Peak Weekday Load Profile (Summer) ..................................... 15
Figure 9: Cannonvale Load Duration Curve .................................................................................. 15
Figure 10: Historical Load of Jubilee Pocket Substation (Since 2010) ........................................... 16
Figure 11: Jubilee Pocket Average & Peak Weekday Load Profile (Summer) ............................... 16
Figure 12: Jubilee Pocket Load Duration Curve ............................................................................ 17
Figure 13: Historical Load of Mount Rooper Substation (Since 2002) ........................................... 17
Figure 14: Mount Rooper Average & Peak Weekday Load Profile (Summer)................................ 18
Figure 15: Mount Rooper Load Duration Curve ............................................................................. 18
Figure 16: Historical Load of Shutehaven Substation (Since 2000) ............................................... 19
Figure 17: Shutehaven Average & Peak Weekday Load Profile (Summer) ................................... 19

Table 1:        Sub-transmission Fault Locations (Since 2010) ........................................................ 10
Table 2:        Cannonvale / Airlie Beach Supply Region Customer Breakdown ............................ 13
Table 3:        AEMO VCR Values for Different Customer Types ..................................................... 13
Table 4:        Line Rating Parameters ............................................................................................... 21
Table 5:        Demand Reduction Required...................................................................................... 21
Table 6:        Ergon Energy’s Internal Cost for the Preferred Option............................................. 23

                                                                                                                                       page 4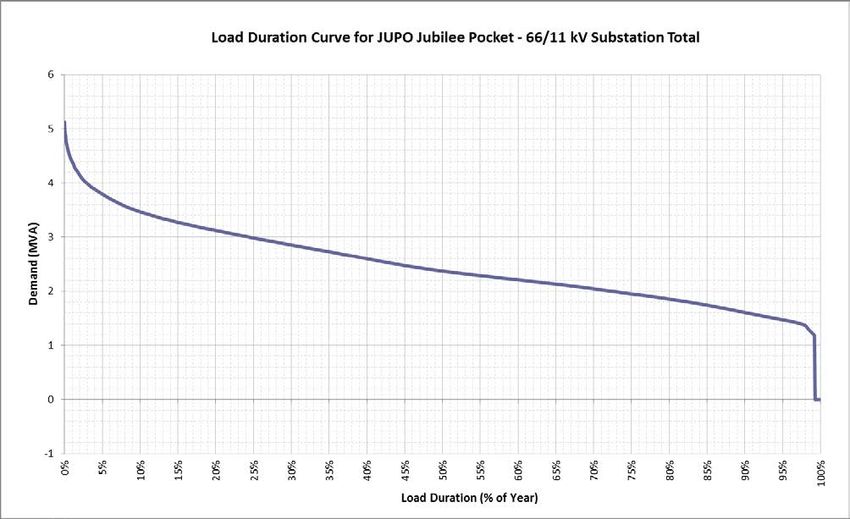
RIT-D Non-Network Options Report: Cannonvale 66 kV Reinforcement
1. Introduction
This Non Network Options Report has been prepared by Ergon Energy in accordance with the
requirements of clause 5.17.4(e) of the National Electricity Rules (NER).
This report represents the first stage of the consultation process in relation to the application of the
Regulatory Investment Test for Distribution (RIT-D) on potential credible options to address the
identified limitations in the distribution network that supplies the Cannonvale / Airlie Beach area.
This report:
• Provides background information on the network capability limitations of the distribution
network supplying the Cannonvale / Airlie Beach area.
• Identifies the need which Ergon Energy is seeking to address, together with the
assumptions used in identifying and quantifying that need.
• Describes the credible options that Ergon Energy currently considers may address the
identified need, including for each:
Its technical definitions;
The estimated commissioning date; and
The total indicative cost (including capital and operating costs).
• Sets out the technical characteristics that a non-network option would be required to deliver
in order to address the identified need.
• Is an invitation to registered participants and interested parties to make submissions on
credible options to address the identified need.
In preparing this RIT-D, Ergon Energy is required to consider reasonable future scenarios. With
respect to possible future loads and development, Ergon Energy has, in good faith, included as
much detail as possible while maintaining necessary customer confidentiality. At the time of
writing, Ergon Energy considers the most probable future scenario to be that there will be
significant future development in the Airlie Beach, Cannonvale and Riordanvale area, and has
developed this Non Network Options Report (including Internal Options) principally on this basis. It
is noted that customer activity can occur over the consultation period and may change the timing
and/or scope of any proposed solutions.
Submissions in writing (electronic preferably) are due by 19 September 2019 and should be
lodged to Ergon Energy’s “Regulatory Investment Test for Distribution (RIT-D) Partner Portal”. The
portal is available at:
https://www.ergon.com.au/network/network-management/network-
infrastructure/regulatory-test-consultations
For further information and inquiries please refer to the “Regulatory Investment Test for Distribution
(RIT-D) Partner Portal”.
page 5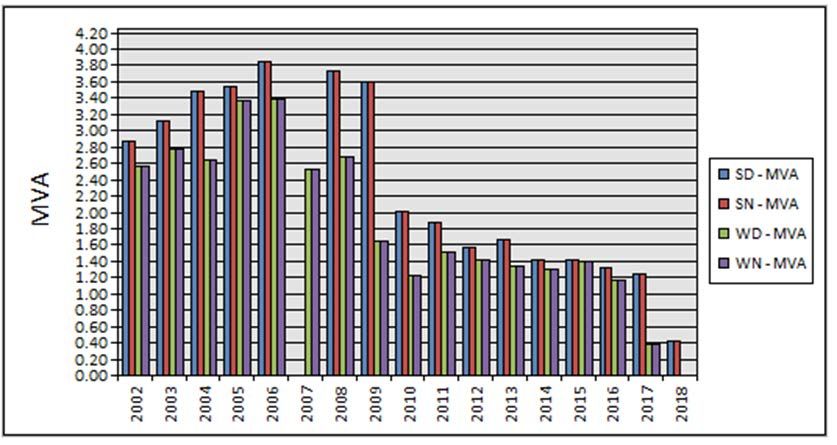
RIT-D Non-Network Options Report: Cannonvale 66 kV Reinforcement
2. Background
2.1. Geographic Region
The geographic region covered by this RIT-D is the Cannonvale substation and surrounding 66 kV
sub-transmission network. The network in this area consists of approximately 7,198 customers,
with major customers including Proserpine Sugar Mill, Hamilton Island, Hayman Island, South
Molle Island and Daydream Island, and is located in the Mackay area of the Northern Region of
Ergon Energy’s Network.
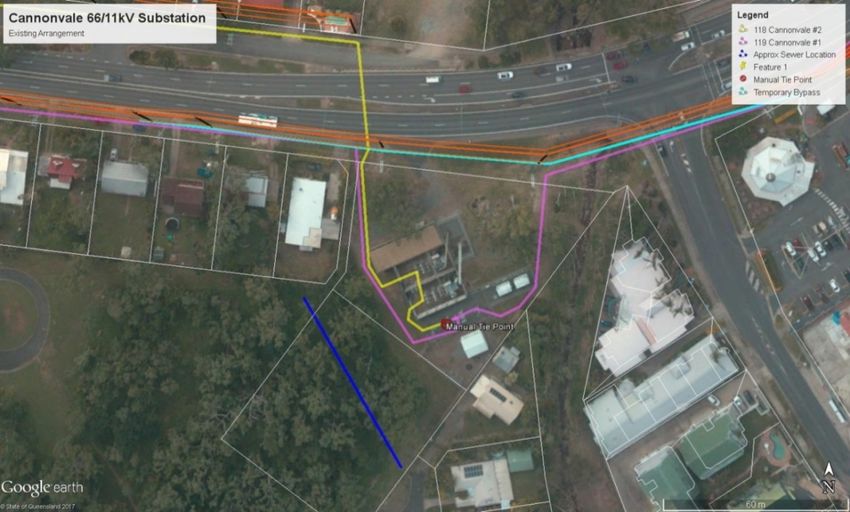
The geographical location of Ergon Energy’s 66 kV sub-transmission network and substations in
the Cannonvale / Airlie Beach area is illustrated in the Google Earth image below.
Figure 1: Cannonvale / Airlie Beach 66 kV Sub-transmission Network
page 6
RIT-D Non-Network Options Report: Cannonvale 66 kV Reinforcement

2.2.    Existing Supply System

The Cannonvale / Airlie Beach area is supplied from Cannonvale (CANN) 66/11 kV, Jubilee Pocket
(JUPO) 66/11 kV, Mount Rooper (MORO) 66/11 kV and Shutehaven (SHUT) 66/22 kV zone
substations.

Cannonvale (CANN) substation presently supplies 5,442 customers and has two 15 MVA 66/11 kV
transformers which have an N-1 transformer cyclic and long term emergency cyclic rating of
18.9 MVA and 20.0 MVA respectively. Two 4.8 MVAr 11 kV capacitor banks can minimise the
transformer load and improve the substation power factor however their primary function is to
provide voltage support during 66 kV feeder outages and network re-configuration.

Jubilee Pocket (JUPO) substation currently supplies 1,674 customers via one 32 MVA 66/11 kV
OLTC transformer, three 11 kV feeders and a 4.8 MVAr 11 kV capacitor bank which also provides
66 kV network support under contingency conditions. JUPO was constructed with a fully switched
66 kV bus and outgoing 66 kV feeder to Mt Rooper. A spare 66 kV feeder bay will accommodate a
future second feeder from CANN. There is also a second cold standby 32 MVA 66/11 kV OLTC
transformer on-site which has been retained as an in-situ spare.

Mount Rooper (MORO) substation currently supplies 80 customers including the major 11 kV
customer Daydream Island/South Molle Island via privately owned submarine cables and an 11 kV
mainland connection point and recloser. The substation has a single 5 MVA 66/ 11 kV fixed tap
transformer that supplies unregulated 11 kV to the islands, however a set of 100 A voltage
regulators supplies the 11 kV Shute Harbour feeder and approx. 79 customers. There is a N/O
11 kV feeder tie to the Mandalay feeder from JUPO.

Shutehaven (SHUT) substation currently supplies two customers including the major 22 kV
customer Long Island/Hamilton Island via privately owned 22 kV submarine cables and a 22 kV
mainland connection point and recloser. The 22 kV submarine cable to Hayman Island is owned by
Ergon Energy. On the island, a fixed tap 5 MVA 22/11 kV transformer supplies the resort via an
11 kV connection point. SHUT has one 25 MVA 66/22 kV OLTC transformer.

Proserpine Mill (PRMI) substation has a single 10/12 MVA 66/11 kV OLTC transformer that
currently supplies the township of Proserpine (i.e. 80 customers) and the embedded generator
Proserpine Sugar Mill. The Authorised Demand of Proserpine Mill is 10 MVA (10 MW) export and
4 MVA (3.6 MW) import.

The Cannonvale / Airlie Beach area zone substations are supplied via two radial 66 kV feeders
(119 Cannonvale No. 1 and 118 Cannonvale No. 2 feeders) out of T39 Proserpine (PROS)
132/66 kV substation. Cannonvale No. 2 (CANN-02) supplies Cannonvale substation while
Cannonvale No. 1 (CANN-01) bypasses Cannonvale to supply Jubilee Pocket, Shutehaven and
Mount Rooper substations.

The 66 kV feeders between Proserpine and Cannonvale are predominantly timber pole, timber
crossarm construction but no overhead earthwire. One line is constructed in 1984 and the other in
2000. The summer day (SD) overhead line ratings of CANN-01 and CANN-02 are 43.0 MVA and
45.6 MVA respectively. The backbone circuit distance from Proserpine to Cannonvale is approx.
24.9 km (CANN-01) and 27 km (CANN-02).

CANN-01 has a hard tee (of approx. 1.0 km O/H and 0.37 km U/G) to Proserpine Mill (PRMI)
66/11 kV substation, 4.0 km from Proserpine.

                                                                                                page 7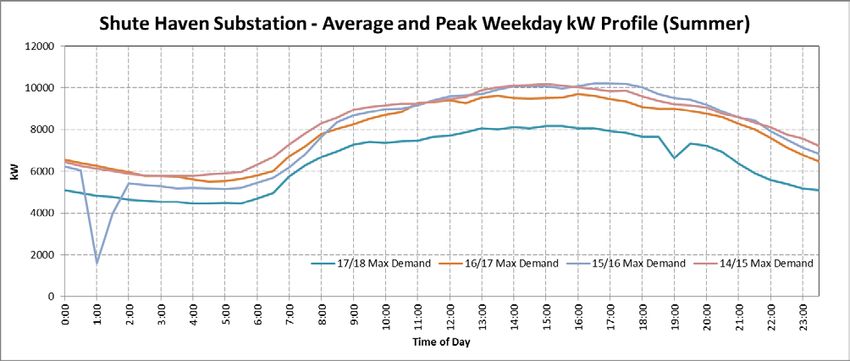
RIT-D Non-Network Options Report: Cannonvale 66 kV Reinforcement

The existing 66 kV network arrangement is shown schematically in the figure below.

                           Figure 2: Existing 66 kV Sub-transmission Network

There are also plans for a future 66/11 kV substation at Riordanvale to in order to accommodate
further load growth in the distribution network to the south-west of Cannonvale.

3.       Identified Need

3.1.     Description of the Identified Need

The identified need can be broken down into three major components as detailed below.

3.1.1.    Low Reliability due to Reliance on Manual Switching at Cannonvale

Cannonvale does not have a fully switched 66 kV bus; as such there is a reliance on manual
switching at Cannonvale to restore supply to customers downstream of the CANN-JUPO 66 kV
feeder for a fault on the CANN-01 feeder between Proserpine and Cannonvale. The CANN-01
feeder also has a hard tee off to Cannonvale substation via a normally open 66 kV isolator which is
manually closed following a contingency failure of CANN-02 feeder.

Time consuming manually operated 66 kV switches at Cannonvale substation are operated to
rearrange the 66 kV network and restore supply via CANN-01 or CANN-02 under forced or
planned outage conditions.

The reliance on manual switching at Cannonvale to restore supply to customers downstream of the
CANN-JUPO 66 kV feeder for a fault on CANN-01 between Proserpine and Cannonvale results in
a 1-4 hour outage. This section of CANN-01 has experienced 20 outages (3 underground and 17
overhead) over 8 years with an average overhead outage restoration period of 2.8 hours
(358 minutes/year), and over an 8 year long term average assessment the Value of Customer
Reliability resulting from poor reliability is approximated as $1.765M annually.

                                                                                                  page 8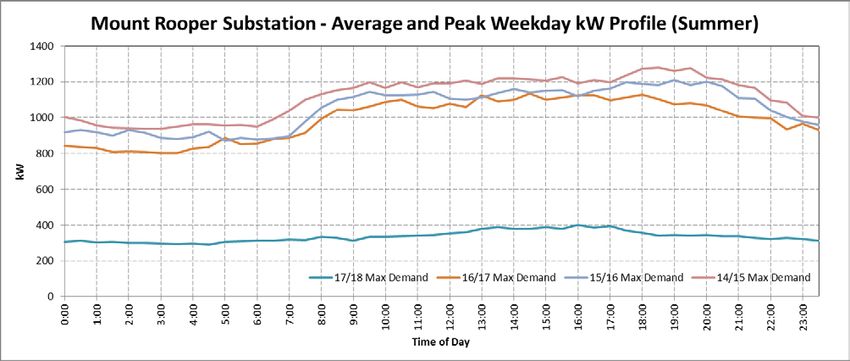
RIT-D Non-Network Options Report: Cannonvale 66 kV Reinforcement

As the 66 kV transfer between CANN-01 to CANN-02 occurs in the CANN substation on the quasi
66 kV bus and involves staff standing under the 66 kV isolator and in close proximity to the
porcelain cable termination, field crews recommend load transfers via the 11 kV or from a de-
energised 66 kV due to safety concerns.

A temporary overhead bypass has been constructed after the CANN-01 66 kV XLPE cable (circa
1981) to the 66 kV bus, failed in March 2017. The bypass arrangement is temporary and has not
undergone the relevant planning applications with Main Roads and Council to remain an approved
and permanent installation.

Ergon Energy owns an additional parcel of land behind the Cannonvale substation that could be
used to enable redevelopment of the site into a fully switched 66 kV bus.

                 Figure 3: Cannonvale (CANN) 66/11 kV Substation Existing Arrangement

3.1.2.    Aged and Poor Condition Asset Replacement

The existing Cannonvale substation is of early 1980s vintage and is in reasonable condition.
However, the transformer CTs are due for replacement within the next 10 years and the two
transformer 66 kV circuit breakers are ABB HLC type and are planned for replacement due to a
known potentially explosive failure mode.

The CANN-01 feeder cable entering the switchyard at CANN recently failed in January 2017 due to
the flashover of the phase conductor to the screen as a result of the development of water trees. It
is probable that other failures in cables of this same type and age will occur over the next few
years as all cables in and out of CANN are of similar type and vintage as the failed CANN-01 entry
cable.

The cable construction is single core XLPE insulated aluminium conductor with a light duty copper
screen and no insect protection. Analysis of the XLPE insulation by The University of Queensland

                                                                                                  page 9
RIT-D Non-Network Options Report: Cannonvale 66 kV Reinforcement
(UQ) on both the faulted phase and a healthy phase cable was conducted. The conclusions from
this testing are summarised below:
“It was postulated that the failure resulted from the flashover of the phase conductor to the screen
due to the progressive development into electrical trees of vented trees and/or the cumulative
effects of multiple bow-tie trees over time. The true root cause could not be determined without
doubt, however given the age of this cable and the fact significant numbers of water trees were
discovered in un-faulted phases, this is the most likely cause in this instance. It is probable that
other failures in cables of this same type and age will occur over the next few years.”
Additionally, testing of the CANN-02 exit cable was performed. On-line Partial Discharge (PD)
testing confirmed the presence of PD on this section of cable using two different test sets.
3.1.3. Cable Constraints
With the exception of the CANN-01 entry cable, the remaining 66 kV entry and exit cables at
Cannonvale substation are rated at 34 MVA. The system peak currently exceeds 34 MVA
(4.5 MVA from PRMI, 15 MVA from CANN, 5.4 MVA from JUPO, 1 MVA from MORO and 10 MVA
from SHUT) when operating under a contingency scenario where CANN-02 has failed. The
overhead sections of the 66 kV feeders from Proserpine are rated above 40 MVA therefore the
underground cables at Cannonvale are the constraining conductors. Increasing the rating of these
cables would alleviate the risk of load exceeding rating during a contingency scenario and thus
reduce outage time and improve reliability.
3.2. Quantification of the Identified Need
3.2.1. Reliability Impacts
Supply reliability and high VCR of the distribution network is a reflection of the poor performance of
the 66 kV sub-transmission network. The table below shows that in the last 8 years, 76% of the
known sub-transmission fault locations were identified on the 66 kV supply side of Cannonvale.
Table 1: Sub-transmission Fault Locations (Since 2010)
% of Known
Fault Location Fault Location 66kV Feeder
Fault Locations
CANN-JUPO CANN-01 14.29%
Beyond CANN
JUPO-SHUT CANN-01 9.52%
Beyond CANN
23.81%
Total
PROS BUS 2 CANN-02 4.76%
Before CANN PROS-CANN CANN-02 14.29%
CANN-01 57.14%
Before CANN
76.19%
Total
Grand Total 100.00%
page 10RIT-D Non-Network Options Report: Cannonvale 66 kV Reinforcement
Applicable outage events, unserved energy and VCR were analysed over 8 years of outage data
which showed an average annual unserved energy cost of $2.117M including the 9 hour long-term
CANN-01 cable outage. The worst 12 months was in the year 2017/18 which saw unserved energy
of 200 MWh valued at $5.6M (not including Cyclone Debbie). This was largely due to the CANN-01
66 kV cable fault on one of the incoming feeders into Cannonvale which took 9 hours to locate and
isolate while Jubilee Pocket, Mount Rooper and Shutehaven remained offline.
The figure below indicates that a large percentage of outage events have occurred during the
evening peak period, meaning maximum disruption to the hospitality industry and the general
population.
Figure 4: Outage Duration & Time of Occurrence of Sub-transmission Faults
3.2.2. Sub-transmission Network Limitations
The incoming cable from CANN-02 is 185 mm2 aluminium with a confirmed rating of 34 MVA. This
is a constraint at present when CANN-01 is out of service between Proserpine and Proserpine Mill
such that Proserpine Mill is back-fed from Cannonvale. In the next 5-6 years, assuming around
2 % growth as justified by the forecast load and population growth, the constraint will exist for a
single feeder outage without back feeding Proserpine Mill.
The incoming cable from CANN-01 was replaced in November 2018 and now has a rating of
80 MVA. As such, this is no longer a constraint however the remaining 66 kV entry/exit cables at
Cannonvale still remain.
The table below shows a forecast of substation loads and subsequent 66 kV feeder loadings in
system normal and contingency arrangements. The existing and emerging cable capacity
constraints are visible in red.
page 11RIT-D Non-Network Options Report: Cannonvale 66 kV Reinforcement
Rating Constraint Forecast 2016/17 2017/18 2018/19 2019/20 2020/21 2021/22 2022/23 2023/24 2024/25 2025/26 2026/27 2027/28 2028/29
(MVA) (Actuals)
Substation Load Forecasts - Peak Loads (Summer)(MVA)
CANN Substation 14.1 14.4 14.6 14.9 15.1 15.4 15.7 16.0 16.3 16.6 16.9 17.2 17.5
Growth % 1.8% 1.8% 1.8% 1.8% 1.8% 1.8% 1.8% 1.8% 1.8% 1.8% 1.8% 1.8% 1.8%
Block Increase (MVA)
JUPO Substation 5.4 5.5 5.7 5.8 6.0 6.1 6.3 6.4 6.6 6.7 6.9 7.1 7.3
Growth % 2.5% 2.5% 2.5% 2.5% 2.5% 2.5% 2.5% 2.5% 2.5% 2.5% 2.5% 2.5% 2.5%
Block Increase (MVA)
MORO Substation 1.4 1.4 1.4 1.4 1.5 1.5 1.5 1.5 1.5 1.5 1.5 1.6 1.6
Growth % 1.0% 1.0% 1.0% 1.0% 1.0% 1.0% 1.0% 1.0% 1.0% 1.0% 1.0% 1.0% 1.0%
Block Increase (MVA)
SHUT Substation 10.5 10.7 10.9 11.1 11.4 11.6 11.8 12.1 12.3 12.5 12.8 13.1 13.3
Growth % 2.0% 2.0% 2.0% 2.0% 2.0% 2.0% 2.0% 2.0% 2.0% 2.0% 2.0% 2.0% 2.0%
Block Increase (MVA)
PRMI Substation 4.5 4.5 4.6 4.6 4.7 4.7 4.8 4.8 4.9 4.9 5.0 5.0 5.1
Growth % 1.0% 1.0% 1.0% 1.0% 1.0% 1.0% 1.0% 1.0% 1.0% 1.0% 1.0% 1.0% 1.0%
Block Increase (MVA)
Coincidence Factor
119 Cannonvale No1 (JUPO + MORO + SHUT Coincident Peak Load) 15.6 16.0 16.3 16.6 17.0 17.3 17.7 18.1 18.4 18.8 19.2 19.6 20.0
Coincidence Factor (Calculated) 0.90 0.90 0.90 0.90 0.90 0.90 0.90 0.90 0.90 0.90 0.90 0.90 0.90
Feeder Load Forecasts - Coincident Peak Loads (Summer)(MVA)
118 Cannonvale No2 (PROS - CANN)
Normal 34 Cable into CANN 14.1 14.4 14.6 14.9 15.1 15.4 15.7 16.0 16.3 16.6 16.9 17.2 17.5
119 (PRMI-CANN) OOS 34 Cable into CANN 29.7 30.3 30.9 31.5 32.1 32.7 33.4 34.0 34.7 35.4 36.1 36.8 37.5
119 (PROS-PRMI) OOS 34 Cable into CANN 34.2 34.9 35.5 36.1 36.8 37.5 38.2 38.9 39.6 40.3 41.0 41.8 42.6
119 Cannonvale No1 (PROS - PRMI Tee)
Normal 50 OH Line 15.6 16.0 16.3 16.6 17.0 17.3 17.7 18.1 18.4 18.8 19.2 19.6 20.0
118 (PROS-CANN) OOS 50 OH Line 29.7 30.3 30.9 31.5 32.1 32.7 33.4 34.0 34.7 35.4 36.1 36.8 37.5
119 Cannonvale No1 (PRMI Tee - CANN)
Normal 34 Cable into CANN (FAILED 2017) 15.6 16.0 16.3 16.6 17.0 17.3 17.7 18.1 18.4 18.8 19.2 19.6 20.0
118 (PROS-CANN) OOS 34 Cable into CANN (FAILED 2017) 29.7 30.3 30.9 31.5 32.1 32.7 33.4 34.0 34.7 35.4 36.1 36.8 37.5
119 Cannonvale No1 (CANN - JUPO)
Normal 30 Cable from CANN 15.6 16.0 16.3 16.6 17.0 17.3 17.7 18.1 18.4 18.8 19.2 19.6 20.0
426 Mt Rooper (JUPO - MORO)
Normal 47 OH Line 10.7 10.9 11.1 11.3 11.5 11.8 12.0 12.2 12.4 12.7 12.9 13.2 13.4
426 Mt Rooper (MORO - SHUT)
Normal 47 OH Line 10.5 10.7 10.9 11.1 11.4 11.6 11.8 12.1 12.3 12.5 12.8 13.1 13.3
Figure 5: Forecast Substation & Feeder Loads (Including Contingency Arrangements)
4. Value of Customer Reliability
Value of Customer Reliability (VCR) is an economic value applied to customers’ unserved energy
for any particular year. Any reduction in unserved energy a solution that addresses the identified
need described in Section 3 will bring will be treated as a benefit based on the corresponding
reduction in customer financial consequence.
Based on historical reliability performance of the 66 kV sub-transmission network in the
Cannonvale / Airlie Beach area, forecast load growth and load duration; probability weighted
values of unserved energy at Cannonvale have been calculated. These values have been
converted into a dollar figure which reflects the customer financial consequence of the unserved
energy.
Customer impact of the sub-transmission network configuration has increased substantially in the
last four years. This is reflected in the Value of Customer Reliability (VCR) values based on
analysis of historical outages over the past eight years as shown in the figure below.
page 12RIT-D Non-Network Options Report: Cannonvale 66 kV Reinforcement
Figure 6: Lost Energy VCR Values due to Lack of Switchyard at Cannonvale
The unit rate for Value of Customer Reliability that has been used for this analysis is $28/kWh. This
is a location specific value for Cannonvale / Airlie Beach based on the customer mix shown in
Table 2 and the VCR values for different customer types shown in Table 3 as published by AEMO.
Table 2: Cannonvale / Airlie Beach Supply Region Customer Breakdown
Number of Domestic Commercial Industrial
Substation
Premises Premises Premises Premises
CANN 5,504 4,573 0 930
JUPO 1,515 1,335 0 180
MORO 78 55 0 22
SHUT 0 0 0 0
PRMI 114 42 0 72
Total 7,211 6,005 0 1,204
Table 3: AEMO VCR Values for Different Customer Types
Sector $/kWh VCR ($/MWh)
Domestic $25.42 $25,420
Commercial $44.72 $44,720
Industrial $44.06 $44,060
Rural $47.67 $47,670
page 13RIT-D Non-Network Options Report: Cannonvale 66 kV Reinforcement
5. Load Profiles
The load at Cannonvale / Airlie Beach comprises a mix of residential and industrial customers.
Daily peak loads generally occur in the late afternoon and evening. The load is summer peaking,
and annual peak loads are predominantly driven by air-conditioning.
5.1. Cannonvale (CANN) 66/11 kV Substation
The historical load of Cannonvale substation for the summer day (SD), summer night (SN), winter
day (WD) and winter night (WN) periods since 2004 is shown in the figure below.
Figure 7: Historical Load of Cannonvale Substation (Since 2004)
The sudden drop in load seen between 2010 and 2011 is a result of Jubilee Pocket substation
being energised and taking some of the load from Cannonvale.
Taking into account historical feeder growth and the forecast population growth a load growth of
2 % is expected. The peak load by 2030 will then be 19.15 MVA. Under an extreme load growth of
4 %, the load would increase to 24.18 MVA.
It should be noted that the Cannonvale substation summer peaks were being experienced between
1.30 pm to 4.00 pm in the afternoon, however in recent years (2015 to 2018 inclusive), the summer
peak is now being experienced from 4.30 pm to 7.30 pm due to the installation of customer-owned
rooftop solar PV systems (refer to the figure below).
page 14RIT-D Non-Network Options Report: Cannonvale 66 kV Reinforcement
Figure 8: Cannonvale Average & Peak Weekday Load Profile (Summer)
Figure 9: Cannonvale Load Duration Curve
5.2. Jubilee Pocket (JUPO) 66/11 kV Substation
The historical load of Jubilee Pocket substation for the summer day (SD), summer night (SN),
winter day (WD) and winter night (WN) periods since its energisation in 2010 is shown in the figure
below.
page 15RIT-D Non-Network Options Report: Cannonvale 66 kV Reinforcement
Figure 10: Historical Load of Jubilee Pocket Substation (Since 2010)
With a 2 % load growth, the load will peak at 6.62 MVA in 2030 which is well below the Jubilee
Pocket transformer nameplate rating of 32 MVA. However as upstream supply reliability improves
it will allow more 11 kV feeder load to be transferred from Cannonvale to Jubilee Pocket. Point
loads like Port of Airlie will likely proceed and be supported by the adjacent residential locality of
Jubilee Pocket. The substation load will increase accordingly.
The daily load profile is also shown in the figure below.
Figure 11: Jubilee Pocket Average & Peak Weekday Load Profile (Summer)
page 16RIT-D Non-Network Options Report: Cannonvale 66 kV Reinforcement
Figure 12: Jubilee Pocket Load Duration Curve
5.3. Mount Rooper (MORO) 66/11 kV Substation
The historical load of Mount Rooper substation for the summer day (SD), summer night (SN),
winter day (WD) and winter night (WN) periods since 2002 is shown in the figure below.
Figure 13: Historical Load of Mount Rooper Substation (Since 2002)
As the majority of load on this substation is from the Daydream/South Molle feeder, the forecast
growth of this substation will be heavily dependent on the resorts on these islands.
page 17RIT-D Non-Network Options Report: Cannonvale 66 kV Reinforcement
Daydream Island has recently undergone refurbishment and therefore the load is expected to
increase as the resort begins taking more tourists. Daydream Island bore the brunt of Category 4
Cyclone Debbie in March 2017 with 260 km/hr wind gusts and a tidal surge that caused significant
damage to the iconic island 4.5 star resort. Cyclone Debbie is responsible for the drop in demand
experienced in 2017.
Repair and development works are currently being undertaken, and the luxury island 277 room
resort and associated facilities are expected to re-open at the end of the first quarter 2019.
The yearly daily load profile of Mount Rooper substation since 2014/15 is also shown in the figure
below.
Figure 14: Mount Rooper Average & Peak Weekday Load Profile (Summer)
Figure 15: Mount Rooper Load Duration Curve
page 18RIT-D Non-Network Options Report: Cannonvale 66 kV Reinforcement
5.4. Shutehaven (SHUT) 66/11 kV Substation
The historical load of Shutehaven substation for the summer day (SD), summer night (SN), winter
day (WD) and winter night (WN) periods since 2000 is shown in the figure below.
Figure 16: Historical Load of Shutehaven Substation (Since 2000)
Similarly to Mount Rooper, the load on Shutehaven substation is dependent on the load of the two
connected islands, Hayman Island and Hamilton Island.
Before damage from cyclone Debbie forced the resorts on the Hayman and Hamilton islands to
partly close, the authorised demands were 3.3 MVA and 11.0 MVA respectively. Consequently, it
can be expected that the peak load on Shutehaven substation can return to previous peak
demands of 11.0 MVA and potentially increase to 13.3 MVA (being the combined island authorised
demand).
The recent daily summer load profiles for Shutehaven substation can be seen in the figure below.
Figure 17: Shutehaven Average & Peak Weekday Load Profile (Summer)
page 19RIT-D Non-Network Options Report: Cannonvale 66 kV Reinforcement
6. Assumptions in Relation to Identified Need
Below is a summary of key assumptions that have been made when the Identified need has been
analysed and quantified.
It is recognised that the below assumptions may prove to have various levels of correctness, and
they merely represent a ‘best endeavours’ approach to predict the future identified need.
6.1. Forecast Maximum Demand
It has been assumed that peak demand at Cannonvale and Jubilee Pocket substations will grow as
forecasted.
Factors that have been taken into account when the load forecast has been developed include the
following:
• load history
• known future developments (new major customers, network augmentation, etc.)
• temperature corrected start values (historical peak demands)
• forecast growth rates for organic growth
6.2. Load Profile
Characteristic peak day load profiles shown in Section 5 are unlikely to change significantly from
year to year, i.e. the shape of the load profile will remain virtually the same with increasing
maximum demand.
page 20RIT-D Non-Network Options Report: Cannonvale 66 kV Reinforcement
6.3. System Capability – Line Ratings
The thermal ratings of the sub-transmission lines that supply Cannonvale have been calculated
based on the main parameters listed in the table below.
Table 4: Line Rating Parameters
Parameter Summer Day Summer Evening
(9am – 5pm) (5pm – 10pm)
Ambient Temperature 35°C 31°C
Wind Velocity 1.3 m/s 0.8 m/s
Wind Angle to Conductor Axis 45° 45°
2 2
Direct Solar Radiation 910 W/m 200 W/m
2 2
Diffuse Solar Radiation 210 W/m 20 W/m
7. Technical Characteristics of Non-Network
Options
This section describes the technical characteristics of the identified need that a non-network option
would be required to comply with.
7.1. Size
To meet Ergon Energy’s ongoing operational needs it is expected that any alternate solution must
deliver the required load reduction and/or local generation listed in the table below.
Table 5: Demand Reduction Required
Year Demand Reduction Demand Reduction
Required (First 6 hrs) Required (Beyond 6 hrs)
2020 16.1 MVA 2.1 MVA
2021 16.8 MVA 2.8 MVA
2022 17.5 MVA 3.5 MVA
2023 18.2 MVA 4.2 MVA
2024 18.9 MVA 4.9 MVA
2025 19.6 MVA 5.6 MVA
2026 20.3 MVA 6.3 MVA
2027 21.0 MVA 7.0 MVA
2028 21.8 MVA 7.8 MVA
2029 22.6 MVA 8.6 MVA
7.2. Location
The location where network support and load restoration capability will be measured / referenced is
on the 66 kV bus at Cannonvale substation; however alternative options may be located anywhere
downstream on the 66 kV network, so long as they can be operationally utilised when required.
page 21RIT-D Non-Network Options Report: Cannonvale 66 kV Reinforcement
7.3. Timing
7.3.1. Implementation Timeframe
In order to ensure compliance with Ergon Energy’s planning criteria and the National Electricity
Rules, a non-network solution will need to be implemented by September 2023.
7.3.2. Time of Year
Load restoration capability (for Service Safety Net Targets) may be required at any time of the
year, although required magnitude will be significantly lower during seasons with low to moderate
daily peak loads, e.g. late autumn, winter and early spring.
7.4. Compliance with Regulations & Standards
As a distribution network service provider (DNSP), Ergon Energy must comply with regulations and
standards, including the Queensland Electricity Act and Regulation, Distribution Authority, National
Electricity Rules and applicable Australian Standards.
These obligations must be taken in consideration when choosing a suitable solution to address the
identified need at Cannonvale / Airlie Beach as discussed in this RIT-D report.
7.5. Longevity
Proposed non-network options will typically be required to provide solutions to the identified need
for a period of at least 10 years. However, alternative solutions that can defer additional network
investment for a smaller number of years may also be considered.
8. Feasible vs Non Feasible Options
8.1. Potentially Feasible Options
The identified need presented in this RIT-D report is driven by the capability and reliability of the
existing 66 kV network that supplies the Cannonvale / Airlie Beach area, and the replacement of
aged and poor condition assets. As such, solutions that cost effectively provide increased
contingency load restoration capability are likely to represent reasonable options.
A non-exhaustive list of potentially feasible options includes:
• New embedded dispatchable network generation
• Existing customer generation
• Load curtailment or “Call-off-load” opportunities (this refers to contracting existing
customers to be partially or fully curtailed when called upon by Ergon Energy)
• Embedded energy storage systems.
page 22RIT-D Non-Network Options Report: Cannonvale 66 kV Reinforcement
8.2. Options that are Unlikely to be Feasible
Without attempting to limit a potential proponent’s ability to innovate when considering
opportunities, some technologies / approaches are unlikely to represent a technically or financially
feasible solution.
A non-exhaustive list of options that are unlikely to be feasible includes:
• Renewable generation not coupled with energy storage and/or dispatchable generation
• Unproven, experimental or undemonstrated technologies.
9. Internal Options Identified
9.1. Non-Network Options Identified
Ergon Energy has not identified any viable non-network solutions that will address the identified
need. Note that there is a separate Non-Network Options report for the Cannonvale – Shute
Harbour 66 kV cable duplication that has been issued in conjunction with this which may offer more
non-network solutions.
9.2. Distribution Network Options Identified
Ergon Energy’s preferred internal option at this stage is to upgrade the Cannonvale 66/11 kV
substation to a fully switched 66 kV yard through the installation of a 7 circuit breaker 66 kV Gas
Insulated Switchgear (GIS). This option also includes the replacement of the 66 kV entry / exit
cables around Cannonvale substation.
The fully switched 66 kV bus arrangement at Cannonvale will sectionalise the network and
eliminate outages to Cannonvale, Jubilee Pocket, Shuthaven and Mount Rooper for faults on the
upstream sections of CANN-01 and CANN-02 between Proserpine and Cannonvale.
Upon completion of these works, the subsequent reliability improvement to Jubilee Pocket and
Mount Rooper will allow permanent Airlie Beach load transfers from Cannonvale to Jubilee Pocket
and commissioning of new ‘Urban’ category MSS 11 kV feeders without becoming a ‘RED’ feeder
immediately upon commissioning (i.e. as is currently the case with the Port of Airlie 11 kV feeder).
Additionally, it will also resolve the MORO Shute Harbour (108) 11 kV ‘RED’ SR feeder status, and
will also provide a strategic network development benefit by allowing the future Riordanvale (RIOR)
66/11 kV substation to be developed as a single T3-10 tee substation.
Table 6: Ergon Energy’s Internal Cost for the Preferred Option
Solution Description Capital Cost Commissioning Date
(Excl. Ergon Overheads)
Ergon Energy Internal Option A (Preferred) $11.2M
66 kV GIS at Cannonvale (incl. 66 kV cable REPEX: $2.5M 2022/23
exit replacement) AUGEX: $8.7M
page 23RIT-D Non-Network Options Report: Cannonvale 66 kV Reinforcement
Please note that this proposed internal option also addresses some existing aged asset
challenges. It is recognised that it may be difficult for an alternative solution to also address these
aged asset issues. Given this, any alternate solution at a minimum must address the augmentation
requirements with it being optional that refurbishment requirements are also addressed. The costs
associated with the augmentation work (AUGEX) are listed in the table above.
10. Submissions & Next Steps
10.1. Submissions from Solution Providers
Ergon Energy invites written submissions on this report from registered participants and interested
parties.
With reference to Section 7, all submissions should include sufficient technical and financial
information to enable Ergon Energy to undertake comparative analysis of the proposed solution
against other options.
The proposals should include, but are not limited to:
• Full costs of completed works including delivery and installation where applicable
• Whole of life costs including operational costs
• Project execution strategy including design, testing and commissioning plans
• Engineering network system studies and study reports
• Verified and approved engineering designs if available
Ergon Energy will not be legally bound in any way or otherwise obligated to any person who may
receive this RIT-D report or to any person who may submit a proposal. At no time will Ergon
Energy be liable for any costs incurred by a proponent in the assessment of this RIT-D report, any
site visits, obtainment of further information from Ergon Energy or the preparation by a proponent
of a proposal to address the identified need specified in this RIT-D report.
Submissions in writing are due by 19 September 2019 and should be lodged to Ergon Energy’s
“Regulatory Investment Test for Distribution (RIT-D) Partner Portal” The portal is available at:
https://www.ergon.com.au/network/network-management/network-infrastructure/regulatory-test-
consultations
10.2. Next Steps
Ergon Energy intends to carry out the following process to assess what action should be taken to
address the identified need at Cannonvale:
Step 1 Publish Non Network Options Report (this report) inviting non-network options Date Released:
from interested participants 24 June 2019
Step 2 Submissions in response to the Non Network Options Report Due Date:
19 September 2019
page 24RIT-D Non-Network Options Report: Cannonvale 66 kV Reinforcement
Step 3 Review and analysis of proposals by Ergon Energy. Anticipated to be
This is likely to involve further consultation with proponents and additional data completed by:
may be requested. 7 October 2019
Step 4 Release of the Draft Project Assessment Report (DPAR) Anticipated to be
released by:
14 October 2019
Step 5 Submissions in response to the Draft Project Assessment Report. Due Date:
29 November 2019
Step 6 Review and analysis by Ergon Energy. Anticipated to be
This is likely to involve further consultation with proponents and additional data completed by:
may be requested. 20 December 2019
Step 7 Release of Final Project Assessment Report (FPAR) including summary of Anticipated to be
submissions received released by:
23 December 2019
Ergon Energy reserves the right to revise this timetable at any time. The revised timetable will be made available on the
Ergon Energy website.
Ergon Energy will use its reasonable endeavours to maintain the consultation program listed
above. However, due to changing power system conditions or other circumstances beyond the
control of Ergon Energy this consultation schedule may change. Up-to-date information will be
available on the Partner Portal.
During the consultation period, Ergon Energy will review, compare and analyse all internal and
external solutions. At the conclusion of the consultation process, Ergon Energy will publish a final
report which will detail the most feasible option. Ergon Energy will then proceed to take steps to
progress the recommended solution to ensure any statutory non-compliance is addressed and
undertake appropriately justified network reliability improvement, as necessary.
page 25You can also read