Regulatory Test - Request for Information - ADDENDUM - Australian Energy Market ...
←
→
Page content transcription
If your browser does not render page correctly, please read the page content below
Regulatory Test –
                       Request for Information
                                    - ADDENDUM

              Emerging Distribution
             Network Limitations in
               the Gracemere Area
                                                                9 September 2014

Disclaimer
While care was taken in preparation of the information in this discussion paper, and it is provided in good faith, Ergon
Energy Corporation Limited accepts no responsibility or liability for any loss or damage that may be incurred by any
person acting in reliance on this information or assumptions drawn from it. This discussion paper has been prepared for
the purpose of inviting information, comment and discussion from interested parties. The document has been prepared
using information provided by a number of third parties. It contains assumptions regarding, among other things,
economic growth and load forecasts which may or may not prove to be correct. All information should be independently
verified to the extent possible before assessing any investment proposal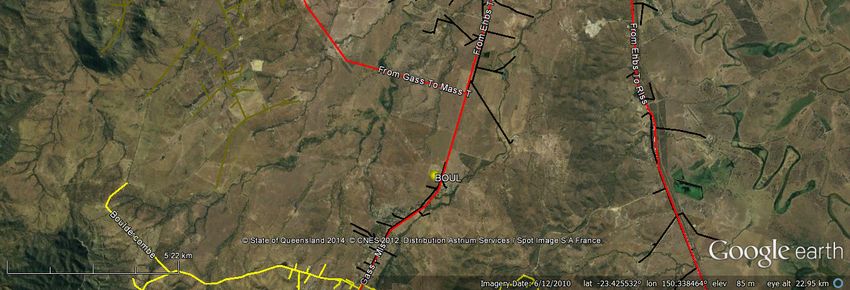
Purpose of Addendum
In December 2013, Ergon Energy Corporation Limited (Ergon Energy) published a Request for
Information for the Gracemere area in Central Queensland. Since that time, Ergon Energy’s
Distribution Authority has been amended, changing the Security of Supply Criteria under which
network investment planning is undertaken. The new Security of Supply Criteria, are underpinned
by an economic, probabilistic, customer value based approach to reliability and are aimed at
increasing asset utilisation in a controlled manner that balances network expenditure and
performance. It is intended that the new Criteria will improve customer value by reducing the
growth and cost of network assets.

In line with these changes, Ergon Energy has revisited the network investment requirements for
the Gracemere area, and has identified a material change in those requirements. As a
consequence, Ergon Energy has decided to publish this Addendum to the Request for Information,
detailing the new conditions and requirements.

This Addendum is intended to be read in conjunction with the original Request for Information1, as
it does not contain all relevant information (such as, for example, the criteria that proposed
solutions must meet).

1
https://www.ergon.com.au/__data/assets/pdf_file/0005/181832/Gracemere_RFI.pdf

                                                       page i
Executive Summary
Ergon Energy is responsible (under its Distribution Authority) for electricity supply to the
Gracemere area in Central Queensland. We have identified emerging limitations in the electricity
distribution network supplying the area. The loads on Ergon Energy’s Malchi 66/11kV Zone
Substation (which supplies the entire Gracemere area) and 11kV network have progressively
increased to the point that meeting the minimum standards for reliability of supply will not be
possible beyond 2016/17, if no action is taken.
The load on Malchi substation is already in excess of its N-1 capacity and as such, any transformer
contingency may result in customer load shedding. The load is also approaching the N capacity of
the substation, and is anticipated to exceed this during the summer of 2020/21 under “normal”
summer conditions (POE50) or as early as 2017/18 under extreme summer conditions (POE10).
As such, failure to act will result in unserved customer energy during “system normal” conditions.
If no action is taken, the Gracemere network will not be compliant with the requirements under the
recently mandated “Safety Net” component of the Security Criteria from the summer of 2016/17.
This non-compliance is forecast to grow in line with network demand growth from 1.0MVA to
8.5MVA during the summer of 2024/25. The medium voltage distribution network is also expected
to exceed the Security Criteria loading levels during the summer of 2021/22.
Initial modelling indicates that a significant network augmentation is likely to be justified during the
study period; the timing of which, however, is heavily dependent upon the cost the preferred
internal option(s), the cost of any alternatives available and the benefits delivered from each.
Note that is all cases, changes in forecast network demand, increases in local load under control,
changes to network transfer capability and/or other factors, will result in changes to the forecast
non-compliance and thus the level of response required to address it.
A decision is required by January 2015 if the initial stage of any option involving significant
construction is to be completed by 1 November 2016.
This Addendum is a further Request for Information where Ergon Energy is seeking updated/new
information about possible solutions to the (adjusted) emerging limitations, which may be able to
be provided by parties other than Ergon Energy.
Submissions in writing (electronic preferably) are due by 4 November 2014 and should be lodged
to:

                                Attention:      Network Development
                               Email: regulatory.tests@ergon.com.au

Updated information will be provided on our web site:
https://www.ergon.com.au/network/network-management/network-infrastructure/regulatory-test-
consultations
For further information and inquiries please submit to the email address above.

                                             page ii
Table of Contents
Purpose of Addendum................................................................................................................... i
Executive Summary ...................................................................................................................... ii
1. Changes to Reliability Standards ............................................................................................ 1
1.1 Safety Net ............................................................................................................................. 1
1.2 Value of Customer Reliability ................................................................................................. 2
2. Updated Emerging Distribution Network Limitations ............................................................................... 3
2.1 Network Capability and Configuration .................................................................................... 3
2.2 Network Load, Makeup and Forecast .................................................................................... 4
2.3 Load Duration and Capacity Exceedance .............................................................................. 6
2.4 Distribution Network .............................................................................................................. 8
2.5 Identified Non-Compliances ................................................................................................... 9
2.5.1 Safety Net ......................................................................................................................................... 9
2.5.2 Distribution Feeder Utilisation Levels ............................................................................................. 11
2.6 Value of Customer Reliability ............................................................................................... 11
3. Corrective Action .................................................................................................................... 12
3.1 Timelines ............................................................................................................................. 12
3.2 Known Future Network and Generation Development ......................................................... 12
3.3 Summary of Identified Need ................................................................................................ 12
3.4 Internal Options that Address the Identified Need ................................................................ 12
3.5 Alternative and Non-Network Solutions ............................................................................... 13
3.6 Minimum Requirements for All Options................................................................................ 13
3.7 Internally identified non-network solutions ........................................................................... 13
3.7.1 Discussion ...................................................................................................................................... 14
3.7.2 Embedded Generation ................................................................................................................... 14
3.7.3 Curtailment/Call Off Load ............................................................................................................... 14
3.7.4 Customer Demand Management and Energy Efficiency Programs ............................................... 15
3.7.5 Embedded Energy Storage ............................................................................................................ 15
3.8 Options that are unlikely to be feasible ................................................................................ 16
3.8.1 Solar Generation............................................................................................................................. 16
3.8.2 Wind Generation ............................................................................................................................. 16
3.8.3 Unproven, Experimental or Undemonstrated Technologies .......................................................... 16
3.9 Evaluating Proposals ........................................................................................................... 17
3.9.1 Section 5 of the Request for Information ........................................................................................ 17
3.9.2 Information to Assist the Evaluation Process ................................................................................. 17
4. Submissions and Next Steps ................................................................................................. 18
4.1 Timetable for Submissions .................................................................................................. 18
4.2 Assessment and Decision Timetable ................................................................................... 18
page iiiTables and Figures
Figure 1 - Gracemere Distribution and Subtransmission Network ................................................... 3
Figure 2 - Gracemere Daily Demand (Max/Min) .............................................................................. 5
Figure 3 - Gracemere Hot Summer Day Load Profile & Forecast .................................................... 5
Figure 4 - Gracemere Forecast and Substation Capacity ................................................................ 6
Figure 5 - Gracemere Annual Load Duration Curve & Forecast ...................................................... 7
Figure 6 – Malchi Zone Substation Transformer Safety Net Requirements ..................................... 9
Figure 7 - Gracemere Subtransmission Safety Net Requirements ................................................ 10
Table 1 - Feeder Colours/Names and Point of Supply .................................................................... 4
Table 2 - Customer Mix ................................................................................................................... 4
Table 3 - POE50 Forecast Exceedance Figures ............................................................................. 7
Table 4 - POE10 Forecast Exceedance Figures ............................................................................. 7
Table 5 - Distribution Network Loading ........................................................................................... 8
Table 6 - Assessment & Decision Timetable ................................................................................. 18
page iv1. Changes to Reliability Standards
Ergon Energy was notified in March 2014 that the Queensland Government had made a decision
to implement reforms to the electricity network reliability standards, consistent with the
recommendations of the Inter-Departmental Committee on Electricity Sector Reform and the
Independent Review Panel on Network Costs.
Specifically, from 1 July 2014, these reforms:
1) Remove the requirement to comply with N-1 planning standards; and,
2) Require that Distributors take an economic, probabilistic and customer value-based
approach to building network for reliability purposes; and,
3) Retain the Minimum Service Standards (i.e. a set of target reliability performance
indicators), while adding an additional set of “Safety Net” measures which place caps on
the maximum size and duration of customer supply interruptions.
Along with changes to transmission system requirements, these changes are forecast to save
Queensland in the order of $2 Billion over the next 15 years, applying downward pressure on
electricity network charges2.
1.1 Safety Net
Under the mandated Safety Net measures, Gracemere is classified as an “Urban” location and as
such, following an “N-1” contingency event, the load not supplied must be:
• Less than 20 MVA after 1 hour;
• Less than 15 MVA after 6 hours;
• Less than 5 MVA after 12 hours; and
• Fully restored within 24 hours
There are four important factors to note under Safety Net:
a) For network planning purposes, response targets are based upon the maximum demand
for a POE503 forecast
b) The magnitudes and timelines use a sliding scale: for example, for an outage of 25 MVA, 5
MVA must be restored within 1 hour, a further 5 MVA by hour 6, another 10 MVA by hour
12 and the final 5 MVA before hour 24.
c) During an actual outage, Ergon Energy will always endeavour to restore supply as early as
can be safely achieved. The timelines above are “planned for” upper limits and as such,
during a typical outage, actual customer interruption magnitude and duration will typically
be less than the upper limit (in many cases, no loss of supply would occur at all). For
example, while 5 MVA can be “unsupplied” for 24 hours, due to the cyclic nature of network
loading, in most locations supply to all customers would typically be restored during the
evening/night (noting that the item of plant may have not yet been repaired/replaced). Note
however, occasionally, further loss of supply may occur during the high demand period on
the following day, while the failed item of plant is still being repaired/replaced, however full
supply is to be restored within 24 hours.
d) Large customers with an authorised demand above 1.5MVA, who have not paid for an N-1
supply, may be shed during an outage and do not count against the Safety Net targets.
2
http://www.dews.qld.gov.au/policies-initiatives/electricity-sector-reform/supply/electricity-network-reliability-standards
3
Probability of Exceedance 50%: a forecast that has a 50% chance of being exceeded in any one year; i.e. an “average” year.
page 11.2 Value of Customer Reliability
The Value of Customer Reliability (VCR) is a “measure, or index, [that] indicates what different
types of customers (residential, commercial and industrial) are prepared to pay to maintain reliable
electricity supplies.”4
VCR forms the basis of the “economic” approach to planning for network reliability. Project costs
for proposed network augmentation are compared against the improvement in network reliability
they create; at the point where the benefit (i.e. the customer’s willingness to pay for that reliability)
exceeds the annualised cost of the augmentation, then the project is justified under this approach.
The significant difference between this approach and the previous “N-1” prescriptive standards is
that there is no level of loading on a network element that automatically triggers an augmentation;
the timing and form of a network reliability improvement is highly dependent of the price of the
project and the benefits generated.
4
FACT SHEET: Having Your Say on Power Reliability, Australian Energy Market Operator (AEMO), March 2014,
http://www.aemo.com.au/Consultations/National-Electricity-Market/Open/~/media/Files/Other/consultations/nem/VCR_FACT_SHEET_NOVEMBER_20132_ELEC.ashx
page 22. Updated Emerging Distribution Network Limitations
In addition to updating the parts of the Request for Information that have changed since
publication, Ergon Energy also deemed it prudent to add more information about the exact nature
of the existing network load and the identified emerging constraints. It is hoped that this will
enhance the ability of potential respondents to offer solutions that address the specific network
constraints, at the lowest cost.
2.1 Network Capability and Configuration
The study area discussed in this Addendum is supplied by the Malchi 66/11kV Zone Substation
(see Figure 1, below) which in turn is supplied from Egans Hill Bulk Supply substation (EGHI) via a
single 66kV feeder (“From Ehbs to Gass” and “From Gass to Mass T”) through Gavial Switching
Station (GAVI).
The “N-1” rating of Malchi Zone Substation is 13.1MVA and the “N” rating of the substation is
22.6MVA. Note that the N-1 rating has been revised up from 12.0MVA since publication of the
Request for Information.
GAVI
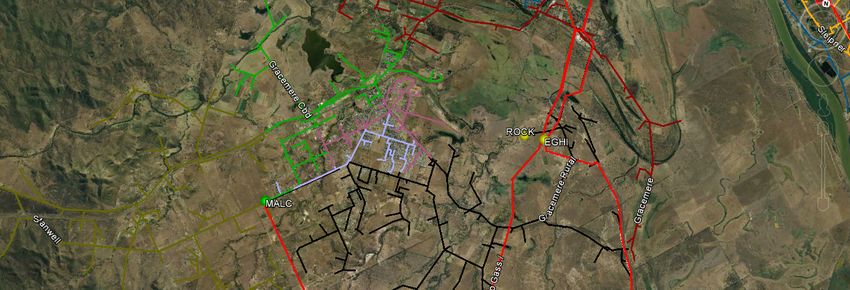
Figure 1 - Gracemere Distribution and Subtransmission Network
Figure 1 also shows the configuration of the distribution feeders (and subtransmission feeders in
bright red) in the area and the location of back up supply. Table 1, below shows the names/colours
of the feeders shown and where those feeders are supplied from.
Note specifically that the “Gracemere 11kV” feeder is supplied from Rockhampton South Zone
Substation and can currently provide approximately 1.0MVA of backup on the Gracemere CBD
feeder. Some backup may be available from Bouldercombe feeder, however the distances are
significant and the network is already stretched in that direction.
page 3Feeder Supplied from
Gracemere 11kV Rockhampton South ZS
Gracemere CBD 11kV Malchi ZS
Gracemere North 11kV Malchi ZS
Gracemere Town 11kV Malchi ZS
Gracemere Rural 11kV Malchi ZS
Stanwell 11kV Malchi ZS
Bouldercombe 11kV Mount Morgan ZS
Various 66kV feeders
Table 1 - Feeder Colours/Names and Point of Supply
2.2 Network Load, Makeup and Forecast
The load at Gracemere is predominantly composed of residential customers, with some
commercial load, as seen in Table 2, below.
Customers5
Sector Count Percentage
Domestic 4984 92.5%
Commercial 339 6.3%
Industrial 6 0.1%
Rural 59 1.1%
Total 5388
Table 2 - Customer Mix
The daily load curve is summer peaking, driven most strongly by residential air conditioning during
the late afternoon and evening, and shows a reduction in daytime demand due to a relatively high
penetration of photovoltaic (PV) systems (Figure 2and Figure 3).
5
A “customer” in this context refers to a connection point, not an individual person.
page 4Figure 2 - Gracemere Daily Demand (Max/Min)
Figure 3 –Gracemere Hot Summer Day Load Profile & Forecast (POE50)
page 5Figure 4 - Gracemere Forecast and Substation Capacity
It can be seen in Figure 4, above, that Malchi Zone Substation is already in excess of the N-1
rating during the summer peak period and is forecast to exceed the “N” rating by the summer of
2020/21, during a POE50 peak day. During extreme (POE106) conditions, the substation
capability could be exceeded as early as 2017/18.
2.3 Load Duration and Capacity Exceedance
Figure 5 shows the load duration curve for Gracemere (the black line), together with the “N” and
“N-1” ratings of the Malchi Zone Substation. It also shows the load duration forecast, assuming
that the forecast growth rates apply equally across all times of the year and that the make up of
demand and localised generation remains fixed.
As already discussed, the load curve for Gracemere is already affected by the high penetration of
PV systems and this would be likely to continue to grow. Additionally, new commercial or industrial
load, or other changes in residential energy consumption patterns will also change this. However,
as the peak demand period in Gracemere occurs during the early evening, these are expected to
have limited impact.
6
Probability of Exceedance 10%: a forecast that has a 10% chance of being exceeded in any one year; i.e. an “extreme” year.
page 6Figure 5 - Gracemere Annual Load Duration Curve & Forecast
POE50 2014/15 2015/16 2016/17 2017/18 2018/19 2019/20 2020/21 2021/22 2022/23 2023/24 2024/25
Exceedance
(MVA)
- - - - - - 1.4 2.3 3.6 4.2 4.9
Min. Energy
(MWh)
- - - - - - 1 3 23 42 66
Duration
(hrs)
- - - - - - 1 6 29 39 49
Days of
Exceedance
- - - - - - 1 5 9 10 12
Table 3 - POE50 Forecast Exceedance Figures
Table 3, above tabulates the dimensions of the area between the “Malchi N” line and the load
duration curve for each year in Figure 5. It should be noted however that the calculations are
made assuming that the existing 1.0MVA transfer capability to Rockhampton is utilised during high
load periods (this is not shown in Figure 5). That is, there a difference of 1.0MVA between the
tabulated value of exceedance and the amount shown in Figure 5. This difference also extends to
the other rows in Table 3, and is similarly applied in Table 4, below.
POE10 2014/15 2015/16 2016/17 2017/18 2018/19 2019/20 2020/21 2021/22 2022/23 2023/24 2024/25
Exceedance
(MVA)
- - - - 1.1 2.0 3.3 4.5 6.3 7.0 7.8
Min. Energy
(MWh)
- - - - 1 2 15 47 125 171 225
Duration
(hrs)
- - - - 1 4 24 39 70 82 95
Days of
- - - - 1 3 8 10 13 15 16
Exceedance
Table 4 - POE10 Forecast Exceedance Figures
page 7In addition to taking into account the available network transfer capability, Table 4, above differs
from the similar table published previously in the Request for Information as it is also based upon
the discreet forecast, rather than average growth rates.
It should be noted that predictions of the future given in Figure 5, Table 3 and Table 4 are
indicative only. They are derived from recorded half hour load data, escalated such that the peak
demand matches the forecast for the year of interest. Factors such as longer/shorter high
temperature periods during the year, hotter/cooler temperatures generally, the timing of hot days
(weekdays vs. weekend/holidays), changes in electrical consumption patterns, etc., as well as
changes in forecast demand will result in different outcomes.
2.4 Distribution Network
As with Table 4, above, Table 5 differs from the originally published table in that the feeder loads
have been reconciled to the discrete forecast (as shown in Figure 4), feeder ratings have been
updated against the new standard and has some slightly different probable network transfers have
been included. Additionally, for clarity, the colour legend has been updated and is shown.
Note that, for example, the “Town” feeder is shown as exceeding it 100% utilisation level (i.e. in
excess of the capability) in 2020/21. This exceedance will not actually occur when that time comes;
even assuming the forecast turns out to be exactly correct. This is due to the highly variable
nature of the loading of the medium voltage (MV) distribution network and the much shorter
timeframes in which changes can be made; load transfers other feeders may be undertaken closer
to the time.
Configuration Reconciled Feeder Loads
Growth Rates Constraints Current Forecast
Target
Feeder Elem Rating Loading OH/UG 2012/ 2013/ 2014/ 2015/ 2016/ 2017/ 2018/ 2019/ 2020/ 2021/ 2022/ 2023/ 2024/ 2025/
Code Name Types yr 1-5 yr 6-10 ent (A) Level (A) /PR 13 14 15 16 17 18 19 20 21 22 23 24 25 26
UG -
MA105 Town Urban 12.79% 5.18% 260 OH 171 179 188 294 304 312 330 342 365 381 402 413 424 436
OH 347
Rural/ UG -
MA108 Rural 2.11% 11.10% 260 OH 174 201 228 151 173 193 219 241 272 297 327 348 370 392
Urban OH 347
UG -
MA111 Stanwell Rural 20.93% 1.20% 260 OH 61 60 119 137 148 157 159 158 162 163 166 165 165 164
OH 347
UG 320
MA119 CBD Urban -0.01% 1.65% 240 UG 194 192 191 199 197 194 197 197 203 205 210 210 210 210
OH 551
UG 320
MA123 North Urban 1.88% 3.05% 240 UG 213 230 202 230 233 233 242 245 256 262 271 274 277 280
OH 347
Total Utilisation 6.05% 4.80% 1,681 1,261 812 861 928 1,012 1,055 1,089 1,148 1,183 1,259 1,310 1,376 1,410 1,446 1,482
Feeder Legend
Utilisation >66.67% >75.0% >90.0% >100.0%
Table 5 - Distribution Network Loading
page 82.5 Identified Non-Compliances
Based upon the forecasts and capabilities shown above, Ergon Energy has identified that if no
action is taken, a number of non-compliance with various obligations will occur over the forecast
period.
2.5.1 Safety Net
SUBSTATION
As has been noted, the network load at Gracemere is already in excess of the “N-1” rating of the
Malchi Zone Substation. As such, under a contingency involving the inability to supply load
through either transformer, some loss of customer supply would occur if this (unlikely) event
occurred on one of the hottest days of summer. As the load grows, the size of the outage and the
number of days during which the risk exists will grow.
Figure 6 below, summarises the size of the shortfall in capability should such an event occur in the
future. Note that this is based upon the POE50 forecast, as per the requirements of Ergon
Energy’s Distribution Authority.
Figure 6 – Malchi Zone Substation Transformer Safety Net Requirements
It should be noted while considering Figure 6, that Ergon Energy already has in place the ability to
respond to outages up to 5MVA within the required 24 hour period using the “Nomad”
transportable substations. Outages with a peak magnitude greater than this represent a potential
non-compliance with Ergon Energy’s Reliability Standards and require addressing at the first
instance.
page 9Note also that a network option to increase network transfer from Rockhampton to Gracemere by
up to 1.4MVA has been identified. Work to obtain an estimate of the cost of this option will occur
while this Addendum is out for comment and after the period of consultation has ended, the cost of
this option will be compared against any alternatives that respondents may provide.
SUBTRANSMISSION
As was discussed in the Request for Information, Malchi is supplied via a single 66kV
subtransmission feeder from Gavial Switching Station. This feeder is approximately 9km in length
and has not had any outages in excess of 6 hours in the past 10 years.
Note that there is currently 1.0MVA transfer available to Rockhampton via the 11kV distribution
(already incorporated into Figure 7, below), with the potential to increase this to 2.4MVA, should
this prove cost effective compared to other options.
Figure 7 - Gracemere Subtransmission Safety Net Requirements
Figure 7, shows the required level of load against the Safety Net response times, looking out in to
the future. As opposed to loss of transformer capacity, there is no opportunity to utilise a Nomad to
recover from a failure of the subtransmission line, however as noted, this is generally achieved
within 6 hours. Enhanced operational plans are being developed to ensure coverage for less likely
(but still credible) contingencies, however the scope of these will be dependent upon the full range
of mitigation opportunities available, some of which may be proposed by respondents to this
Addendum.
Without action, non-compliance with the Safety Net is forecast to occur by 2018/19.
page 102.5.2 Distribution Feeder Utilisation Levels
With reference to Table 5 - Distribution Network Loading, it can be seen that by 2021/22, under the
current forecast, the average loading of the distribution feeders supplying Gracemere will exceed
the 75% target utilisation level. This does not represent a statutory non-compliance, but does
breach Ergon Energy’s internal Planning Criteria. These targets have been published7 and agreed
to by the Queensland Government and other regulating bodies. As such, distribution network
loading levels require addressing as part of the overall plan for the Gracemere area.
2.6 Value of Customer Reliability
Initial planning studies have identified that a significant augmentation may be justified on the basis
of the VCR improvement it creates, somewhere between 2019 and 2021. This augmentation could
involve construction of a new zone substation at Gracemere or an upgrade of the existing Malchi
Zone Substation.
Due to the nature of the cost/benefit relationship present in the VCR methodology, the exact timing
and form of any future augmentation will be heavily influenced by future network forecasts, costs
for mitigation options provided by respondents to this Addendum (and/or internally generated
mitigation options), network operability and safety, and the cost of that augmentation itself.
7
https://www.ergon.com.au/__data/assets/pdf_file/0006/167559/EE.DAPR.2013.PartA-Final-v1.1.pdf, p51.
page 113. Corrective Action
3.1 Timelines
The earliest identified non-compliance within the Gracemere network is forecast to occur during the
summer of 2016/17. In order to provide sufficient time to undertake necessary reliability corrective
action(s)8 a decision about the selected option(s) is required by January 2015 if any option
involving significant construction is to be completed by November 2016.
3.2 Known Future Network and Generation Development
(i.e. projects that have been approved and are firm to proceed)
Ergon Energy is not aware of any other network augmentations or generation developments in the
Gracemere area that could relieve the emerging non-compliances described above.
3.3 Summary of Identified Need
Ergon Energy is seeking network and/or non-network solutions (either alone or in combination with
one or more other elements) to address the forecast non-compliance. This process is being
undertaken internally (for both types of solutions), but this Addendum (and the previous Request
for Information) provides external proponents an opportunity to offer solutions (or even
suggestions) to address the identified need.
In summary, by the summer of 2016/17, during a contingency involving loss of supply through one
transformer at Malchi Zone Substation, Ergon Energy would not be able to meet the full set of
minimum required performance standards as set down in the Safety Net. The size of the non-
compliance will then continue to grow beyond this point, in step with growth in customer electrical
demand. Additionally, by 2017/18, during an extremely hot day, the Malchi Zone Substation may
not be able to supply the full customer demand during “system normal” conditions. There are also
growing constraints on the 11kV distribution network and Safety Net constraints on the 66kV
supply, all of which need addressing.
The load in Gracemere has been growing strongly for approximately the last 10 years, however
should demand growth taper off, the timing of any non-compliance will push further into the future.
This will actually improve the value of non-network options as deferral of large network expenditure
can be achieved with smaller increments of targeted load reduction or capacity increases.
3.4 Internal Options that Address the Identified Need
Ergon Energy had identified opportunities to address the forecast non-compliances and in the
absence of more suitable external options (or combinations of options), will further develop the
internally identified options through to construction/deployment at the appropriate time.
As discussed, an opportunity exists to increase network load transfer by at least 1.4MVA at what is
likely to be a fairly modest cost. Should this be implemented, the first forecast non-compliance
8
As defined in the National Electricity Rules, Section 5.10.2 - Definitions.
page 12would then occur in 2017/18. Further minor network transfer opportunities may be possible, but
are likely to be either smaller in total capability and/or more expensive to implement.
Additionally, Ergon Energy already owns a site in Gracemere on the corner of Lawrie, Platen,
James and John streets for a future zone substation. Construction of a substation on this site will
address the entirety of the forecast non-compliance for many years; however it will come at a cost
that is likely to be more than $10 million (exclusive of overheads). Other lower cost network
options are also being explored.
Internal, non-network options, including temporary embedded generation (supplied by Ergon
Energy) and demand management have also been proposed; however a final decision will only be
made once all opportunities are considered and compared.
3.5 Alternative and Non-Network Solutions
Ergon Energy has a very strong focus on keeping our customers’ electricity costs as low as
possible, while delivering electricity to the appropriate standards. It is our understanding that this
can best be achieved by working with our customers to better understand their needs and by
working collaboratively with external proponents to identify opportunities to achieve those goals
more cost effectively.
As a result, where additional information (beyond that provided in the Request for Information, this
Addendum or our annual network plans and reports9) can assist a potential proponent to optimise
their proposed solution, Ergon Energy will endeavour to provide the appropriate data. It should be
noted however that privacy laws prevent disclosure of some information.
Without attempting to limit the options available to potential respondents to this Addendum, Ergon
Energy also believes that significant value can be gained by providing some direction on the types
of alternative solutions that can address the issues raised and the format for responses that enable
easier comparison of options.
3.6 Minimum Requirements for All Options
Either alone or in combination with other network and/or non-network options, all proposed
solutions, as a minimum, must be:
• Able to address the identified need
• Commercially feasible
• Technically feasible
• Able to be implemented in sufficient time to meet the identified need
3.7 Internally identified non-network solutions
The forecast non-compliances identified above are driven predominantly by erosion of spare
network capacity due to growth in electrical demand. As such, non-network solutions that cost
effectively address either the increasing demand, or the forecast lack of network capacity are likely
to represent a reasonable alternative option.
9
https://www.ergon.com.au/network/network-management/network-plans-and-reports
page 13A non-exhaustive list of potential non-network options includes:
1) New embedded network generation (peaking, or small base load)
2) Existing customer generation
3) Load curtailment or “Call-off-load” opportunities
4) Customer demand management and/or energy efficiency programs
5) Embedded energy storage systems
3.7.1 Discussion
Potential respondents should give careful consideration to the shape of the demand curve and the
thermally-driven nature of the peak. The main demand period occurs on hot days (so generally in
summer) and typically begins during the late afternoon and continues through to around 9pm at
night.
All proponents should consider public acceptance of the technology/system and if it requires a site
within the network to operate. For example, proposing to site one or more diesel generators in the
middle of a residential neighbourhood is unlikely to be acceptable to our customers or to us.
Finally, potential proponents should note that Ergon Energy does not expect that a single
proposal/technology/opportunity would necessarily provide a 100% solution. Consider where
synergies could be gained with other technologies to enhance operability, reduce cost, etc. Ergon
Energy will also consider how different proposals could work together (even if the proponents have
not identified the synergy themselves) or with smaller network solutions to find an optimum hybrid
solution.
3.7.2 Embedded Generation
Proponents for embedded network generation need to consider the operability and safety of their
systems during operation.
Generally, generating units that are capable of operating in “island mode” represent a more difficult
(and thus costly) technical challenge to operate safely and within the requirements of the National
Electricity Rules (as described in the Request for Information). However, with care they can
generally be located anywhere within the target network (except on the fringes where conductor
sizes would limit usefulness).
Generating units that are to be operated synchronised to the network, are limited to those parts of
the network that can be backed up from adjacent networks, but provide additional usefulness
enhancing the “reach” of those backup paths. Figure 1 - Gracemere Distribution and
Subtransmission Network shows where these interconnections occur.
Existing (or proposed) customer generation is limited to the customer’s site and depending on the
size of the unit(s) are often not economical to connect and synchronise to the network. These can
provide assistance by removing the customer’s load from the network during contingencies. Due
to the generator not being connected to the network, these are the simplest (and thus usually
cheapest) type of embedded generator.
3.7.3 Curtailment/Call Off Load
The availability of customers who can either be entirely or partially curtailed when called upon is
effectively equivalent to customer generation, without the need to have a generator on site. This
page 14can be applied to customers of all sizes, however potential proponents should consider that Ergon
Energy will require a minimum block size of 100kVA. This can be achieved by aggregating
sufficient smaller blocks of load, however Ergon Energy would then deal with the aggregator, not
directly with the sub blocks.
Note carefully the discussion in Section 1.1 Safety Net (d) – customers above 1.5MVA who do not
have an existing N-1 supply agreement with Ergon Energy may be shed during a contingency for
the purposes of Safety Net.
Consideration also needs to be given to alignment between the proposed Call Off Load
opportunity’s load profile and the peak demand period in the early evening. For example, a
hypothetical bakery may have a peak demand of, say, 100kVA, but as they do not operate at all
during the peak anyway, they do not represent an opportunity.
3.7.4 Customer Demand Management and Energy Efficiency Programs
As the forecast non-compliances in the Gracemere area are due to increasing demand, programs
that directly address this load growth present an opportunity for long term benefit. As per Section
3.7.3 , Ergon Energy requires a minimum 100kVA block of reduction (when measured at the Zone
Substation), not total customer load. If, for example, the proponent proposes a program that can
achieve a 10% reduction in demand during the evening peak period, then at least 1MVA of
customer load would need to be aggregated to achieve the minimum block size. Again, it would be
the aggregator’s responsibility to deal directly with any sub-blocks within group.
3.7.5 Embedded Energy Storage
The forecast non-compliances in the Gracemere network are related to a lack of capability during a
contingency, not generally during “system normal”. As such, it is possible that years can pass
without the backup being “triggered” by a contingency occurring during a high load period. Battery
(or other) storage used in this manner is unlikely to be technically or financially feasible.
Where battery storage is used to shave off the evening peak, this would have a direct effect upon
the size of load at risk, and thus during a contingency. Proponents of battery storage systems
should, as a minimum, consider how their system could be cost effective when compared against
embedded generation systems that only operate post contingency.
Energy storage is also not simply limited to storage of electricity; thermal energy in the form of
chilled water storage for air conditioning is a proven cost-effective technology in the correct
location. Potential proponents should give consideration to how such a system could be usefully
and cost-effectively implemented in Gracemere.
page 153.8 Options that are unlikely to be feasible
Again, without attempting to limit a potential proponent’s ability to innovate when considering
opportunities, some technologies/approaches are unlikely to represent a technically or financially
feasible solution.
3.8.1 Solar Generation
Gracemere has experienced a high growth in solar photovoltaic (PV) system connections which
has tended to depress the daytime load, shortening the duration of the evening peak. This may
assist in reducing how long other technologies have to operate before the demand naturally
reduces into the late evening.
However as the high demand period continues until after dark, solar generation (either PV or
thermal) without some form of energy storage is unlikely to represent a useful option.
3.8.2 Wind Generation
The Central Queensland area is not known for being particularly windy and when combined with
the intermittent nature of the supply, wind generation (by itself) is unlikely to be feasible.
3.8.3 Unproven, Experimental or Undemonstrated Technologies
Ergon Energy strongly supports innovation; however, we are also required to carefully manage our
network, including (but not limited to) safety, reliability and financial risks.
The Gracemere area is a real location with real customers and real risks, where we are required to
maintain a level of network reliability, while managing cost. It is not intended to be a “test bed”
location for unproven technologies. Other opportunities for this type of innovation may be offered
by Ergon Energy from time to time and proponents are encouraged to seek these out when they
arise.
Where insufficient information is available on a proposed opportunity/technology to allow us to
evaluate risk against other better understood technologies, Ergon Energy would be very unlikely to
seek to progress these opportunities.
page 163.9 Evaluating Proposals
3.9.1 Section 5 of the Request for Information
Any proposal must, at a minimum, be able to meet the technical requirement in Schedule 5.1 of the
National Electricity Rules (as discussed in Section 5 of the Request for Information), where those
requirements are applicable to the proposed solution.
With the exception of Section 5.4 Quality, the remainder of Section 5 of the Request for Information
is no longer applicable (Size, Timing, Location, Reliability and Longevity) – respondents should
carefully consider the detailed discussion of the timing, size, location and form of forecast non-
compliance included in this Addendum and are encouraged to develop innovative solutions that
address these issues.
3.9.2 Information to Assist the Evaluation Process
In order to assist Ergon Energy to evaluate any proposals or identified opportunities, respondents
to this Addendum are asked to carefully consider the structure of their response. In addition to any
other information discussed in the Request for Information, where possible/applicable, the following
information should be included:
• Information about the proponent, including business structure
• Year by year costs to Ergon Energy
• Any commissioning or decommissioning costs
• The structure of “availability” and “operating” costs, if applicable
• Site information (if appropriate) including proposed ownership/lease arrangements
• Connection requirements between proposed solution and Ergon Energy’s network, if any.
• Any identified/claimed material National Electricity Market impacts (both positive and
negative see National Electricity Rules) and the basis for any claims thus made.
• Any known applicable risks (financial, company, operability, chemical, electrical, other
safety related risks).
• Responsibility/obligations of all parties to the opportunity
• How the proponent propose to deliver the proposal should it prove feasible (or if it would be
Ergon Energy’s partial or whole responsibility)
• Who is proposed to build, own and operate the solution (can be different answers for each)
• Proposed timeline, including earliest delivery date
• Limitations of the proposed solution (for example, maximum or minimum size, availability,
reliability)
• Period of any proposed contractual agreement and the structure of any early termination or
contract extension clauses proposed to be included
Proposals that have a high level of “deployment readiness” will be considered favourably, however
Ergon Energy does not require proponents to have a fully designed, financed and/or ready to be
deployed solution prior to responding to this Addendum.
page 174. Submissions and Next Steps
4.1 Timetable for Submissions
Submissions in writing are due by 4 November 2014 and should be lodged to:
Attention: Network Development
Email: regulatory.tests@ergon.com.au
4.2 Assessment and Decision Timetable
Ergon Energy intends to carry out the following process to assess what action should be taken to
address the identified distribution network limitations:
Request for (initial) Information Date Released:
Step 1
19/12/2013
Closed:
Step 2 Submissions in response to the Request for Information.
20/02/2014
Date Released:
Step 2a Addendum to Request for Information (this document)
09/09/2014
Due Date:
Step 3 Submissions in response to the Addendum to the Request for Information
04/11/2014
Review and analysis by Ergon Energy. Anticipated to be
Step 3 This is likely to involve further consultation with proponents and additional data completed by:
may be requested. 18/11/2014
Anticipated to be
Release of Ergon Energy’s Consultation Paper and Draft Recommendation of released by:
Step 4
solution which satisfies the Regulatory Test.
02/12/2014
Due Date:
Step 5 Submissions in response to the Consultation Paper & Draft Recommendation.
30/12/2014
Anticipated to be
Step 6 Release of Final Recommendation (including summary of submissions received). released by:
13/01/2015
Ergon Energy reserves the right to revise this timetable at any time. The revised timetable will be made available on the
Ergon Energy website.
Table 6 - Assessment & Decision Timetable
Ergon Energy will use its reasonable endeavours to maintain the consultation program listed
above. However this program may alter due to changing power system conditions or other
circumstances beyond the control of Ergon Energy. Updated information will be made available on
our website:
https://www.ergon.com.au/network/network-management/network-infrastructure/regulatory-test-
consultations
The consultation timetable is driven by the need to make a decision by January 2015 if any option
involving significant construction is to be in place by November 2016.
At the conclusion of the consultation process, Ergon Energy intends to take steps to progress the
recommended solution(s) to ensure any statutory non-compliance is addressed and undertake
appropriately justified network reliability improvement(s), as necessary.
page 18You can also read