Influence of Dust Deposition on the Electrical Parameters of Silicon-Based Solar Panels Installed in Senegal (Dakar Region)
←
→
Page content transcription
If your browser does not render page correctly, please read the page content below
Energy and Power Engineering, 2021, 13, 174-189
                                                                                              https://www.scirp.org/journal/epe
                                                                                                         ISSN Online: 1947-3818
                                                                                                           ISSN Print: 1949-243X

Influence of Dust Deposition on the Electrical
Parameters of Silicon-Based Solar Panels
Installed in Senegal (Dakar Region)

Dialo Diop1*, Moulaye Diagne2, Abel Sambou1, Pascal Djicoly Bassene1,
Serigne Abdoul Aziz Niang1, Astou Sarr1
1
 Groupe des Laboratoires de Physique des Solides des Sciences des Matériaux (GLPSSM), Département de Physique, Faculté des
Sciences et Techniques (FST), Université Cheikh Anta Diop, Dakar, Sénégal
2
 Laboratory of Semiconductor and Solar Energy, Department of Physics, Faculty of Science and Techniques, University Cheikh
Anta Diop, Dakar, Senegal

How to cite this paper: Diop, D., Diagne,      Abstract
M., Sambou, A., Bassene, P.D., Niang, S.A.A.
and Sarr, A. (2021) Influence of Dust          In recent years, photovoltaic (PV) modules are widely used in many applica-
Deposition on the Electrical Parameters of     tions around the world. However, this renewable energy is plagued by dust,
Silicon-Based Solar Panels Installed in Se-
                                               airborne particles, humidity, and high ambient temperatures. This paper stu-
negal (Dakar Region). Energy and Power
Engineering, 13, 174-189.                      dies the effect of dust soiling on silicon-based photovoltaic panel performance
https://doi.org/10.4236/epe.2021.135012        in a mini-solar power plant located in Dakar (Senegal, 14˚42'N latitude,
                                               17˚28'W longitude). Results of the current-voltage (I - V) characteristics of
Received: April 20, 2021
                                               photovoltaic panels tested under real conditions. We modeled a silicon-based
Accepted: May 28, 2021
Published: May 31, 2021                        PV cell in a dusty environment as a stack of thin layers of dust, glass and sili-
                                               con. The silicon layer is modeled as a P-N junction. The study performed
Copyright © 2021 by author(s) and              under standard laboratory conditions with input data of irradiation at 1000
Scientific Research Publishing Inc.
                                               W/m2, cell temperature at 25˚C and solar spectrum with Air Mass (AM) at
This work is licensed under the Creative
Commons Attribution International              1.5 for the monocrystalline silicon PV cell (m-Si). The analysis with an ellip-
License (CC BY 4.0).                           someter of dust samples collected on photovoltaic panels allowed to obtain
http://creativecommons.org/licenses/by/4.0/    the refraction indices (real and imaginary) of these particles which will com-
                Open Access
                                               plete the input parameters of the model. Results show that for a photon flux
                                               arriving on dust layer of 70 μm (corresponding to dust deposit of 3.3 g/m2)
                                               deposited on silicon-based PV cells, short circuit current decreases from 54
                                               mA (for a clean cell) to 26 mA. Also, conversion efficiency decreases by 50%
                                               compared to clean cell and the cell fill factor decreases by 76% - 50% com-
                                               pared to reference PV cell.

                                               Keywords
                                               Dust Deposition, PV Cell, Fill Factor, Modeling, Ellipsometer

DOI: 10.4236/epe.2021.135012          May 31, 2021               174                               Energy and Power Engineering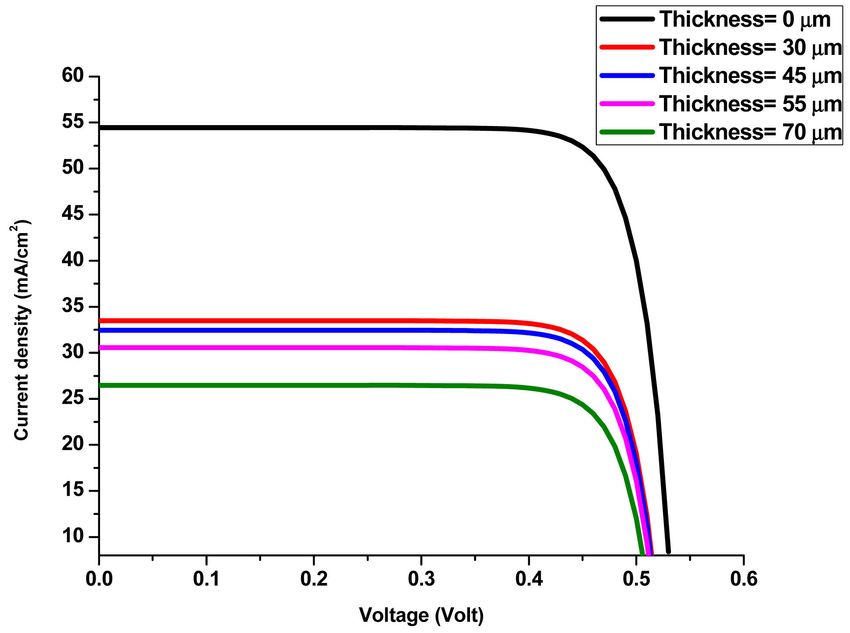
D. Diop et al.

                               1. Introduction
                               The rapid growth of photovoltaic technologies in the world is very important
                               and contributed to global electricity generation [1] [2]. Research and develop-
                               ment in the field of solar energy continue to focus primarily on optimizing the
                               efficiency of PV cells. With 3.000 hours of sunshine per year and global irradia-
                               tion of 5.8 kWh/m2/day, Senegal has a significant potential for the development
                               of photovoltaic power generation [3] [4] [5]. Solar production is affected by sev-
                               eral factors such as local environment, weather conditions, PV panel tilt angle,
                               dust accumulated on PV cells, etc. [1] [2]. Among these different factors, deposi-
                               tion of dust on PV cell surfaces is a crucial element that affects their perfor-
                               mances. In fact, after their manufacture, solar panels are installed and exposed in
                               open air for electricity generation. Thus, the accumulation of dust on their sur-
                               face gives rise to the thin layer. Thus, the layer with some thickness can mask
                               exposure to sun and absorb some incident radiation beam. This led to a signifi-
                               cant decrease in the electrical parameters [6] [7]. In addition, solar production is
                               also affected by several factors such as local environment, weather conditions,
                               PV panel tilt angle, dust accumulated on PV cells, etc. [8] [9] [10] [11]. Among
                               these different factors, deposition of dust on PV cell surfaces is a crucial element
                               to study. It is a natural phenomenon and depends on several parameters such as
                               local environment and meteorological parameters [12] [13]. Senegal is close to
                               Sahara Desert and this region is among the largest sources of dust in the world
                               [14]. According to Paudyal and Shakya [15], decrease in electricity production
                               due to dust deposits was 3.16% in one day, reached 10.41% in ten days and fi-
                               nally 15.74% in one month. Thus, Kaldellis and Kapsali [16] and Moehlecke [17]
                               showed that solar energy production decreases significantly in presence of dust.
                               For example, Chanchangi et al. [18] used a solar simulator and studied the effect
                               of accumulation of 13 different samples (ashes, bird droppings, carpet dust, ce-
                               ment, dust, etc.) on the performance of PV modules. Afterwards, they noted a
                               decrease of about 98% in short circuit current. Similarly, Adıgüzel et al. [19]
                               found 15 g of dust on crystalline silicon modules, power loss of 62%. Moreover,
                               Hachicha et al. (2019) [20] collected dust of different sizes (from 1.61 to 38.40
                               μm) and various shapes. They concluded that the yield decreases by 1.7% per
                               g/m2 of accumulated dust. In addition, Jiang and Sun [21] presented monocrys-
                               talline silicon (mc-Si), polycrystalline silicon (pc-Si) and amorphous silicon
                               (a-Si) technologies. Their results showed 0% - 26% yield reduction for dust de-
                               posits increasing from 0 to 22 g/m2. In Senegal, Ndiaye et al. [6] exposed PV pa-
                               nels to natural climatic factors for one year and found maximum power decrease
                               of 18% - 78% for polycrystalline and monocrystalline modules, respectively. Said
                               and Walwil [22] noted an average reduction in short circuit current of about
                               13% after 5 weeks of exposure. In fact, several studies on factors affecting pho-
                               tovoltaic energy have been carried out worldwide [23], in Africa and particularly
                               in Senegal. However, modeling studies focusing on interaction of solar radiation
                               with dust deposited on surfaces of these PV cells are still missing. Therefore, a

DOI: 10.4236/epe.2021.135012                        175                               Energy and Power Engineering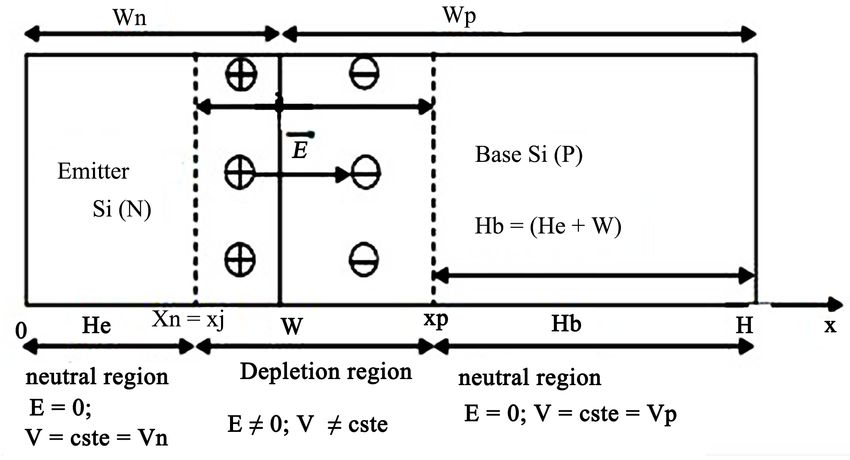
D. Diop et al.

                               comparative approach of two PV cells has been adopted in this work to study the
                               influence of dust deposits on operating characteristics of PV cells. In addition,
                               research and development in the field of solar energy continue to focus primarily
                               on optimizing the efficiency of PV cells. This paper aims to contribute the im-
                               provement of performance of PV cells in Senegal. We study losses of short cir-
                               cuit current, power output, conversion efficiency and fill factor of PV cells as a
                               function of dust deposit on their surfaces.
                                 The paper is divided into three parts. The first part presents methodology (mod-
                               eling). Then, the second part presents the results of simulations resulting from
                               modeling of the losses of electrical parameters of silicon-based solar cell in pres-
                               ence of dust deposit on the surface. Finally, the last part presents the conclusion.

                               2. Methods
                               The monocrystalline silicon cell installed in a dusty environment is modeled as a
                               stack of thin layers (dust/glass/silicon) as shown in Figure 1. This allows to eva-
                               luate the electrical losses of solar cells in presence of dust on the surface of PV
                               modules. Reflection and transmission coefficients at the interface of these layers
                               obtained from refractive indices of the dust. Thus, the dust refraction is obtained
                               thanks to an ellipsometer that analyzes collected dust samples. Also, the global
                               reflectance of multilayer system obtained from the Fresnel reflection and trans-
                               mission coefficients. Thus, the refraction indices and global reflectances of the
                               different layers will be used as input data for the model. The influence of dust on
                               the energy production of silicon-based solar cell has studied. Silicon layer is con-
                               sidered as an N-P junction structure as shown in Figure 2. This model used to
                               determine the current densities, various cell characteristics such as short-circuit
                               current, open circuit voltage, power output, conversion efficiency and form fac-
                               tor of the PV cell in the presence of dust deposition on the PV surface in all N, P
                               and space charge area (SCA) zones of the solar cell. When surface of cell is illu-
                               minated by flow of light, the cell creates charge carriers such as electrons and
                               holes. Electron-hole pairs created in the space charge zone of P-N junction are
                               immediately separated by a electric field in this region and carried

                                                Figure 1. Stacting of dust/glass/silicon.

DOI: 10.4236/epe.2021.135012                        176                                     Energy and Power Engineering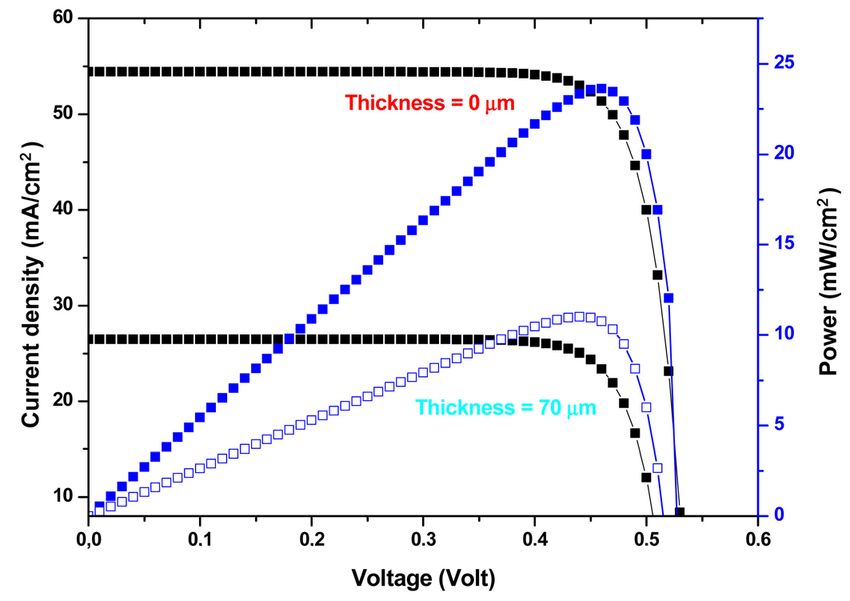
D. Diop et al.
Figure 2. Dimensions of Si(N)/Si(P) silicon-based solar cell.
into. They carried the neutral zones on either side of the junction. If the device is
insulated, a potential difference appears across the junction and if it is connected
to an external electric charge, free electrons must pass through the charge to re-
combine with positive holes; thus, current can be generated from the cells under
illumination [24].
Thus, to study the influence of dust on energy production of silicon-based so-
lar cell, the silicon layer considered as an N-P junction structure as shown in
Figure 2. It allows to study the influence of dust on energy production of sili-
con-based solar cell.
In our study, the surface transport of minority carriers and consequently the
surface current is neglected. The continuity equation allows to determine, at any
point and at any time, the concentration of carriers in a semiconductor. When
light illuminates the surface of the emitter with certain wavelength λ, there is an
electron-hole pair generation whose generation rate G(λ) is expressed by Equa-
tion (1) [24] [25]. This model developed by Mahfoud [26].
G ( λ=
) α ( λ ) ⋅ F ( λ ) ⋅ 1 − R ( λ ) ⋅ exp ( −α x ) (1)
F(λ): Spectral flux of incident photons,
α(λ): Absorption coefficient of the material,
R(λ): Reflection coefficient at surface of the material.
However, the pairs photogenerated carriers do not remain static and their
continuity equation is written [27]:
∂ 2δ ( x ) δ ( x)
D⋅ + G (λ ) − 0
= (2)
∂x 2
τ
D: Diffusion coefficient of minority carriers,
δ(x): Excess minority carrier’s density,
τ: lifetime of electrons.
2.1. Density of Excess Minority Holders in the Base
Minority charge carriers generated (electrons) in P-type base of the photopile,
under effect of illumination with monochromatic light, are electrons of charge
DOI: 10.4236/epe.2021.135012 177 Energy and Power Engineering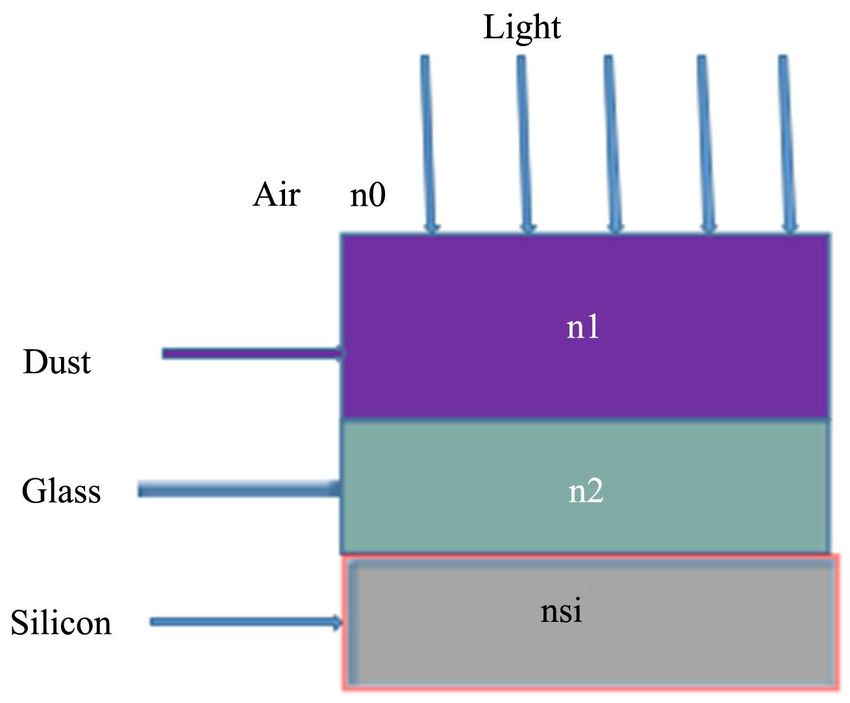
D. Diop et al.
−q. Indeed, density of these generated carriers in the base is determined from
continuity equation. Thus, when we consider phenomena of generation, recom-
bination and diffusion of excess minority carriers in the base, this equation is
written in a static regime [27]:
d2 ( np − np0 ) np − np0
Dn ⋅ + G (λ ) − 0
= (3)
dx 2
τn
np − np0 = δ(x): density of the electrons generated in the base;
np0: density of electrons generated at equilibrium;
Dn: minority carriers’ diffusion of electrons in base and n: electrons in base.
Indeed, this continuity equation admits for general solution as:
x x τn
n p − n p 0 A cosh
= + B sinh − α × F × (1 − R ) 2 2 exp ( −α x ) (4)
Ln Ln α × Ln − 1
where Ln is the minority carriers diffusion length in the base and the coefficients
A and C are determinated by the following boundary conditions:
np − np0 = 0 (5)
Thus, density of minority carriers is as follows [28]:
Boundary conditions:
With x = He + w and x = H, we have:
− Dn × d ( n p − n p 0 )
Sn × ( n p − n p 0 ) = (6)
dx
α × F (1 − R ) × τ n −α ( H e + w) x − H e − w −α ( x − H e − w )
np − np0
= ×e × cosh −e
α 2 × L2n − 1 Ln
Sn Ln Hb H
cosh − exp ( −α H b ) + sinh b + α Ln exp ( −α H b )
Dn Ln Ln
− (7)
Sn Ln Hb Hb
× sinh + cosh
Dn Ln Ln
x − He − w
× sinh
Ln
τn: lifetime expectancy in the base,
w: width of the PN and Sn junction: recombination speed on the back surface,
He et Hb: width of the transmitter (P) and the base with Hb = H − (He + W),
Dn: distribution ratio of excess minority shareholders.
In the issuer, the charge carriers obey the following continuity equation:
d 2 ( pn − pn 0 ) pn − pn 0
Dp ⋅ + G (λ ) − 0
= (8)
dx 2
τp
Pn − Pn0: density of excess minority carriers and Pn0: density or concentration
of excess minority carriers at thermodynamic equilibrium;
τp: lifetime of excess minority shareholders.
Boundary conditions below, the equations below can be solved:
At the junction (x = 0); the rear side (x = He) and Pn − Pn0 = 0
DOI: 10.4236/epe.2021.135012 178 Energy and Power EngineeringD. Diop et al.
D p × d ( Pn − Pn 0 )
= S p ( Pn − Pn 0 ) (9)
dx
α × F (1 − R ) × τ p
pn − pno = 2 2
α × Lp − 1
S p Lp H − x S p Lp x x
+ α × L p sinh e
+
sinh + cosh exp ( −α H e )
Dp Ln Dp Lp Lp −α x
× −e
S p Lp H H
× sinh e + cosh e
Dp Lp Lp
(10)
Sp: front surface recombination velocities and Dp: hole diffusion coefficient ;
Lp: hole diffusion length.
2.2. Calculation of the Density of the Photocurrent in the Base
In PN junction cell, photocurrent generated by charge carriers (electrons) is
written [29].
∂ ( np − np0 )
I ph = q ⋅ A × (11)
∂x
=x He + w
q is the electron elementary charge.
A: illuminated surface of cell and the corresponding photocurrent density is:
I ph ∂ ( np − np0 )
J ph = =q × Dn × (12)
A ∂x
=x He + w
q ⋅ F (1 − R ) ⋅ α Ln −α ( H e + w )
=Jn ×e (13)
α 2 ⋅ L2n − 1
2.3. Calculation of Density of the Photo-Current in the Emitter
When we use the Equation (14), we found the photocurrent density in the emit-
ter by using the Equation (15):
I ph ∂ ( np − np0 )
J ph = =q × D p × (14)
A ∂x
x =0
q × F (1 − R ) × α L p
Jp =
α 2 × L2n − 1
S p Lp S p Lp x S p Lp x x
+ α × Lp −
cosh +
cosh + sinh exp ( −α H e ) (15)
D D L D L L −α x
× p
p p n p p
− α Lp e
S p Lp xj H
× sinh + cosh e
Dp Lp Lp
2.4. Calculation of the Density of the Photo-Current in the Space
Charge Zone (ZCE)
In this zone, photocurrent density is given by [27]:
DOI: 10.4236/epe.2021.135012 179 Energy and Power EngineeringD. Diop et al.
(
J zce = q × F (1 − R ) × exp ( −α H e ) × 1 − e −α w ) (16)
2.5. Total Photocurent Density
Total photocurrent density is sum of photocurrent densities of three zones
(P-N-ZCE) of photopile and is written as follow [30]:
J ph = J n + J P + J zce (17)
The photocurrent density over the entire spectrum is obtained by integrating
Jph current density over entire range of the solar spectrum used. Thus, Jtot is given
by:
λmax
J tot = ∫λ J ph ⋅ dλ (18)
min
All expressions used to calculate open circuit voltage (Vco), maximum power
(Pm), conversion efficiency (η) obtained from [31].
Pm Vmax × I max
= (19)
The Fill Factor (FF) and conversion efficiency (η) are expressed below as [32]
[33].
Pm Pm FF × I cc × Vco
FF
= η =
;= (20)
Vco × I cc Pi Pi
Vco, Icc, Pi: respectively, open circuit voltage, short circuit current and incident
light power. Vm, Im and Pm are respectively, voltage, current and maximum pow-
er.
3. Results and Discussions
In addition to standard parameters, we need the real and imaginary refractive
indices of dust to feed our model. For this purpose, we collected samples of dust
deposited on surface of the solar module in Dakar. These samples analyzed by
ellipsometry to obtain optical indices of particles deposited in Dakar over a pe-
riod of one year. Thus, Figure 3 shows the variation of real (Figure 3(a)) and
imaginary (Figure 3(b)) indices of dust deposited on the PV cell surfaces as a
function of wavelength. They will be used as input parameters for the model.
Indeed, imaginary refractive indices of the dust collected on the PV cell surfaces
over the whole spectrum obtained by the ellipsometer are a bit high compared to
the results of Colarco et al. [34]. They found mean imaginary aerosol indices
above Dakar at shorter wavelengths. This difference in value is explained by the
shift in the collection date and the composition of the dust which varies accord-
ing to the weather and weather conditions. However, the refraction indices
found in this study according to the work [35] [36] [37] [38] show the presence
of pure minerals and clays in this composition. These confirm that indices pro-
vided by the ellipsometer correspond to dust indices of the locality. Moreover,
according to work of Veselovskii et al. [39], the values of real dust indices of
Dakar, Senegal could be between 1.35 to 1.65 and those of the imaginary indices
between 0 to 0.02 and these values are quite close to those of the ellipsometer.
DOI: 10.4236/epe.2021.135012 180 Energy and Power EngineeringD. Diop et al.
Figure 3. Refractive indices of Saharan dust. Real index of dust particles (a) Imaginary in
dex of dust particles (b).
Figure 4 shows the evolution of photocurrent density (J) of the PV cell for
different dust layer thicknesses varying from 30, 45, 55 and 70 μm corresponding
respectively to dust deposit of 1.4; 2.1; 2.6 and 3.3 g/m2. It represents J-V cha-
racteristic for different dust deposits on surface of PV cell. Short-circuit current
of the cell decreases sharply as size of the dust layer increases. For a clean cell
(black curve on Figure 4) without dust, short circuit current is 54.44 mA. How-
ever, as dust accumulate on the surface of these panels, there is gradual decrease
in this short circuit current. For layer of 30, 45, 55 and 70 μm, short circuit cur-
rent is 33.5, 32.44, 30.54 and 26.45 mA respectively. Indeed, when dust settles on
the surface of cell, a large part of the light reflected and the photon flux arriving
at the surface reduced. This leads to a decrease in the temperature inside the cell.
According to Mahfoud [26], this decrease in short-circuit current is due to de-
crease in photon flux reaching the cell surface. Consequently, a dust layer 70 μm
thick leads to 51% reduction of this current compared to that of the clean cell.
These results were consistent with Chanchangi et al. [18]. They showed that
short circuit current of PV cells reduced by 46% when bird droppings deposited
on PV surfaces. In addition, these figures show that deposition of dust on PV
cells slightly reduces open circuit voltage as shown by Mani and Pillai [9]. Other
results such as [40] [41] corroborate with our results. Their work showed that
dust reduces short circuit current of solar cells. Moreover, according to Klug-
mann-Radziemska [42], short circuit current depends on irradiation. So, irradia-
tion reaching the cell decreases with the increase of dust deposited on PV cell
surface.
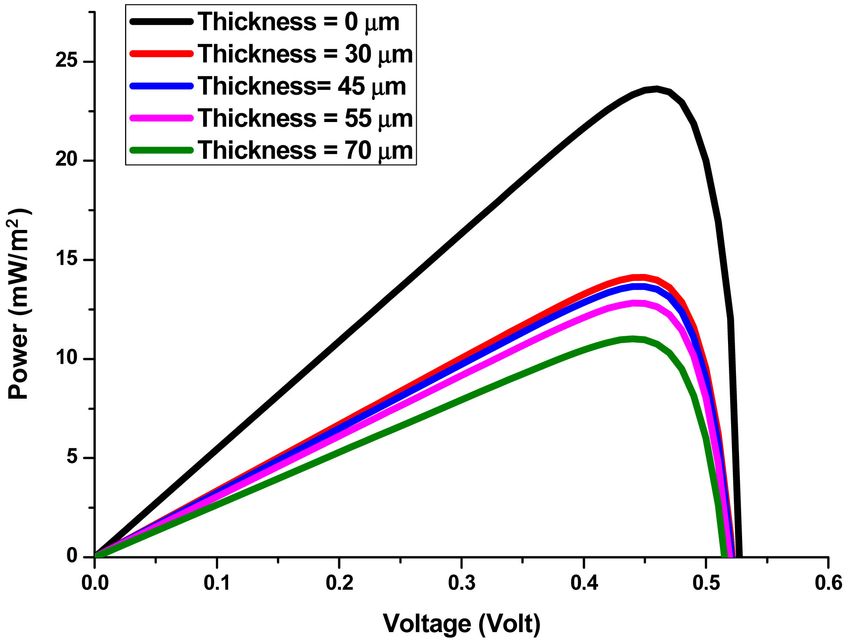
Figure 5 shows evolution of power produced by the silicon cell for different
layers of dust deposited on cell surface as a function of the supply voltage. Clean
DOI: 10.4236/epe.2021.135012 181 Energy and Power EngineeringD. Diop et al.
Figure 4. Current-voltage characteristics of cell for different dust layer thicknesses.
Figure 5. Power-voltage characteristic of cell for different dust layer thicknesses.
cell (dust layer thickness 0 μm corresponds to dust-free cell) whose power out-
put represented by the black curve and the green curve corresponds power out-
put of the room cell when a dust layer of 70 μm (dust deposit corresponding to
3.3 g/m2) deposited on surface of the PV cell. Indeed, they show a significant de-
crease from 23.62 mW/m2 to 11 mW/m2 for dust layer thicknesses ranging from
0 to 70 μm. Thus, we note a decrease of half of the power produced compared to
that of the clean cell. These results confirm those of Majeed et al. [43]. Moreover,
these curves show that when the thickness of the layer of dust deposited on the
cell increases from 30, 45 and 55 μm (corresponding respectively to a dust depo-
sit of 1.4, 2.1 and 2.6 g/m2), the power output decreases respectively by 14.12,
13.66 and 12.816 mW/m2.
DOI: 10.4236/epe.2021.135012 182 Energy and Power EngineeringD. Diop et al.
Figure 6 shows current-voltage characteristics between clean cell (dust layer
thickness 0 μm) and room cell (dust layer thickness 70 μm) (black curves) and
power-voltage characteristics of the silicon-based photovoltaic cell between clean
cell (dust layer thickness 0 μm) and room cell (dust layer thickness 70 μm) (blue
curves). Indeed, they show that the maximum power point (PPM) (correspond-
ing to 0.46 mA; 51.36 mW) of the clean cell increases from (0.44 mA; 25.038
mW) to unclean cell of dust deposit corresponding to 3.3 g/m2. This decrease in
production corresponds to a decrease in maximum power from 23.63 to 11.016
mW corresponding to a 53% decrease in production compared to the clean cell.
These losses are quite low compared to results of Nimmo and Said [44] who
noted 65% decrease. These differences in value could be due to different compo-
sitions of the Kuwaiti dust but also to climatic conditions. For variation of dust
layer thickness from 0 to 70 μm, power loss of about 12.614 mW observed.
Overall, this figure confirms results of Jiang and Lu [40] who showed that depo-
sition of dust on PV cell surfaces decreases output power of the cell. According
to Ndiaye et al. [6] decrease in cell power is due to the decrease in irradiance.
Indeed, the illumination flux is reflected by dust layers.
Figure 7 shows conversion efficiency of silicon cell for different dust layers
deposited on cell surface as a function of the size of dust layer. By increasing
dust deposit on the cell surface by (30, 45, 55 and 70 μm) corresponding to 1.4,
2.1, 2.6 and 3.3 g/m2 respectively, the conversion efficiency of PV cell increases
from 23% to 11%. When layer of dust 70 μm (corresponding to a deposit of 3.3
g/m2) deposited on surface of PV cell, conversion efficiency of the cell increases
from 23% to 11%. Thus, we can see that half of the cells production is lost due to
dust. These results corroborate to Chen et al, Guan et al. and Ramli et al. [32]
[45] [46] They concluded that productivity efficiency of photovoltaic cells de-
creases when dust accumulates on their surfaces. These studies have shown that
decrease in performance is due to reduced absorption of solar energy, as a small
fraction of the solar radiation passes through the dust layer and reaches the sur-
face of the PV module. Furthermore, according to Klugmann-Radziemska and
Hegazy [42] [47], the decrease in efficiency is due to decrease in light transmis-
sion through the glass cover when dust accumulates on PV cell surfaces. Ac-
cording to Ndiaye et al. Rao et al. [6] [23] the decrease in efficiency could be due
to the increase in temperature above the cell caused by the absorption of light by
the dust layers.
Figure 8 shows the fill factor of silicon-based cell for different layers of dust
deposited on cell surface. Indeed, this parameter provides information on quali-
ty of cell. For layer thickness variation from 0 to 70 μm, fill factor decreases from
76% to 50%. This decrease corresponds to 26% compared to clean cell. Thus, this
curve confirms degradation caused by dust on surfaces of monocrystalline sili-
con cells. The reduction of this factor is favored by the increase in temperature
on PV cell surface. It is due to absorption of photons and light by dust atoms
according to Ahmed et al. [48]. The decrease of the fill factor could be due to the
DOI: 10.4236/epe.2021.135012 183 Energy and Power EngineeringD. Diop et al.
Figure 6. Current-voltage characteristic for clean PV cell (dust layer thickness 0 μm) and
room PV cell (dust layer thickness 70 μm) (black curves); Power-voltage characteristic for
clean cell (dust layer thickness 0 μm) and room cell (dust layer thickness 70 μm) (blue
curves).
Figure 7. Cell conversion efficiency for different dust layer thicknesses.
Figure 8. Cell form factor for different dust layer thicknesses.
DOI: 10.4236/epe.2021.135012 184 Energy and Power EngineeringD. Diop et al.
increase in series resistance of the PV cell when the dust layer increases. Fur-
thermore, the behavior of the curve could be due to the difference in size of dust
particles or the structural properties of the collected dust [49] [50].
4. Conclusions
This work evaluated the influence of dust deposition on the electrical perfor-
mance of silicon-based photovoltaic cells by a model. Thus, the analysis of loss
of electrical characteristics as a function of dust is studied. Indeed, it allowed us
to evaluate the losses of electrical characteristics such as production efficiency,
power output, short-circuit current and fill factor of monocrystalline sili-
con-based photovoltaic cells as a function of dust deposited on the surface of
these solar modules in Dakar, Senegal.
Firstly, this work showed that the deposition of dust on PV cell surfaces does
not significantly change open circuit voltage. However, short-circuit current af-
fected by this dust deposit with loss of about 51% for a dust layer of 70 μm (cor-
responding to dust deposit of 3.3 g/m2) compared to clean cell current. Moreo-
ver, the main conclusion is that a cleaning of the cell should be considered in
order to optimize its electrical performance from dust layer thickness of 70 μm
(corresponding to dust deposit of 3.3 g/m2).
However, it would be interesting to extend this work by introducing into this
model, the influence of cell temperature but also by comparing it with experi-
mental studies. In addition, the realization of multi-layers of dust and glass on
the silicon cell could allow to measure the electrical parameters in real-time. This
study also has limitations because type of dust is not specified and dust layers are
assumed to be homogeneous. So, it would also make sense to take into account
the binding of dust atoms on the surfaces of PV modules.
Conflicts of Interest
The authors declare no conflict of interest regarding the publication of this pa-
per.
References
[1] IEA (2014) Technology Roadmap: Solar Photovoltaic Energy. International Energy
Agency, Paris.
[2] Al-Waeli, A.H.A., Chaichan, M.T., Sopian, K., Kazem, H.A., Mahood, H.B. and
Khadom, A.A. (2019) Modeling and Experimental Validation of a PVT System Us-
ing Nanofluid Coolant and Nano-PCM. Solar Energy, 177, 178-191.
https://doi.org/10.1016/j.solener.2018.11.016
[3] Drame, M., Ould Bilal, B., Camara, M., Sambou, V. and Gaye, A. (2012) Impacts of
Aerosols on Available Solar Energy at Mbour, Senegal. Journal of Renewable and
Sustainable Energy, 4, Article ID: 013105. https://doi.org/10.1063/1.3682078
[4] Diouf, B., Pode, R. and Osei, R. (2013) Initiative for 100% Rural Electrification in
Developing Countries: Case Study of Senegal. Energy Policy, 59, 926-930.
https://doi.org/10.1016/j.enpol.2013.04.012
[5] Youm, I., Sarr, J., Sall, M. and Kane, M.M. (2000) Renewable Energy Activities in
DOI: 10.4236/epe.2021.135012 185 Energy and Power EngineeringD. Diop et al.
Senegal: A Review. Renewable and Sustainable Energy Reviews, 4, 75-89.
https://doi.org/10.1016/S1364-0321(99)00009-X
[6] Ndiaye, A., Kébé, C.M., Ndiaye, P.A., Charki, A., Kobi, A. and Sambou, V. (2013)
Impact of Dust on the Photovoltaic (PV) Modules Characteristics after an Exposi-
tion Year in Sahelian Environment: The Case of Senegal. International Journal of
Physical Sciences, 8, 1166-1173.
[7] Dajuma, A., Yahaya, S., Touré, S., Diedhiou, A., Adamou, R., Konaré, A. and Golba,
M. (2016) Sensitivity of Solar Photovoltaic Panel Efficiency to Weather and Dust
over West Africa: Comparative Experimental Study between Niamey (Niger) and
Abidjan (Côte d’Ivoire). Computational Water, Energy, and Environmental Engi-
neering, 5, 123-147. https://doi.org/10.4236/cweee.2016.54012
[8] Youm, I., Sarr, J., Sall, M., Ndiaye, A. and Kane, M.M. (2005) Analysis of Wind Da-
ta and Wind Energy Potential along the Northern Coast of Senegal. Revue des
Energies Renouvelables, 8, 95-108. http://www.webreview.dz/spip.php?rubrique191
[9] Mani, M. and Pillai, R. (2010) Impact of Dust on Solar Photovoltaic (PV) Perfor-
mance: Research Status, Challenges and Recommendations. Renewable and Sus-
tainable Energy Reviews, 14, 3124-3131. https://doi.org/10.1016/j.rser.2010.07.065
[10] Heimsath, A. and Nitz, P. (2019) The Effect of Soiling on the Reflectance of Solar
Reflector Materials-Model for Prediction of Incidence Angle Dependent Reflectance
and Attenuation Due to Dust Deposition. Solar Energy Materials and Solar Cells,
195, 258-268. https://doi.org/10.1016/j.solmat.2019.03.015
[11] Tanesab, J., Parlevliet, D., Whale, J. and Urmee, T. (2019) The Effect of Dust with
Different Morphologies on the Performance Degradation of Photovoltaic Modules.
Sustainable Energy Technologies and Assessments, 31, 347-354.
https://doi.org/10.1016/j.seta.2018.12.024
[12] Gupta, V., Sharma, M., Pachauri, R.K. and Babu, K.D. (2019) Comprehensive Re-
view on Effect of Dust on Solar Photovoltaic System and Mitigation Techniques.
Solar Energy, 191, 596-622. https://doi.org/10.1016/j.solener.2019.08.079
[13] Alnasser, T.M., Mahdy, A.M., Abass, K.I., Chaichan, M.T. and Kazem, H.A. (2020)
Impact of Dust Ingredient on Photovoltaic Performance: An Experimental Study.
Solar Energy, 195, 651-659. https://doi.org/10.1016/j.solener.2019.12.008
[14] Marticorena, B., Bergametti, G., Aumont, B., Callot, Y., N’Doumé, C. and Legrand,
M. (1997) Modeling the Atmospheric Dust Cycle: 2. Simulation of Saharan Dust
Sources. Journal of Geophysical Research: Atmospheres, 102, 4387-4404.
https://doi.org/10.1029/96JD02964
[15] Paudyal, B.R. and Shakya, S.R. (2016) Dust Accumulation Effects on Efficiency of
Solar PV Modules for Off Grid Purpose: A Case Study of Kathmandu. Solar Energy,
135, 103-110. https://doi.org/10.1016/j.solener.2016.05.046
[16] Kaldellis, J.K. and Kapsali, M. (2011) Simulating the Dust Effect on the Energy Per-
formance of Photovoltaic Generators Based on Experimental Measurements. Ener-
gy, 36, 5154-5161. https://doi.org/10.1016/j.energy.2011.06.018
[17] Moehlecke, A., Febras, F.S. and Zanesco, I. (2013) Electrical Performance Analysis
of PV Modules with Bifacial Silicon Solar Cells and White Diffuse Reflector. Solar
Energy, 96, 253-262. https://doi.org/10.1016/j.solener.2013.07.028
[18] Chanchangi, Y.N., Ghosh, A., Sundaram, S. and Mallick, T.K. (2020) An Analytical
Indoor Experimental Study on the Effect of Soiling on PV, Focusing on Dust Prop-
erties and PV Surface Material. Solar Energy, 203, 46-68.
https://doi.org/10.1016/j.solener.2020.03.089
[19] Adıgüzel, E., Özer, E., Akgündoğdu, A. and Yılmaz, A.E. (2019) Prediction of Dust
DOI: 10.4236/epe.2021.135012 186 Energy and Power EngineeringD. Diop et al.
particle Size Effect on Efficiency of Photovoltaic Modules with ANFIS: An Experi-
mental Study in Aegean Region, Turkey. Solar Energy, 177, 690-702.
https://doi.org/10.1016/j.solener.2018.12.012
[20] Hachicha, A.A., Al-Sawafta, I. and Said, Z. (2019) Impact of Dust on the Perfor-
mance of Solar Photovoltaic (PV) Systems under United Arab Emirates Weather
Conditions. Renewable Energy, 141, 287-297.
https://doi.org/10.1016/j.renene.2019.04.004
[21] Jiang, H., Lu, L. and Sun, K. (2011) Experimental Investigation of the Impact of
Airborne Dust Deposition on the Performance of Solar Photovoltaic (PV) Modules.
Atmospheric Environment, 45, 4299-4304.
https://doi.org/10.1016/j.atmosenv.2011.04.084
[22] Said, S.A. and Walwil, H.M. (2014) Fundamental Studies on Dust Fouling Effects on
PV Module Performance. Solar Energy, 107, 328-337.
https://doi.org/10.1016/j.solener.2014.05.048
[23] Rao, A., Pillai, R., Mani, M. and Ramamurthy, P. (2014) Influence of Dust Deposi-
tion on Photovoltaic Panel Performance. Energy Procedia, 54, 690-700.
https://doi.org/10.1016/j.egypro.2014.07.310
[24] Faye, D., Gueye, S., Ndiaye, M., Ba, M.L., Diatta, I., Traore, Y. and Sissoko, G.
(2020) Lamella Silicon Solar Cell under Both Temperature and Magnetic Field:
Width Optimum Determination. Journal of Electromagnetic Analysis and Applica-
tions, 12, 43-55. https://doi.org/10.4236/jemaa.2020.124005
[25] Diao, A., Wade, M., Thiame, M. and Sissoko, G. (2017) Bifacial Silicon Solar Cell
Steady Photoconductivity under Constant Magnetic Field and Junction Recombina-
tion Velocity Effects. Journal of Modern Physics, 8, 2200-2208.
https://doi.org/10.4236/jmp.2017.814135
[26] Mahfoud, A. (2018) Modélisation des cellules solaires tandem à couches minces et à
haut rendement (Doctoral Dissertation).
[27] Ghandhi, S.K. (1977) Semiconductor Power Devices: Physics of Operation and Fa-
brication Technology. Wiley, New York, 329.
http://dspace.univ-setif.dz:8888/jspui/handle/123456789/1785
[28] Adolf, G., Joachim, K. and Bernhard, V. (1998) Crystalline Silicon Solar Cells.
Fraunhofer Institute for Solar Energy Systems, Freiburg.
[29] Orieux, A., Versteegh, M.A., Jöns, K.D. and Ducci, S. (2017) Semiconductor Devices
for Entangled Photon Pair Generation: A Review. Reports on Progress in Physics,
80, Article ID: 076001. https://doi.org/10.1088/1361-6633/aa6955
[30] Jain, V.K. and Verma, A. (2013) Physics of Semiconductor Devices: 17th Interna-
tional Workshop on the Physics of Semiconductor Devices. Springer Science &
Business Media, Berlin. https://doi.org/10.1007/978-3-319-03002-9
[31] Thompson, G.H.B. (1980) Physics of Semiconductor Laser Devices.
[32] Chen, Y., Wang, D., Liu, Y., Dong, Y. and Liu, J. (2019) Research on Photovoltaic
Performance Reduction Due to Dust Deposition: Modelling and Experimental Ap-
proach. Journal of Thermal Science, 28, 1186-1194.
https://doi.org/10.1007/s11630-019-1177-6
[33] Colinge, J.P. and Colinge, C.A. (2005) Physics of Semiconductor Devices. Springer
Science & Business Media, Berlin.
[34] Colarco, P.R., Toon, O.B., Torres, O. and Rasch, P.J. (2002) Determining the UV
Imaginary Index of Refraction of Saharan Dust Particles from Total Ozone Map-
ping Spectrometer Data Using a Three-Dimensional Model of Dust Transport.
Journal of Geophysical Research: Atmospheres, 107, AAC 4-1-AAC 4-18.
DOI: 10.4236/epe.2021.135012 187 Energy and Power EngineeringD. Diop et al.
https://doi.org/10.1029/2001JD000903
https://agupubs.onlinelibrary.wiley.com/action/doSearch?ContribAuthorStored=Ra
sch%2C+Philip+J
[35] Sokolik, I.N. and Toon, O.B. (1999) Incorporation of Mineralogical Composition
into Models of the Radiative Properties of Mineral Aerosol from UV to IR Wave-
lengths. Journal of Geophysical Research: Atmospheres, 104, 9423-9444.
https://doi.org/10.1029/1998JD200048
[36] Péré, J.C., Rivellini, L., Crumeyrolle, S., Chiapello, I., Minvielle, F., Thieuleux, F.
and Popovici, I. (2018) Simulation of African Dust Properties and Radiative Effects
during the 2015 SHADOW Campaign in Senegal. Atmospheric Research, 199,
14-28. https://doi.org/10.1016/j.atmosres.2017.07.027
[37] Fouquart, Y., Bonnel, B., Brogniez, G., Buriez, J.C., Smith, L., Morcrette, J.J. and
Cerf, A. (1987) Observations of Saharan Aerosols: Results of ECLATS Field Expe-
riment. Part II: Broadband Radiative Characteristics of the Aerosols and Vertical
Radiative Flux Divergence. Journal of Climate and Applied Meteorology, 26, 38-52.
https://doi.org/10.1175/1520-0450(1987)0262.0.CO;2
[38] Kaufman, Y.J., Karnieli, A. and Tanré, D. (2000) Detection of Dust over Deserts
Using Satellite Data in the Solar Wavelengths. IEEE Transactions on Geoscience
and Remote Sensing, 38, 525-531. https://doi.org/10.1109/36.823947
[39] Veselovskii, I., Goloub, P., Podvin, T., Bovchaliuk, V., Derimian, Y., Augustin, P.
and Diallo, A. (2016) Retrieval of Optical and Physical Properties of African Dust
from Multiwavelength Raman Lidar Measurements during the SHADOW Cam-
paign in Senegal. Atmospheric Chemistry and Physics, 16, 7013.
https://doi.org/10.5194/acp-16-7013-2016
[40] Jiang, Y. and Lu, L. (2016) Experimentally Investigating the Effect of Temperature
Differences in the Particle Deposition Process on Solar Photovoltaic (PV) Modules.
Sustainability, 8, 1091. https://doi.org/10.3390/su8111091
[41] Abdolzadeh, M. and Nikkhah, R. (2019) Experimental Study of Dust Deposition
Settled over Tilted PV Modules Fixed in Different Directions in the Southeast of
Iran. Environmental Science and Pollution Research, 26, 31478-31490.
https://doi.org/10.1007/s11356-019-06246-z
[42] Klugmann-Radziemska, E. (2015) Degradation of Electrical Performance of a Crys-
talline Photovoltaic Module Due to Dust Deposition in Northern Poland. Renewa-
ble Energy, 78, 418-426. https://doi.org/10.1016/j.renene.2015.01.018
[43] Majeed, R., Waqas, A., Sami, H., Ali, M. and Shahzad, N. (2020) Experimental In-
vestigation of Soiling Losses and a Novel Cost-Effective Cleaning System for PV
Modules. Solar Energy, 201, 298-306. https://doi.org/10.1016/j.solener.2020.03.014
[44] Nimmo, B.R. and Said, S.A. (1981) Effects of Dust on the Performance of Thermal
and Photovoltaic Flat Plate Collectors in Saudi Arabia: Preliminary Results. Alter-
native Energy Sources II, 1, 145-152.
https://ui.adsabs.harvard.edu/abs/1981aes.....1..145N/abstract
[45] Guan, Y., Zhang, H., Xiao, B., Zhou, Z. and Yan, X. (2017) In-Situ Investigation of
the Effect of Dust Deposition on the Performance of Polycrystalline Silicon Photo-
voltaic Modules. Renewable Energy, 101, 1273-1284.
https://doi.org/10.1016/j.renene.2016.10.009
[46] Ramli, M.A., Prasetyono, E., Wicaksana, R.W., Windarko, N.A., Sedraoui, K. and
Al-Turki, Y.A. (2016) On the Investigation of Photovoltaic Output Power Reduc-
tion Due to Dust Accumulation and Weather Conditions. Renewable Energy, 99,
836-844. https://doi.org/10.1016/j.renene.2016.07.063
DOI: 10.4236/epe.2021.135012 188 Energy and Power EngineeringD. Diop et al.
[47] Hegazy, A.A. (2001) Effect of Dust Accumulation on Solar Transmittance through
Glass Covers of Plate-Type Collectors. Renewable Energy, 22, 525-540.
https://doi.org/10.1016/S0960-1481(00)00093-8
[48] Ahmed, Z., Kazem, H.A. and Sopian, K. (2013) Effect of Dust on Photovoltaic Per-
formance: Review and Research Status. Latest Trends in Renewable Energy and En-
vironmental Informatics, 34, 193-199.
[49] Boccard, M. and Ballif, C. (2020) Influence of the Subcell Properties on the Fill Fac-
tor of Two-Terminal Perovskite-Silicon Tandem Solar Cells. ACS Energy Letters, 5,
1077-1082. https://doi.org/10.1021/acsenergylett.0c00156
[50] Martini, L., Serenelli, L., Menchini, F., Izzi, M. and Tucci, M. (2020) Silicon Hete-
rojunction Solar Cells toward Higher Fill Factor. Progress in Photovoltaics: Re-
search and Applications, 28, 307-320. https://doi.org/10.1002/pip.3241
DOI: 10.4236/epe.2021.135012 189 Energy and Power EngineeringYou can also read


