OVERCOMING THE ASYMMETRY OF THE ELECTRON AND HOLE DOPING FOR MAGNETIC TRANSITIONS IN BILAYER CRI3
←
→
Page content transcription
If your browser does not render page correctly, please read the page content below
Overcoming the asymmetry of the electron and hole
                                                     doping for magnetic transitions in bilayer CrI3
arXiv:2101.05864v2 [cond-mat.mtrl-sci] 18 Jan 2021

                                                                   Sukanya Ghosh*, Nataša Stojić and Nadia Binggeli
                                                                   Abdus Salam International Centre for Theoretical Physics, Strada Costiera, Trieste,
                                                                   Italy
                                                                   E-mail: *sghosh4@ictp.it

                                                                   Abstract. Electrical control of magnetism has great potential for low-power
                                                                   spintronics applications and the newly discovered two-dimensional van-der-Waals
                                                                   magnetic materials are promising systems for this type of applications. In fact,
                                                                   it has been recently shown experimentally (Jiang et al. 2018 Nat. Nanotechnol. 13,
                                                                   549–553) that upon electrostatic doping by electrons bilayer CrI3 undergoes an
                                                                   antiferromagnetic-ferromagnetic (AFM-FM) phase transition, even in the absence of
                                                                   magnetic field. Doping by holes, on the other hand, does not induce the same transition
                                                                   in the experiment, which points to an intrinsic asymmetry in the hole and electron
                                                                   doping that limits the control of the transition by doping. We here show, based on first-
                                                                   principles calculations, that the asymmetry originates in the relativistic nature of the
                                                                   valence-band-edge states of the pristine bilayer, which inhibits the magnetic transition
                                                                   upon hole doping. Based on this finding, we propose an approach to engineer this
                                                                   system so that it displays the AFM-FM transition for both hole and electron doping
                                                                   by using moderate uniaxial strain along the soft direction of the bilayer.

                                                     Keywords: Chromium tri-iodide, 2D vdW magnet, ab-initio calculations, spin-orbit
                                                     coupling, doping and strain, magnetic transition, rigid-band model

                                                     1. Introduction

                                                     Electrical control of magnetism is key for the development of future applications in
                                                     spintronics and magnetic data storage, because of its low-power dissipation and high
                                                     speed [1, 2]. The recently discovered two-dimensional (2D) magnetic materials [3, 4],
                                                     which are easily integrated and gated in van der Waals (vdW) heterostructures [5–
                                                     10], provide exceptional opportunities for manipulation and switching of magnetism in
                                                     nanoscale devices [5, 10, 11]. For magnetic state control, the CrI3 bilayer has been the
                                                     focus of particular attention [5, 10]. CrI3 is one of the first emerged and the most studied
                                                     of the 2D magnetic semiconductors [4, 5]. Interestingly, its magnetic properties depend
                                                     on the number of layers. In the bulk, CrI3 is a ferromagnetic (FM) semiconductor
                                                     with Curie temperature TC = 61 K [12]. The CrI3 monolayer has a FM ground
                                                     state with TC = 45 K [4], while the bilayer is experimentally observed to be a layered
                                                     antiferromagnet [4, 13–16] with Néel temperature similar to the monolayer TC [15, 16].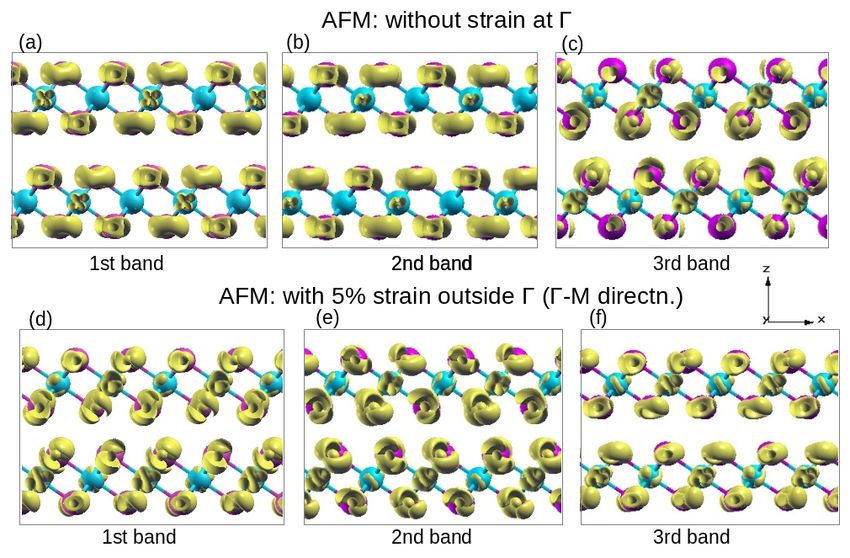
2

      The presence of relatively weak interlayer magnetic interactions in CrI3 and the
number-of-layer dependent magnetic properties make them ideally tailorable by different
approaches. In the bilayer, the small interlayer exchange coupling is evidenced by a low
magnetic critical field of 0.6-0.7 T for the antiferromagnetic (AFM) to FM transition [4].
In recent experiments, this spin-flip field could be tuned by several techniques, including
in-plane strain [17], hydrostatic pressure [18, 19], and electrostatic gating [15, 16], while
an irreversible AFM to FM transition was observed at high hydrostatic pressure (above
1.7 GPa) [18, 19]. Theoretically, the exchange coupling was also shown to be sensitive
to perturbations such as strain [20], change in layer stacking [21–23], electric field
[24, 25], electrostatic doping [22, 26, 27], and by coupling to other 2D materials [28]
– in most cases with auspicious trends for FM transitions [20–28]. Each of the external
perturbations acts through a different mechanism, offering much-needed versatility for
diverse applications. Electrostatic doping modifies orbital occupation, while the electric
field causes a layer-dependent energy shift of the bands, tending to favor ferromagnetism
[24]. Hydrostatic pressure was observed experimentally to induce an FM transition by
changing the stacking order [19], while in-plane tension, via inverse magnetostriction,
was found to lower the spin-flip field [17].
      Specific to electrical control, remarkable experimental manipulations of 2D
magnetic states by electrostatic gating have been achieved recently in bilayer CrI3
[15, 16, 29]. The use of dual-gate field-effect-device configurations enabled independent
gating control over the electric field and electrostatic doping. While the electric field was
observed to induce, at zero magnetic field, an interesting linear magnetic-polarization
effect in the magneto-optical Kerr signal [15, 16], electron doping monotonously
decreased the spin-flip field, and correspondingly enabled, at fixed magnetic field near
the critical field, a voltage-controlled switching between AFM and FM states [16, 29].
      Strikingly, in the latest voltage-controlled doping experiments on graphene-
encapsulated CrI3 bilayer [29], the spin-flip field was made to vanish above a critical
electron density, and electron doping was demonstrated to induce a transition from
interlayer antiferromagnetism to ferromagnetism, in the absence of a magnetic field.
Upon hole doping, on the contrary, no transition was observed at zero field. The
asymmetry of electron and hole doping for the magnetic transition is consistent with
the trend of a recent ab-initio calculation for the isolated CrI3 bilayer [22], confirming
it is an intrinsic feature of the bilayer. The asymmetry or lack of magnetic transition
with hole doping, however, is an intriguing feature, as it is contrary to the general
expectation that weak doping favors ferromagnetism [30], and also because some (but
not all [22]) theoretical studies indicated a symmetric behavior [26, 27]. The symmetry
in the latter studies might be related to neglect of relativistic effects, but the factors
controlling the asymmetry in the magnetic behavior have not been investigated so far.
Furthermore, the existence of theoretical results indicating a symmetric behavior raises
the interesting possibility that through band-structure engineering one may be able to
lift the asymmetry in the experimental bilayer and control magnetism also with hole
doping. This would mean increased flexibility and enhanced magnetic switching ability,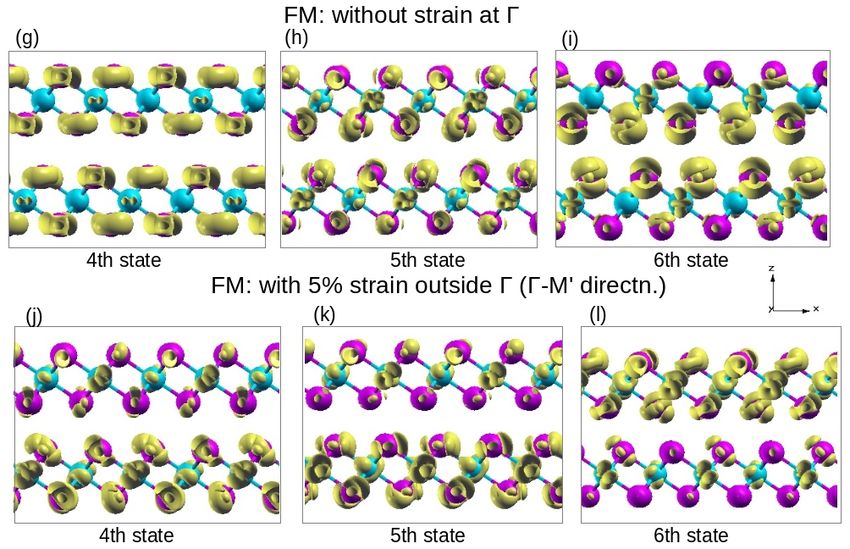
3

allowing electrical control of the AFM-FM phase transition by both positive and negative
bias in the experiment.
     In this paper, using ab-initio density-functional-theory (DFT) calculations, we find
the origin of the asymmetric behavior of the hole doping compared to electron doping.
Using this finding, we propose an approach to engineer the system mechanically, so
that it undergoes an AFM-FM phase transition both with hole and electron doping by
applying moderate compression perpendicular to the bilayer.

2. System and computational method

We consider the CrI3 bilayer with monoclinic layer stacking, as shown in figure 1. This
corresponds to the structural phase of the CrI3 bilayers displaying experimentally layered
antiferromagnetism at low temperature, and obtained by exfoliation from CrI3 bulk van
der Waals crystals at room temperature [4, 13–19, 29].
      Bulk CrI3 exhibits a low-temperature (LT) structure with rhombohedral layer
stacking and R3 space-group symmetry, and a high-temperature (HT) structure with
monoclinic layer stacking and C2/m symmetry, corresponding to temperatures below
and above ∼200 K, respectively [12]. CrI3 bilayer samples obtained by exfoliation
from the bulk at room temperature have been shown experimentally to remain in the
monoclinic phase also at low temperature [13, 14]. The monoclinic stacking gives rise to
a layered AFM ground state, while rhombohedral stacking yields an FM ground state
[21, 22]. Hence, although in Ref. [29] the experiment reporting the AFM-FM transition
upon electron doping was performed at low temperature, the bilayer CrI3 samples used
were fabricated at room temperatures and then encapsulated and cooled, remaining in
the AFM monoclinic phase due to the existence of an energy barrier for the transition
to the rhombohedral phase [15, 18, 29]
      In our study, all structural and electronic properties were calculated using DFT
in its plane-wave pseudopotential implementation in the Quantum ESPRESSO package
[31]. We performed calculations within the local-spin-density approximation (LSDA),
with and also without spin-orbit coupling (SOC), by using fully-relativistic projector
augmented wave (PAW) pseudopotentials and comparing the results to those obtained
with the scalar-relativistic version of the PAW pseudopotentials. The plane-wave kinetic
energy cutoffs for the electronic states and charge density were chosen to be 60 Ry and
650 Ry, respectively, both for the fully relativistic and scalar-relativistic cases. The
Brillouin zone (BZ) was sampled using the Γ-centered uniform Monkhorst-Pack k-point
grid of 24 × 24 × 1.
      Our optimized in-plane lattice constant is a = 6.69 Å and the equilibrium
distance between the two outermost I atomic planes of the bilayer is deq = 9.47 Å,
while the separation between the two inner I atomic planes in the bilayer is
deq
  int = 3.36 Å (see figure 1). The lattice parameters obtained using the scalar-relativistic
pseudopotentials remained virtually unchanged upon relaxation performed with the
relativistic pseudopotentials. The periodic images of the CrI3 bilayer were separated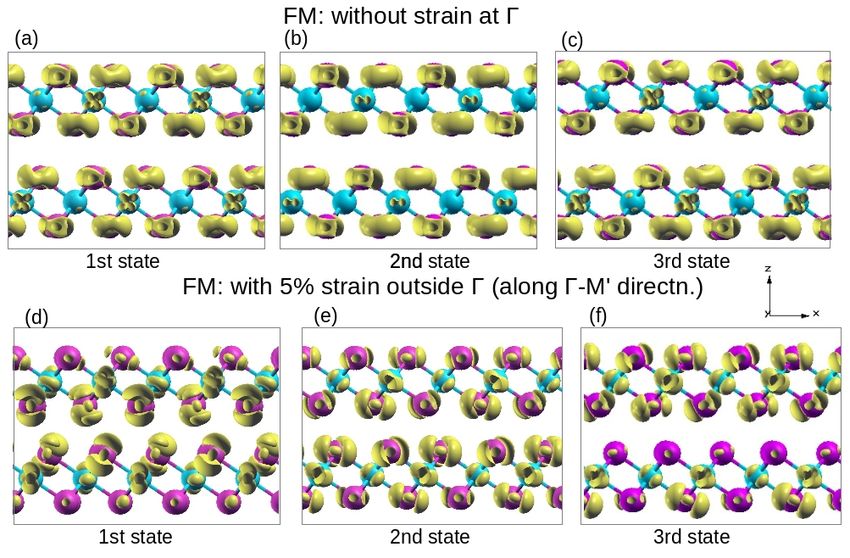
4

              Figure 1. Side (a) and top (b) view of the atomic structure of the CrI3 bilayer
              with monoclinic layer stacking. In a single CrI3 layer, the plane of Cr atoms forms
              a honeycomb lattice and is sandwiched between two I atomic planes. Cr ions are
              surrounded by six first neighbor I ions arranged in corner sharing I octahedra; a, b, c
              are the unit-cell vectors, and d (dint ) is the distance between the outermost (innermost)
              iodine atomic planes of the bilayer.

by a large vacuum distance of ∼30 Å along the out-of-plane direction. Unless otherwise
specified the relaxations were performed with the undoped systems. For the structural
relaxations, the atomic coordinates were relaxed until the forces on the atoms became
less than 0.1 mRy/Bohr. For the electrostatic doping, we added electrons or holes to the
bilayer system and used a compensating jellium background in the supercell to maintain
charge neutrality.
      For the strained bilayer, we applied strain along the out-of-plane direction by
changing the distance d between the two outermost iodine atomic planes of the bilayer.
For a given uniaxial strain, the vertical coordinate of the I atoms in these surface planes
were fixed to the distance imposed by the strain, while all other atomic coordinates
were free to relax, and the in-plane lattice parameter was also optimized. The change
of the in-plane lattice parameter was rather small, it expanded by 1% upon a vertical
compression zz = −5%.
      We checked the stability upon strain of the out-of-plane orientation of the Cr spin,
by calculating the magnetic anisotropy energy of the pristine and strained bilayer. We
found it to be 0.65 meV/Cr and 0.36 meV/Cr for zz = 0 and −5%, respectively.
Although reducing, the magnetic anisotropy energy did not change sign, showing the
same preferred perpendicular spin orientation also in the strained case. In addition,
we evaluated the effect of the 5%-vertical compression on the energy barrier between
the HT-monoclinic and LT-rhombohedral phases of the CrI3 bilayer and found that the
energy barrier is increased with respect to the unstrained case (see Appendix). This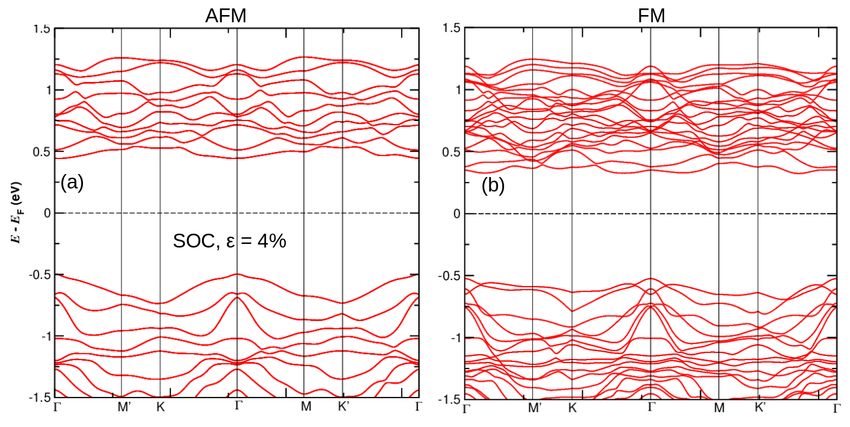
5

              Figure 2. Exchange energy, Eex , as a function of doping for the CrI3 bilayer from
              fully-relativistic and scalar-relativistic calculations. Electron doping is represented
              with positive and hole doping with negative sign.

thus tends to further inhibit a spontaneous structural transition from the HT to LT
phase.
     It should be noted that the overall bilayer deformations (the aspect ratio, in
particular) induced by the vertical strains applied along the soft direction, which we
consider in this work, differ significantly from those induced by in-plane biaxial strains.
In fact, we find that a tensile in-plane strain xx = yy =1% on the bilayer would induce
a d contraction of only 0.5%. This corresponds to a ratio zz /xx = −0.5, which is 10
times smaller in magnitude than with the applied uniaxial perpendicular strains (see
Appendix). We also note that compared to vertical electric fields [32, 33], the vertical
strains have a non-negligible influence on the internal atomic structure of each CrI3
monolayer (as described in the Appendix).

3. Results and Discussion

3.1. Origin of the asymmetry of electron and hole doping for the
magnetic transition
In figure 2 we show our calculated exchange energy, Eex = EAFM − EFM , as a function
of electrostatic doping, from scalar-relativistic and fully-relativistic calculations. In
both cases, at zero doping, Eex is negative (with similar values), consistent with the
experimentally observed AFM ground state of the bilayer. In the scalar-relativistic case,
Eex increases linearly with electron and hole doping, displaying a symmetric behavior
with a transition from AFM to FM occurring both for electron and for hole doping (at
about 0.052 electrons/cell and 0.054 holes/cell, respectively).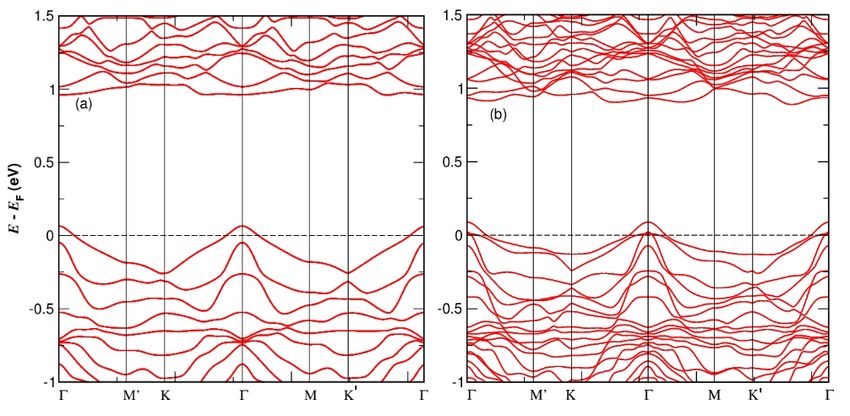
6

     With the inclusion of SOC, the hole doping does not induce the AFM-FM transition
anymore up to large doping. In fact, Eex remains virtually constant for hole doping
up to at least 0.2 hole/cell, while with electron doping the exchange energy keeps
increasing linearly, displaying about the same slope as in the scalar-relativistic case. The
asymmetry in the magnetic behavior induced by electron and hole doping corresponds
fully to the experimental findings [29] – yielding even the transition electron-doping
value (1.7×10¹³ e/cm2 or 0.064 electron/cell) relatively close to the experimental one
(around 2.0×10¹³ e/cm2 ), and the results in figure 2 thus show that the asymmetry with
lack of transition for hole doping has a relativistic origin.
     In order to better understand the factors controlling the asymmetry and presence
or absence of a magnetic transition with hole doping, we have examined the electronic
density of states (DOS) and band structure of the bilayer in the fully-relativistic and
scalar-relativistic cases. In figure 3, we show the DOS’s obtained for the pristine AFM
and FM bilayers in the fully-relativistic (a-b) and scalar-relativistic (c-d) calculations.
In each case, the electronic energies are measured relative to the vacuum potential,
allowing comparison between the band energies of the AFM and FM bilayer. In fact,
as the electrostatic potentials for the AFM and FM bilayers are found to be virtually
identical (see Supplementary Information), one may expect the change in Eex upon
weak electron/hole doping to be dominated by the difference in the AFM and FM
one-electron energy contribution from the occupied/emptied band-edge levels in their
respective conduction/valence DOS spectra.
     Inspection of figure 3 indicates that, in both AFM and FM bilayers, the presence
of SOC drastically influences the DOS near the valence band maximum (VBM) and
significantly alters the VBM energy, while the conduction band minimum (CBM) is
affected much less. The VBM in the scalar-relativistic case is characterized by a very
sharp DOS feature with large DOS values, which is replaced in the fully relativistic case
by a considerably smoother DOS with lower DOS values near the VBM.
     In figure 3, we also indicated the positions of the Fermi level, F , for 0.1, 0.2
electron/cell doping and for 0.1, 0.2 hole/cell doping, as obtained using the rigid-band
model of the pristine bilayers (in good agreement with results for band structures and
corresponding F positions from self-consistent doping calculations, see Supplementary
Information). In all cases, F lies rather close to the band edge (within 0.1 eV).
     In the scalar-relativistic case (figure 3(c) and (d)), the FM phase has both
conduction and valence DOS noticeably broader than the AFM phase; the FM phase has
a VBM and F for hole doping at higher energy, and a CBM and F for electron doping
at lower energy, than the AFM phase. In terms of one-electron-energy contribution,
this means that either type of doping will lower the energy of the FM relative to the
AFM phase: for hole doping, by removing valence electrons with higher energy from
the FM than from the AFM bilayer, and for electron doping, by adding lower-energy
conduction electrons to the FM than to the AFM bilayer. This is in agreement with the
trends obtained for Eex in the scalar-relativistic case, in figure 2, and consistent with
the general expectation that weak doping favors ferromagnetism [30].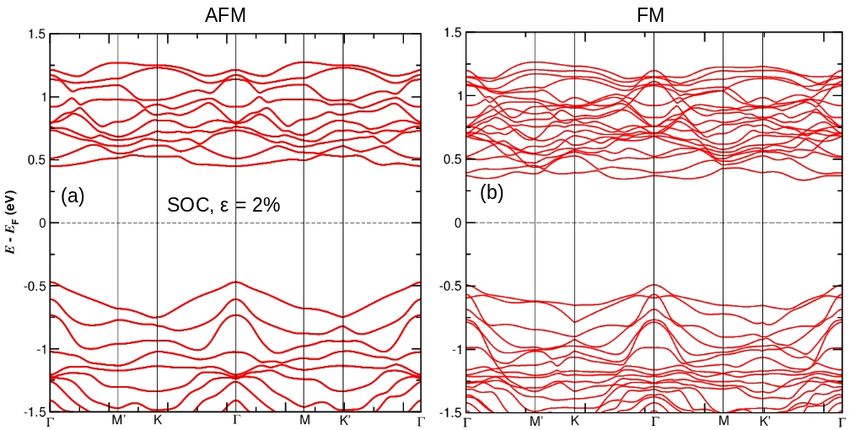
7

               Figure 3. Electronic density of states of the CrI3 bilayer in AFM (a,c) and FM (b,d)
               configuration, as obtained in the fully-relativistic (a-b) and (c-d) scalar-relativistic
               calculations. The dashed lines indicate the position of the Fermi level obtained in the
               rigid-band model for 0.1, 0.2 hole/cell doping (in yellow, green, respectively) and 0.1,
               0.2 electron/cell doping (blue, cyan, respectively). The energy scale is relative to the
               vacuum potential.

     In the fully-relativistic case, as far as the conduction band is concerned, the effect of
changing from AFM to FM (figure 3(a) and (b)) is very similar to the scalar-relativistic
case – producing a shift to lower energy of the CBM (and associated electron-doping F
levels) nearly identical to that of the scalar relativistic situation. For the valence band,
on the other hand, the behavior differs completely from the scalar-relativistic case, i.e.,
the VBM and F for hole doping remain virtually unvaried upon changing from AFM
to FM. In terms of band-energy contributions, this implies no variation with doping of
the FM relative to the AFM energy – which is fully consistent with the flat trend of
Eex in figure 2, but unlike the behavior generally expected for weak doping. In all cases
thus the trends of Eex with doping can be accounted for by the difference between the
FM and AFM band-edge energy F in figure 3.
     The reason for the qualitatively different trend of the valence-band-edge energy
F in the relativistic case can be inferred from figure 4, where we display the fully-
relativistic atomic-projected band structures of the AFM and FM bilayers. In these
band-structure plots, we indicate along each band the proportion of projected I and
Cr atomic-orbital character – we also reported, for easy reference, the corresponding F
energies of figure 3. The scalar-relativistic AFM and FM band structures are given in the
Appendix, for comparison. Unlike the latter band structures (exhibiting k-degenerate
valence-band maxima outside Γ and a quite-flat valence-band-edge region all around
Γ), the fully-relativistic-band structure, in figure 4, shows a prominent single-k-point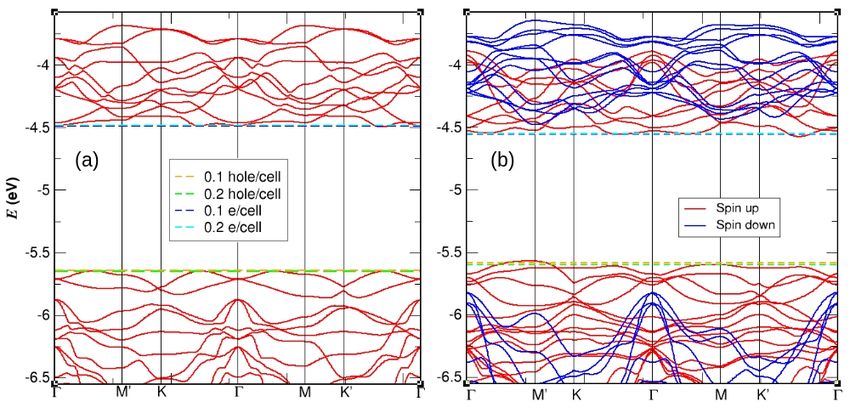
8

VBM at the BZ center, with sharp band-edge curvature, both in the AFM and FM
configurations.
      In addition, the atomic projections for the relativistic case, in figure 4, evidence
a quasi-total I-5p atomic character of the upper four valence states at the BZ center
(related to two 2-fold-degenerate bands in the AFM phase), consistent with relativistic
results for the monolayer [34]. These states correspond to atomic I-5p spin-orbital
|J = 3/2, Jz = ±3/2i states, that have been pushed up into the bandgap (compared
to the scalar-relativistic case, see Appendix) due to the very large I-5p atomic spin-
orbit splitting (∼ 0.9 eV [35, 36]). The upper (lower) two of these valence bands in the
central part of the BZ correspond to I-5p states with moment Jz = +3/2 (−3/2) parallel
(antiparallel) to the magnetic moment of their CrI3 layer.
      Hence, SOC completely modifies the shape of the valence-band edge and the
location of the VBM positions in the BZ – from a halo-type region around Γ in the
scalar-relativistic case to the Γ point itself (figure 4). Most importantly, the nature of
the upper valence states and of the band broadening resulting in the VBM is different in
the two cases. In the scalar-relativistic case (Appendix), the group of upper-four valence
bands (two 2-fold-degenerate bands in the AFM phase) corresponds predominantly to
Cr-3d t2g out-of-plane states with considerable I-5pz hybridization [37]. In that case,
the substantial AFM to FM splitting/broadening of the corresponding group of bands
outside Γ, due to interlayer interaction, effectively raises the FM valence-edge energy
F , relative to the AFM one (see Appendix). In the relativistic case, instead, the VBM
at Γ (of each CrI3 monolayer) is a consequence of the strong I-5p spin-orbit splitting.
The corresponding relativistic I-5p |J = 3/2, Jz = 3/2i VBM states are characterized
by fully in-plane px + ipy orbitals, which are unsuited to promote interaction between
the two layers of the bilayer. This results in virtually identical AFM and FM valence-
edge energies F in figure 4. One can note, however, that in the rest of the BZ, where
out-of-plane hybridization is promoted (with the Cr in particular), the FM broadening
of the valence spectrum considerably increases.
      Based on the above results and rational, it can be expected that changing the
position of the VBM away from Γ, where it is controlled by atomic-like relativistic
states not sensitive to interlayer interactions, will enhance the valence-band broadening
of the FM phase and therefore its stability (relative to the AFM phase) upon hole
doping. In fact, we will show that this can be achieved effectively by applying moderate
load/compression along the soft (out-of-plane) direction of the bilayer. Previously, it
had been observed, in scalar-relativistic DFT+U calculations of the effect of in-plane
biaxial strain on the bilayer band structure, that under 10% stretching of the bilayer-
surface area (inducing a d contraction), a displacement of the VBM from Γ to outside
the BZ center was occurring [20].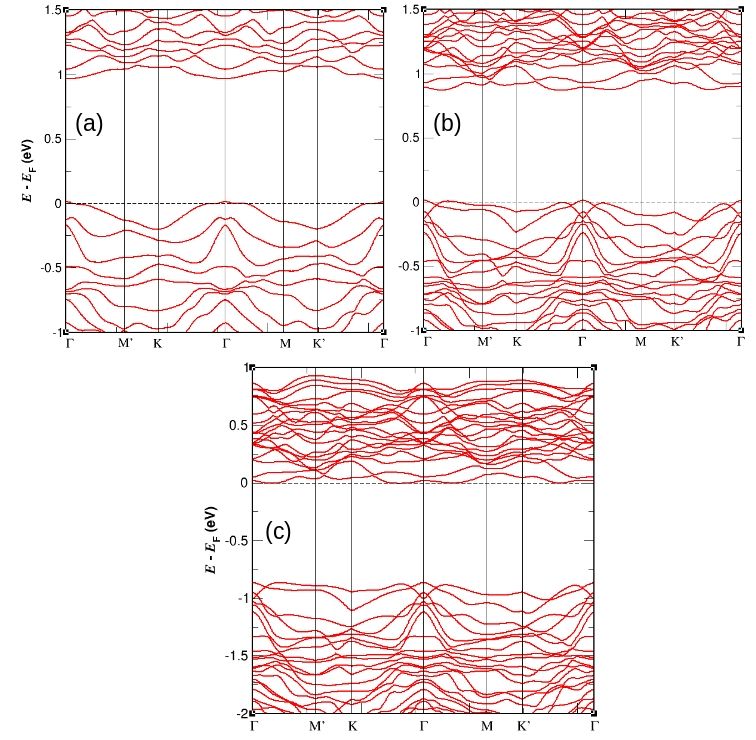
9

              Figure 4. Fully relativistic band structures of the pristine AFM (a) and FM (b) CrI3
              bilayer. The colors indicate the proportion of I and Cr character in the projected
              band structures. The horizontal dashed lines show the Fermi level in the rigid-band
              model. The orange, green, blue and cyan dashed lines are for 0.1 h/cell, 0.2 h/cell,
              0.1 e/cell and 0.2 e/cell doping, respectively. The energy scale is relative to the vacuum
              potential.

3.2. Overcoming the asymmetry of the electron and hole doping by
vertical strain
In figure 5 we show the fully-relativistic atomic-projected band structures of the
5%-compressed CrI3 bilayer for the AFM and FM configurations. We note the
AFM configuration remains lower in energy than the FM one under the 5%-vertical
compression. The compressive strain, in figure 5, is seen to lower the VBM energy at
the BZ center and to induce new local valence-band maxima outside Γ, at some distance
from the BZ center (see vertical dashed line in figure 5).
     The new (local) valence-band maxima induced by the strain are clearly much more
pronounced in the FM configuration, particularly in the Γ − M 0 direction, where the
new VBM is slightly higher in energy than at Γ. The corresponding upper valence band,
outside the Γ region, in the FM configuration is significantly lifted up in energy relative
to the AFM one. In addition, the upper edge of this band, outside the BZ center,
in the FM case is quite-flat over an extended halo-like region all around Γ; hence the
DOS associated with the corresponding new valence band maxima clearly dominates
compared to the one at Γ (see also the corresponding DOS plots in the Supplementary
Information). In fact, one observes, in figure 5, that contrary to the unstrained case,
the Fermi levels for 0.1 and 0.2 hole/cell doping, in the rigid-band model, are shifted
to higher energy in the FM compared to the AFM configuration. For the conduction
band, on the other hand, the AFM-to-FM shifts in F remain similar to the unstrained
case. Therefore, for the strained bilayer, on the basis of the results in figure 5, one can
expect the presence of an AFM-FM transition both with hole doping and with electron
doping.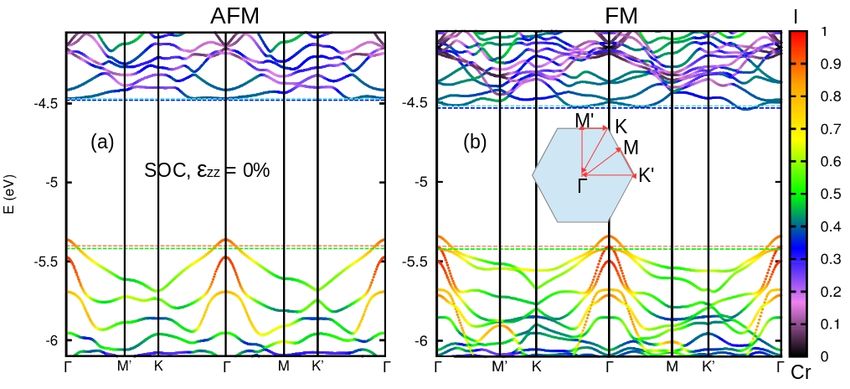
10

              Figure 5. Fully relativistic bandstructures of the CrI3 bilayer compressed in the
              perpendicular direction by 5% for the AFM (a) and FM (b) configurations. The
              dashed vertical lines correspond to the new local VBM with highest energy appearing
              outside Γ due to the application of the strain. The meaning of colors, horizontal lines
              and energy scale is described in the caption of figure 4.

     Indeed, this is confirmed, in figure 6, where we display the exchange energy Eex
of the strained bilayer, as a function of doping, for different values of the strain zz .
In the bilayer, at sufficient vertical compression, an AFM to FM transition is induced
both upon hole doping and upon electron doping. This occurs for zz = −5% and −4%.
For the 5% compression, the hole doping induces a transition at ∼0.08 hole/cell, while
the transition upon electron doping occurs at 0.03 electron/cell, i.e., a smaller doping
value than in the unstrained bilayer. For 4% compression, a higher level of hole doping
(0.18 hole/cell) is necessary to induce the transition. For zz = −2%, hole doping does
not induce the transition. At that strain, the valence-edge behavior is still controlled
by the VBM at the BZ center, resulting in a constant Eex with hole doping, as for the
unstrained bilayer. One can notice, however, in figure 6, that even in the absence of
doping, compression smoothly increases Eex , and hence already in the 2%-compressed
bilayer the exchange coupling is somewhat less AFM than in the unstrained system.
     The AFM-FM transition with hole doping is enabled by the presence of the VBM
feature away from Γ. It is in fact only under sufficient vertical strain, i.e., when the
local VBM appears along Γ − M 0 in the FM band structure (with the associated high
DOS and rising energy relative to Γ), that the corresponding new local band edge starts
enhancing the stability upon hole doping of the FM phase, compared to the AFM one.
The corresponding band structures for 2% and 4% uniaxial strain are shown in the
Supplementary Information. The slope, in general, of Eex with hole (electron) doping,
in figures 2 and 6, is controlled by the energy difference between the band-edge F
positions in the AFM and FM configurations, ∆F = AF       F
                                                               M
                                                                 − FF M . With stronger
vertical compression, ∆F and hence the slope of Eex vs. electron (hole) doping tend to
increase in magnitude due to the increasing broadening outside Γ of the FM conduction-
11
Figure 6. Exchange energy, Eex , as a function of doping for different compressive
uniaxial strains (2, 4 and 5%) applied to the bilayer, compared to the unstrained
bilayer. The stars denote the Eex obtained by relaxing the bilayer in the presence of
the dopant charge, and this for the AFM and FM configurations separately, in the case
of 5% strain. All calculations were fully-relativistic. The same convention for hole and
electron doping as in figure 2 is used.
(valence-) band edge relative to the AFM one. We note, in fact, that the band-energy
offset ∆F per electron/hole, obtained from the AFM and FM rigid-band model with
proper common electrostatic-potential reference level, accounts not only qualitatively,
but surprisingly even semi-quantitatively (within ∼ 20 % of the actual value) for the
variation with doping of the exchange-coupling energy Eex in all cases we considered
here.
Finally, we would like to comment on the origin of the new VBM feature in the
strained bilayer. The new VBM feature derives from the rise in energy, upon vertical
compression, of the two lower valence bands with main Iodine character in the central
part of the BZ in figure 4 (at about –5.7 eV for both AFM and FM, see also DOS’s in
supplementary information). These two Iodine bands (which are degenerate in the AFM
case) correspond to I-5p J= 3/2 states with moment Jz = ±1/2. Such states are moving
up in energy, upon z compression, relative to the other Iodine bands with |Jz | = 3/2 in
figure 4, because of their major out-of-plane I-pz components (absent in the |Jz | = 3/2
states) – becoming increasingly unfavorable energetically when the two inner planes of
I anions in the bilayer are brought closer to each other. When the Iodine |Jz | = 1/2
bands of the central part of the BZ are shifted up in energy upon compression, states
with different Jz cannot interact essentially at the Γ point and the |Jz | = 1/2 states can
cross upper Iodine bands. However, when going away from Γ, they interact increasingly
strongly, and the resulting level repulsion gives rise to the new VBM in figure 5.
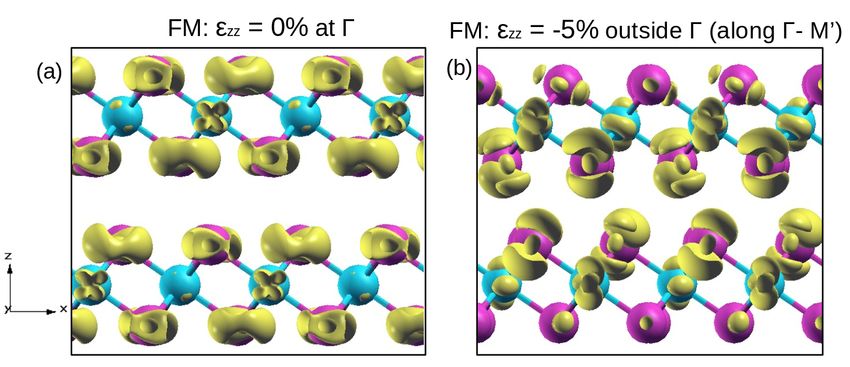
In figure 7 we show the probability density of the states forming the VBM in the FM12
Figure 7. Isosurface plots of the probability density of the VBM states for the pristine
(a) and 5%-compressed (b) FM bilayers. The VBM state is at Γ for the pristine bilayer
and outside Γ, in the ΓM 0 direction, for the strained bilayer. Iso-surface value is 0.001
e/Bohr3 .
configuration for the pristine bilayer (VBM at Γ) (a) and 5%-strained bilayer (one of the
two valence band maxima in the ΓM 0 direction) (b). In the pristine bilayer, as mentioned
previously, the VBM corresponds to |J = 3/2, Jz = 3/2i states of the Iodine atoms with
in-plane pk orbitals. The shape of the probability density in figure 7(a) confirms that
the orbitals are localized within the plane of the I atoms. Such relativistic valence-edge
states are responsible for the unusual trend with hole doping, inhibiting the magnetic
transition. On the contrary, in the strained bilayer (figure 7(b)), the VBM outside Γ,
in the ΓM 0 direction, corresponds predominantly to Iodine |J = 3/2, Jz = 1/2i states
with significant pz -orbital components; these orbitals extend in the space between the
layers, favouring interaction between the layers, and restoring the expected behavior for
Eex that weak doping promotes ferromagnetism.
4. Conclusions
In this paper, using ab-initio density-functional-theory calculations, we found the origin
of the asymmetric behavior of the hole doping compared to electronic doping to lie
in the strongly spin-orbit-split states forming the VBM at Γ. The specific relativistic
nature of these atomic-like states at Γ prevents the expected larger interactions and
broadening for the FM bilayer configuration, which results in the suppression of the
AFM-FM transition for hole doping.
Furthermore, we showed that band engineering by application of moderate uniaxial
strain perpendicular to the bilayer is able to lift the doping asymmetry and realize
an AFM-FM transition also for hole doping. This is made possible thanks to the
compressive-strain-induced creation of an additional VBM feature near Γ which displays
the expected broadening for the FM configuration and lowers its energy upon hole doping
relative to the AFM configuration. We also explained the origin of this feature and the
trend of the exchange coupling with combined doping and vertical strain.
Our results indicate that the combination of perpendicular strain and doping
opens the possibility of controlling the magnetism by hole doping and also13
Figure 8. Scalar-relativistic band structure of CrI3 bilayer in (a) AFM and (b) FM
configuration. The band energies are measured relative to the vacuum potential. The
horizontal dashed lines show the Fermi level in the rigid-band model; the orange, green,
blue and cyan dashed lines are for 0.1 h/cell, 0.2 h/cell, 0.1 e/cell and 0.2 e/cell doping,
respectively.
conveniently lowering the spin-flip field for potential switching applications in CrI3 -
based heterostructures and related systems. More generally this study clarifies the
factors which may be used to induce or inhibit the presence of a magnetic transition
upon doping in the 2D layered-AFM insulators.
5. Appendices
5.1. Scalar-relativistic band-structure plots of CrI3 bilayer
The scalar-relativistic band-structure plots for the CrI3 bilayer in AFM and FM
configurations are shown in figure 8. The band energies are given relative to the vacuum
potential. In both AFM and FM configurations, the valence band maxima appear
outside Γ, which is a major difference with respect to the fully-relativistic case. For
the AFM configuration, the VBM appears along the ΓK(K 0 ) direction (see figure 8(a)),
while for the FM configuration the VBM appears along the ΓM 0 (M ) direction (see
figure 8(b)). The conduction band minima (CBM) appears along the ΓK(K 0 ) direction
for both AFM and FM configurations.
From figure 8 we see that the valence band is significantly wider for the FM
configuration than for the AFM one, due to the additional and rather large level
splittings (outside Γ) induced by the interlayer interaction in the FM configuration.
Therefore, as discussed in the main text, this favors the FM arrangement upon hole
doping.14
5.2. Energy barrier for the monoclinic to rhombohedral transition in
bilayer CrI3
In order to confirm that the application of perpendicular compression does not alter
the (meta-)stable character of the bilayer monoclinic phase, we evaluated the transition
barrier between the HT-AFM phase and the LT-FM phases, with and without strain.
For the unstrained bilayer, previous DFT calculations [22] have shown an energy
barrier of about 10 meV/Cr for the structural transformation from the monoclinic high-
temperature (HT) to rhombohedral low-temperature (LT) phase.
To reach the LT phase from the HT phase, we have gradually translated one of the
layers relative to the other layer along the vector T~ , joining the HT and LT site (see
inset in figure 9). The energy of the corresponding bilayer in the AFM arrangement,
measured relative to the energy of the LT-FM bilayer, is given in figure 9 as a function
of the sliding, both for the pristine and strained bilayer. For the sliding, we fixed the
positions of Cr atoms and relaxed the positions of all I atoms. For the pristine bilayer,
the energy difference between the HT-AFM and LT-FM phase is 3.9 meV/Cr and the
energy barrier from the HT-AFM to the LT-FM structure amounts to 11.8 meV/Cr, in
good agreement with previous DFT-GGA results [22]. In the presence of 5%-compressive
strain along the out-of-plane direction the energy difference increases to 8.2 meV/Cr and
the energy barrier to 25.2 meV/Cr. The transition barrier remains virtually unchanged
if one gradually translates the HT-FM layers, instead of the HT-AFM layers.
Hence, compared to the unstrained system, the large increase in the energy
barrier we find here with the vertical compressive strain will tend to further inhibit
a spontaneous structural transition from the HT to LT phase. The experimental bilayer
is expected thus also to remain in the HT phase with monoclinic stacking under the
type of compressive strains we consider in this work.
5.3. Uniaxial versus biaxial strain on CrI3 bilayer
We have performed ab initio calculations to compare the overall bilayer deformations
(aspect ratio) induced by uniaxial vertical and biaxial in-plane strains. For the uniaxial
strain, we compressed the bilayer by 5% in the perpendicular direction, and obtained
a 1% expansion of the in-plane lattice constant: (zz /xx )⊥ = −5, where ij stands for
the ij component of the strain tensor. For the biaxial in-plane strain, we expanded the
in-plane lattice parameter by 1%, and obtained a 0.5% contraction in the perpendicular
direction: (zz /xx )k = −0.5. Thus, for the same expansion of the in-plane lattice
parameter, the bilayer thickness varies by a factor of 10, depending on the type of strain
imposed. We checked, using different strain values, that these results correspond to the
linear elastic regime.
The above large difference (factor of 10) in the deformation ratio is related to the
van der Waals nature of the CrI3 system and resulting elastic modulii. In the case of
uniaxial strain applied in the perpendicular direction of a crystal with hexagonal Bravais15
lattice, within linear elasticity, the strain ratio can be written as:
zz c11 + c12
=− , (1)
xx ⊥ c13
where cij are components of the crystal elastic tensor. For biaxial in-plane strain, the
strain ratio becomes:
zz 2c13
=− . (2)
xx k c33
Typically, in van der Waals systems, like graphite, the ratio c11 /c13 tends to be one or
more orders of magnitude larger than the ratio c13 /c33 [38]. This leads to a considerably
larger strain ratio in Eq.(1) than in Eq.
(2),
which, e.g., in graphite, can be as much
zz zz
as 100 times larger [38]: xx ≈ 100 xx .
⊥ k
Under the 5% uniaxial perpendicular compression of the CrI3 bilayer, the separation
between the two inner I atomic planes of the bilayer is reduced from deq int = 3.36 Å to
dint = 3.07 Å. In the absence of strain, within each CrI3 layer, the separations between
the bilayer outer I plane and Cr plane (d1 ) and between the inner I plane and Cr plane
(d2 ) are nearly identical (differ by less than 0.1 %; d1 = d2 = 1.53 Å). Under the 5%
Figure 9. Energy barrier for the transition from the high-temperature (HT) AFM to
the low-temperature (LT) FM phase of the unstrained and 5%-compressed bilayer. One
~ vector (see inset) relative
of the monolayers of the AFM bilayer is translated along the T
to the other layer. The translation is expressed as proportion of the distance between
the HT and LT sites and is given along the horizontal axis. Along the vertical axis
we plot the energy of the AFM bilayer, for different stacking configurations (obtained
by sliding the monolayer from HT to LT site), relative to the energy of the LT FM
bilayer.16
compression along z, d1 decreases by 3.2% and d2 by 2.4%. These changes and their
difference are much stronger than the ones resulting from the application of large electric
fields perpendicular to the monolayer [32].
6. References
[1] Song C, Cui B, Li F, Zhou X and Pan F 2017 Prog. Mater. Sci. 87 33–82
[2] Matsukura F, Tokura Y and Ohno H 2015 Nat. Nanotechnol. 10(3) 209–220
[3] Gong C, Li L, Li Z, Ji H, Stern A, Xia Y, Cao T, Bao W, Wang C, Wang Y, Qiu Z Q, Cava R J,
Louie S G, Xia J and Zhang X 2017 Nature 546 265
[4] Huang B, Clark G, Navarro-Moratalla E, Klein D R, Cheng R, Seyler K L, Zhong D, Schmidgall
E, McGuire M A, Cobden D H, Yao W, Xiao D, Jarillo-Herrero P and Xu X 2017 Nature 546
270–273
[5] Gibertini M, Koperski M, Morpurgo A F and Novoselov K S 2019 Nat. Nanotechnol. 14 408
[6] Paudel T R and Tsymbal E Y 2019 ACS Appl. Mater. Interfaces 11 15781–15787
[7] Heath J J, Costa M, Buongiorno-Nardelli M and Kuroda M A 2020 Phys. Rev. B 101(19) 195439
[8] Hu T, Zhao G, Gao H, Wu Y, Hong J, Stroppa A and Ren W 2020 Phys. Rev. B 101 125401
[9] Dolui K, Petrović M D, Zollner K, Plecháč P, Fabian J and Nikolić B K 2020 Nano Lett. 20 2288
[10] Gong C and Zhang X 2019 Science 363 4450
[11] Zheng F, Zhao J, Liu Z, Li M, Zhou M, Zhang S and Zhang P 2018 Nanoscale 10(29) 14298–14303
[12] McGuire M A, Dixit H, Cooper V R and Sales B C 2015 Chem. Mater. 27 612–620
[13] Ubrig N, Wang Z, Teyssier J, Taniguchi T, Watanabe K, Giannini E, Morpurgo A F and Gibertini
M 2019 2D Mater. 7 015007
[14] Thiel L, Wang Z, Tschudin M A, Rohner D, Gutiérrez-Lezama I, Ubrig N, Gibertini M, Giannini
E, Morpurgo A F and Maletinsky P 2019 Science 364 973–976
[15] Jiang S, Shan J, and Mak K F 2018 Nat. Mater. 17(5) 406–410
[16] Huang B, Clark G, Klein D R, MacNeill D, Navarro-Moratalla E, Seyler K L, Wilson N, McGuire
M A, Cobden D H, Xiao D, Yao W, Jarillo-Herrero P and Xu X 2018 Nat. Nanotechnol. 13(7)
544–548
[17] Jiang S, Xie H, Shan J and Mak K F 2020 Nat. Mater. 19 1295
[18] Song T, Fei Z, Yankowitz M, Lin Z, Jiang Q, Hwangbo K, Zhang Q, Sun B, Taniguchi T, Watanabe
K, McGuire M A, Graf D, Cao T, Chu J H, Cobden D H, Dean C R, Xiao D and Xu X 2019
Nat. Mater. 18(12) 1298–1302
[19] Li T, Jiang S, Sivadas N, Wang Z, Xu Y, Weber D, Goldberger J E, Watanabe K, Taniguchi T,
Fennie C J, Fai Mak K and Shan J 2019 Nat. Mater. 18(12) 1303–1308
[20] León A M, González J W, Mejı́a-López J, de Lima F C and Morell E S 2020 2D Mater. 7 035008
and its Supplementary information
[21] Sivadas N, Okamoto S, Xu X, Fennie C J and Xiao D 2018 Nano Lett. 18(12) 7658–7664
[22] Jiang P, Wang C, Chen D, Zhong Z, Yuan Z, Lu Z Y and Ji W 2019 Phys. Rev. B 99(14) 144401–9
[23] Soriano D, Cardoso C and Fernández-Rossier J 2019 Solid State Commun. 299 113662
[24] Morell E S, León A, Miwa R H and Vargas P 2019 2D Mater. 6 025020
[25] Xu R and Zou X 2020 J. Phys. Chem. Lett. 11(8) 3152–3158
[26] Soriano D and Katsnelson M I 2020 Phys. Rev. B 101(4) 041402–5
[27] Lei C, Chittari B L, Nomura K, Banarjee N, Jung J and MacDonald H A 2019 Preprint at
https://arxiv.org/abs/1902.06418
[28] Liu N, Zhou S and Zhao J 2020 Phys. Rev. Mater. 4 094003
[29] Jiang S, Li L, Wang Z, Mak K F and Shan J 2018 Nat. Nanotechnol. 13(7) 549–553
[30] Akai H 1998 Phys. Rev. Lett. 81 3002
[31] Giannozzi P, Baroni S, Bonini N, Calandra M, Car R, Cavazzoni C, Ceresoli D, Chiarotti G L,
Cococcioni M, Dabo I, Corso A D, de Gironcoli S, Fabris S, Fratesi G, Gebauer R, Gerstmann U,17
Gougoussis C, Kokalj A, Lazzeri M, Martin-Samos L, Marzari N, Mauri F, Mazzarello R, Paolini
S, Pasquarello A, Paulatto L, Sbraccia C, Scandolo S, Sclauzero G, Seitsonen A P, Smogunov
A, Umari P and Wentzcovitch R M 2009 J. Condens. Matter Phys.” 21 395502
[32] Ghosh S, Stojić N and Binggeli N 2019 Physica B: Cond. Matt. 570 166
[33] Ghosh S, Stojić N and Binggeli N 2020 Appl. Phys. Lett. 116 086101
[34] Lado J L and Fernández-Rossier J 2017 2D Mater. 4 035002
[35] Minnhagen L 1962 Ark. Fys. 21 415
[36] Pettersson M and Nieminen J 1998 Chem. Phys. Lett. 283 1 – 6
[37] Wang H, Fan F, Zhu S and Wu H 2016 Europhys. Lett. 114 47001
[38] Blakslee O L, Proctor D G, Seldin E J, Spence G B and Weng T 1970 J. Appl. Phys. 41 3373–338218
Supporting Information:
Overcoming the asymmetry of the electron and hole doping for
magnetic transitions in bilayer CrI3
S1. Planar average plots for electrostatic potential of CrI3 bilayer without
and with 5% uniaxial compressive strain
The planar averages of Vlocal + VHartree along the out-of-plane (z) direction for the
unstrained and strained (zz = −5%) CrI3 bilayers in AFM and FM configurations
are shown by the black and red curves, respectively, in figure S1. The energy position of
the vacuum level is virtually identical for AFM and FM configurations. The difference
in vacuum level between AFM and FM configurations is < 0.05 meV. The maximum
difference of the electrostatic potential (in the vicinity of the atomic layers) between the
AFM and FM configurations is ≈ 1 meV. These are consequences of the total charge
density (electronic + ionic) of the AFM and FM bilayers being nearly identical.
Figure S1. Planar average of the electrostatic (Vlocal + VHartree ) potential in the
supercell for the (a) unstrained (zz = 0%) and (b) strained (zz = −5%) CrI3 bilayers
in AFM (black curve) and FM (red dashed curve) configurations. The magenta and
turquoise spheres show the positions of the iodine and chromium atoms, respectively,
along the z direction in the supercell.
S2. Band structures of the doped CrI3 bilayer at zz = 0% supporting
rigid-band model
Relativistic band structure of bilayer CrI3 in AFM and FM configurations obtained
from self-consistent charge-density calculations with 0.1 hole/cell doping is shown in
figure S2. The band structure of the doped system and position of the Fermi level in19
Figure S2. Fully-relativistic band structure plots of the doped CrI3 bilayer in (a) AFM
and (b) FM configurations without any strain (zz = 0%) at 0.1 hole/cell doping. The
horizontal dashed line corresponds to the Fermi energy.
the bands are similar to the results obtained with the rigid-band model of the pristine
bilayer, both for the AFM and FM configurations.
S3. Band structure of CrI3 bilayer with 2% and 4% uniaxial compressive
strain
Fully-relativistic band structure plots of CrI3 bilayer in AFM configuration with 2% and
4% compressive strain (applied along out-of-plane direction) are shown in Figs. S3 and
S4. The reduction of the dispersion of the highest valence band in the central part of
the BZ and beginning of creation of a new VBM feature around Γ can be observed for
increase of the strain from 2 to 4%, in agreement with the trends observed in figures 4
and 5 in the main manuscript.
S4. Electronic density of states for CrI3 bilayer with 0% and 5% uniaxial
compressive strain
Fig. S5 shows the fully-relativistic electronic density of states (DOS) for the unstrained
and strained (5% compressive strain) CrI3 bilayer in AFM and FM configurations. In
comparison to DOS of the pristine bilayer in Fig. S5 (a) and (b), a large increase of DOS
at the VBM can be seen upon the compression, see Figs. S5(c) and (d), especially in the
FM case. Furthermore, it can be observed that the broadening of the FM valence and
conduction bands is larger than for the AFM configuration, supported by the positions
of Fermi level for 0.1 e(h) doping. Similar conclusion was reached for the band structures
shown in figure 5. The uniaxial compressive strain causes the Jz = |0.5| states to shift20
Figure S3. Fully-relativistic band structure of CrI3 bilayer under (a), (b) 2% uniaxial
compressive strain in AFM and FM configurations.
Figure S4. Fully-relativistic band structure of CrI3 bilayer under (a), (b) 4% uniaxial
compressive strain in AFM and FM configurations.
towards higher energy in the valence band, i.e., moves close to the Fermi energy, as
indicated by the arrows in Fig. S5.
S5. Validation of rigid-band model for doped CrI3 bilayer at zz = −5%
Fully-relativistic band structure of bilayer CrI3 in AFM and FM configurations under
5% compressive strain from self-consistent charge-density calculations with 0.1 hole/cell21
Figure S5. Electronic density of states of bilayer CrI3 (including SOC) under (a)–
(b) 0% and (c)–(d) 5% compressive uniaxial strain for (a), (c) AFM and (b), (d)
FM configurations. The energy is given with respect to the vacuum potential. The
dashed orange, green, blue and cyan lines are the Fermi energies corresponding to 0.1
hole/cell, 0.2 hole/cell, 0.1 e/cell and 0.2 e/cell doping, respectively, obtained from
rigid-band model. The vertical black arrow in each plot shows the energy level with
J = 1.5, |Jz | = 0.5 (pointing by the black arrow). The uniaxial compressive strain
causes the |Jz | = 0.5 states in the valence band to rise up in energy.
doping is shown in figures S6 (a) and (b). The corresponding band structure in FM
configuration for 0.1 electron/cell doping at zz = −5% is shown in figure S6(c). The
band structures of the doped systems and positioning of the Fermi level in the bands
are similar to the results obtained with the undoped bilayer and rigid-band model, both
for the AFM and FM configurations.
S6. 3D isosurface and planar average plots for the probability density of
the upper valence states in the pristine and strained bilayer
Figure S7 shows the 3D isosurface plots for the probability density, |Ψ|2 , of the upper
three valence bands in AFM pristine configuration (a)–(c) and with 5% compression
(d)–(f). In the case of the unstrained bilayer |Ψ|2 for the upper three valence bands22
Figure S6. Fully-relativistic band structure of doped CrI3 bilayer under 5%
compressive strain: (a) AFM and (b) FM configurations with 0.1 hole/cell doping,
and (c) FM configuration at 0.1 electron/cell doping. The horizontal dashed line in
each plot corresponds to the Fermi energy.
are plotted at Γ, corresponding to the VBM position. Since the local VBM for the 5%
compression is along Γ − M direction, outside Γ, we plotted |Ψ|2 for the upper valence
bands at the position of the new local VBM. The highest 2 bands (figure S7 (a-b)) in
the pristine bilayer display predominant in-plane character of the states located on the
I atoms, while the probability density for the third band (figure S7 (c)) shows much
more out-of-plane features. Upon addition of the compressive perpendicular strain, the
local VBM is characterized by states with more pronounced out-of-plane character on
the atoms of the inner I planes of the bilayer (figure S7 (a-b)).
Figure S8 shows the planar average plots for |Ψ|2 of the upper three valence bands
in the pristine and strained AFM configuration. It can be observed that in the pristine23
Figure S7. 3D iso-surface plots of the probability density for the upper valence states
of CrI3 bilayer in AFM configuration. (a)–(c) Unstrained bilayer at Γ and (d)–(f)
strained (5%) bilayer outside Γ along Γ − M direction. (a) and (d): first upper valence
band; (b) and (e): second upper valence band; (c) and (f): third upper valence band
for the unstrained and strained CrI3 bilayers, respectively. Drawn at iso-surface value
= 0.002 e/Bohr3 .
bilayer the highest lying two bands have the states localized on one of the layers of
the bilayer, on the I atoms. The third band, on the other hand shows a stronger
probability density in the Cr region and much more extended probability density in the
space between the layers. The states of the highest two bands in the strained bilayer,
outside Γ, bear significant resemblance to the states of the third-upper band at Γ in the
unstrained bilayer.
In figures S9 and S10 we show the 3D isosurface plots for the probability density
of the upper three valence bands in the pristine (at Γ) and strained FM configuration
(near Γ, in the ΓM 0 direction). The corresponding planar average plots of the probability
densities are shown in figure S11. Similar to the AFM case, in the pristine bilayer the
highest four states have dominant I in-plane character (figures S9, S10 and S11), while
the next two valence states have strong out-of-plane probability density, in particular on
the I atoms of the inner I planes of the bilayer. For the strained bilayer, the highest four
states outside Γ have pronounced out-of-plane features. These states, and particularly
the upper two states, resemble the fifth and sixth upper valence states at Γ of the
unstrained FM bilayer.
Hence, both for the FM and AFM bilayers, the pristine systems show a VBM24
Figure S8. Planar average plots of the probability density for the first three upper
valence bands of the pristine and strained AFM CrI3 bilayer. (a)–(c) Unstrained bilayer
at Γ and (d)–(f) compressed (5%) bilayer outside Γ (along Γ − M direction). (a) and
(d) First upper valence band; (b) and (e) second upper valence band; (c) and (f) third
upper valence band for the unstained and strained systems, respectively. The black
and red curves correspond to the degenerate states belonging to a particular band, the
green curve is the sum.
characterized by in-plane I states, while the application of the compressive strain induces
a new local VBM for which the states display significant out-of-plane orbitals on the
atoms of the I inner planes of the bilayer.25 Figure S9. 3D iso-surface plots of the probability density for the upper valence states of CrI3 bilayer in FM configuration. (a)–(c) Unstrained bilayer at Γ, (d)–(f) strained (5%) bilayer outside Γ along Γ − M 0 direction. (a) and (d): first upper valence state; (b) and (e): second upper valence state; (c) and (f): third upper valence state. Drawn at iso-surface value = 0.001 e/Bohr3 .
26

Figure S10. 3D iso-surface plots of the probability density for the upper valence
states of CrI3 bilayer in FM configuration. (g)–(i) Unstrained bilayer at Γ, and (j)–(l)
strained (5%) bilayer outside Γ along Γ − M 0 direction. (g) and (j): Fourth upper
valence state; (h) and (k): fifth upper valence state; (i) and (l): sixth upper valence
state for the unstrained and strained CrI3 bilayers, respectively. Drawn at iso-surface
value = 0.001 e/Bohr3 .
27

Figure S11. Planar average plots of the probability density for the upper six valence
bands of the pristine and strained CrI3 bilayer in FM configuration. (a)–(c) Unstrained
bilayer at Γ and (d)–(f) strained bilayer outside Γ (along Γ−M 0 direction). (a) and (d)
First and second upper valence states; (b) and (e) third and fourth upper valence states;
(c) and (f) fifth and six upper valence states for the unstained and strained systems,
respectively. The magenta and turquoise spheres show the iodine and chromium atoms,
respectively.
You can also read