ICare Population Management GUI - (BQI) Improving Patient Care User Manual - Indian Health Service
←
→
Page content transcription
If your browser does not render page correctly, please read the page content below
RESOURCE AND PATIENT MANAGEMENT SYSTEM

iCare Population Management GUI

                      (BQI)

   Improving Patient Care User Manual

               Version 2.7 Patch 1
                   June 2018

           Office of Information Technology
          Division of Information Technology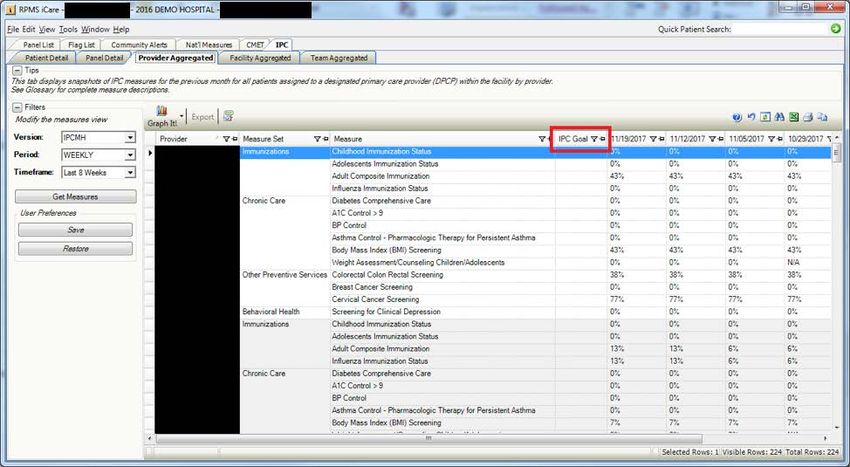
iCare Population Management GUI (BQI)                                                                              Version 2.7

Table of Contents
1.0       Introduction......................................................................................................... 1
          1.1    Background ............................................................................................. 1
          1.2    iCare Graphical User Interface ................................................................ 1
          1.3    Who Should Use iCare? .......................................................................... 2
2.0       Improving Patient Care Support in iCare.......................................................... 3
          2.1    IPC Package Manager............................................................................. 3
          2.2    iCare Site Parameter Options .................................................................. 3
          2.3    Creating IPC Panels ................................................................................ 5
          2.4    IPC Main View ......................................................................................... 5
           2.4.1 Main View Tab ....................................................................................... 5
           2.4.2 Sub-Tabs and Measures View............................................................... 6
           2.4.3 Glossary/Tips/Tooltips ......................................................................... 11
          2.5    User Preferences ................................................................................... 12
          2.6    IPC Data Collection ............................................................................... 15
          2.7    Graphing IPC Measures Over Time....................................................... 17
           2.7.1 Graph It! .............................................................................................. 17
           2.7.2 Common Graph It! Features ................................................................ 18
           2.7.3 Sample Graphs.................................................................................... 23
3.0       IPC Measures .................................................................................................... 27
          3.1    IPC4/IPC5 .............................................................................................. 27
          3.2    IPCMH Measures .................................................................................. 28
           3.2.1 Immunizations ..................................................................................... 29
           3.2.2 Chronic Care and Clinical Outcomes................................................... 34
           3.2.3 Other Preventive Services ................................................................... 43
           3.2.4 Behavioral Health ................................................................................ 45
           3.2.5 Population Health System ................................................................... 47
Glossary ....................................................................................................................... 49
Acronym List ............................................................................................................... 50
Contact Information .................................................................................................... 51

Improving Patient Care User Manual                                                                        Table of Contents
June 2018
                                                                ii
iCare Population Management GUI (BQI)                                                  Version 2.7

Preface
          The purpose of this manual is to provide the information needed to use the latest
          enhancements to the Panel List window in the iCare (BQI) population management
          application.

          This manual contains reference information about iCare views, examples of its
          processes, and step-by-step procedures to show how to perform activities related to
          the Panel List window in the latest version of the iCare application.

          For more information about iCare basic functionality, iCare usage, or training for
          iCare, consult these resources:
          •   iCare – IHS Office of Information Technology (OIT) available at
              https://www.ihs.gov/icare/
          •   iCare Population Management GUI, User Manual Version 2.7 (January 2018)
              available at https://www.ihs.gov/RPMS/PackageDocs/BQI/bqi_027u_ipc.pdf
          •   iCare Training available at https://www.ihs.gov/icare/training/
          •   Recorded Adobe Connect sessions for iCare available at
              https://ihs.adobeconnect.com/r6yazmoz1gm
          •   Join the iCare listserv by sending an e-mail to icare@listserv.ihs.gov

Improving Patient Care User Manual                                                        Preface
June 2018
                                               iii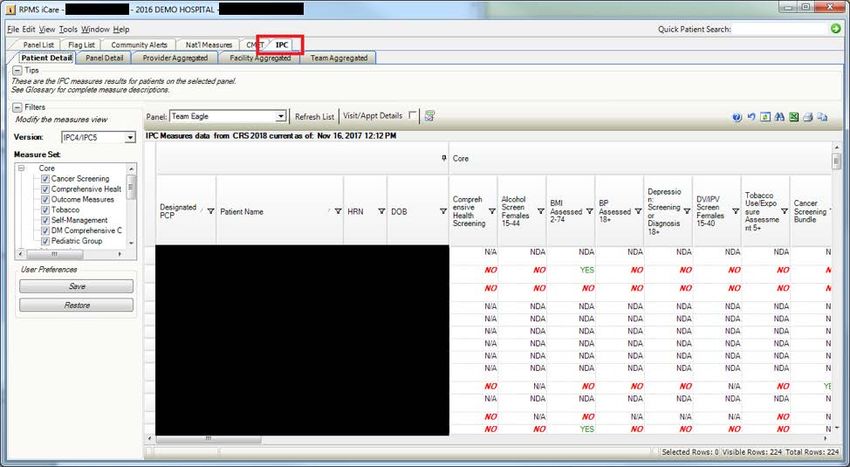
iCare Population Management GUI (BQI)                                                 Version 2.7

1.0       Introduction
          iCare is a computer desktop software application that provides a robust method of
          interacting with the IHS Resource and Patient Management System (RPMS). It
          retrieves key patient information from various components of the RPMS database and
          brings it all together under a single, user-friendly interface. iCare helps providers
          manage the care of their patients by providing the ability to group common categories
          (e.g., age, diagnosis, community) and create panels that personalizes the way they are
          able to interact with and gain valuable insights from patient data.

          The information included in this Improving Patient Care (IPC) manual covers the IPC
          functionality updated in iCare v2.7 p1. For more information about iCare basic
          functionality, iCare usage, or training for iCare, consult the resources listed above in
          the Preface.

1.1       Background
          Along with the rest of the healthcare industry, IHS has developed a set of chronic
          condition management (or register) applications, for diabetes, asthma, and human
          immunodeficiency virus (HIV). This type of application provides a way for
          healthcare providers to manage a specific group (register) of patients for a single-
          disease state. Register management applications assist healthcare providers to identify
          high-risk patients, proactively track care reminders and health status of individuals or
          populations, provide more standardized and appropriate care by embedding evidence-
          based guidelines and report outcomes.

          Many patients, however, have more than one diagnosed disease. For instance, at the
          current time within the Indian Health system, a diabetic asthmatic woman could be a
          member of four RPMS registers (diabetes, asthma, women’s health, and
          immunizations). This silo approach to patient care could potentially result in
          fragmented care and could increase the risk of inadequate patient-care management
          due to misidentification of the true level of risk.

1.2       iCare Graphical User Interface
          The iCare GUI is intended to allow healthcare providers to see a more complete view
          of patients with multiple conditions, while maintaining the integrity of the user-
          defined, disease-specific registers.

          iCare can help IHS providers by:
          •   Proactively identifying and managing different groups (populations) of patients
              who share user-defined characteristics.

Improving Patient Care User Manual                                                    Introduction
June 2018
                                               1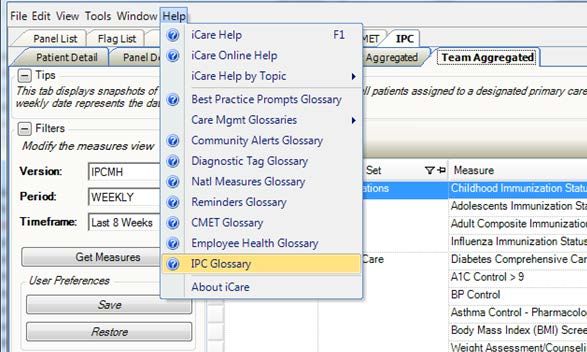
iCare Population Management GUI (BQI)                                                  Version 2.7

          •   Providing an integrated view of a patient’s conditions that would minimize siloed
              care management.
          •   Providing an intuitive and integrated interface to the diverse patient data elements
              of the RPMS database.
          •   Facilitating providers with a review of clinical quality of care measures for their
              own patients to enable improvement in the quality of healthcare delivery.
          •   Enabling views of traditional healthcare information from the perspectives of
              community, population, and public health.
          •   Providing the default tag selection as Proposed and Accepted. Tag selection can
              be changed for any record by selecting or de-selecting any check box.
          •   Selecting use AND? when there are multiple tags selected. The And option
              searches for patients who have ALL the user-defined tags.

1.3       Who Should Use iCare?
          Any provider who needs to identify a group of patients for long-term management or
          to create a temporary list should consider using iCare. Do you fit any of the following
          scenarios?
          •   I am a nurse at a facility that assigns a primary care provider to each patient.
              Every day, I want to create a list of scheduled patients for two different doctors in
              my clinic.
          •   I want to identify which of my patients are considered obese, so I can recommend
              nutrition counseling.
          •   Because providers at our clinic have performance goals related to annual
              Government Performance and Results Act (GPRA) clinical measures, I want to
              identify which of my patients are missing key clinical data.
          •   Our Women’s Health Clinic wants to focus on two clinical performance
              improvement initiatives this year. We want to identify the performance problem
              areas for female patients between the ages of 18 and 50.
          •   I am one of two part-time case managers for a group of children and I want to
              create a patient list that we both can use.

Improving Patient Care User Manual                                                     Introduction
June 2018
                                                2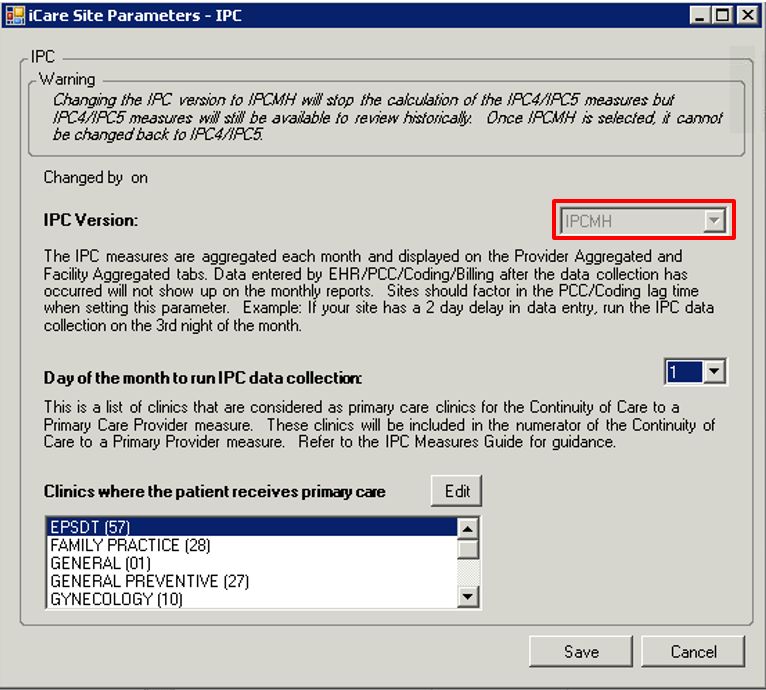
iCare Population Management GUI (BQI)                                              Version 2.7

2.0       Improving Patient Care Support in iCare
          IPC is an IHS initiative to improve the healthcare of American Indian and Alaska
          Native ITU patients. Learn more information about IPC at http://www.ihs.gov/ipc/.

2.1       IPC Package Manager
          There is an IPC Package Manager key. The user must be granted this key permission
          by the iCare Package Manager in order to manage the IPC site parameters.

          Figure 2-1: iCare User Access Management dialog – IPC Package Manager option

2.2       iCare Site Parameter Options
          Access the iCare Site Parameters from the Tools menu.

          Figure 2-2: iCare Site Parameter options

          Use the IPC Site Parameters option to determine the IPC version, day of the month to
          run IPC data collection, and clinics used for IPC. Select the IPC Site Parameters
          option to access the iCare Site Parameters - IPC dialog.

Improving Patient Care User Manual                    Improving Patient Care Support in iCare
June 2018
                                                3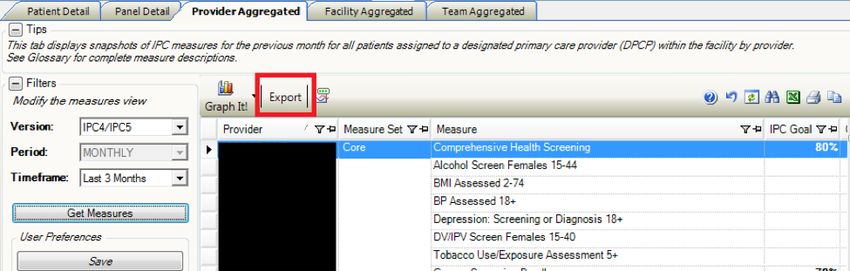
iCare Population Management GUI (BQI)                                                Version 2.7

          Figure 2-3: Sample iCare Site Parameters - IPC dialog

          IPC Version: This is the current version that a site is using. The standard current
          version was named IPC4/IPC5. With the installation of iCare v2.7 p1, the updated
          version named IPCMH has been updated. This control will be read only with the
          installation of iCare v2.7 p1.

             Warning: When iCare V2.7 p1 is installed, the site will
             automatically update to IPCMH. Once the IPC Version has been
             changed to IPCMH in IPC Site Parameters, it cannot be changed
             back to IPC4/IPC5. Also, calculations will no longer be done for
             version IPC4/IPC5, but all previous data will still exist for
             historical viewing.

Improving Patient Care User Manual                       Improving Patient Care Support in iCare
June 2018
                                                4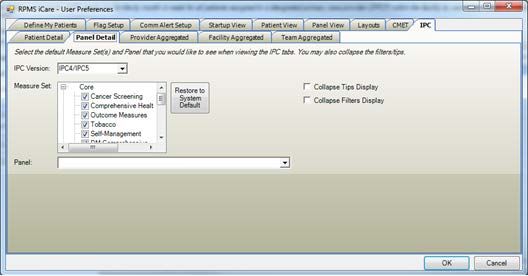
iCare Population Management GUI (BQI)                                                 Version 2.7

2.3       Creating IPC Panels
          In Panel Definition dialog on the Definition tab (Click Modify on Panel List Tab),
          any panel can be designated as an IPC panel. Only those panels selected will be
          available in the IPC tab. Any of the selected panels can be viewed in the IPC tab for
          the Patient Detail and Provider Detail tabs. The aggregation, seen on the three
          aggregated tabs, is only done for providers or teams that have providers who have
          assigned patients.

          Figure 2-4: Designation of New Patient Panel as IPC Panel by Team

          As shown in Figure 2-4, iCare also allows users to create panels of patients that are
          assigned to a Team.

2.4       IPC Main View

2.4.1     Main View Tab
          As shown in Figure 2-5, there is one IPC main view tab.

Improving Patient Care User Manual                       Improving Patient Care Support in iCare
June 2018
                                                5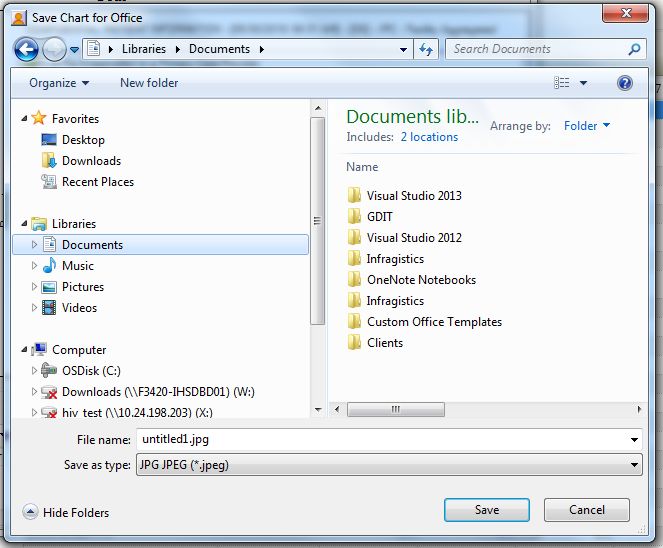
iCare Population Management GUI (BQI)                                                    Version 2.7

          Figure 2-5: IPC main view tab and sub-tabs – Patient Detail data displayed with IPC4/5
                       selected

2.4.2     Sub-Tabs and Measures View
          As shown in Figure 2-5, there are five IPC main view sub-tabs:
          •   Patient Detail
          •   Panel Detail
          •   Provider Aggregated
          •   Facility Aggregated
          •   Team Aggregated
          On the Patient Detail sub-tab, core, and supplemental IPC Measures compliance data
          for each patient (aggregated by provider) are shown in the table (see Figure 2-5) by
          the following designations:
          •   Yes (compliant)
          •   No (noncompliant)
          •   NDA (no data available)
          •   N/A (not applicable to patient).
          In the Panel menu above the data table, select a measure name to display IPC
          Measures data for all listed patients for the listed providers.

Improving Patient Care User Manual                        Improving Patient Care Support in iCare
June 2018
                                                 6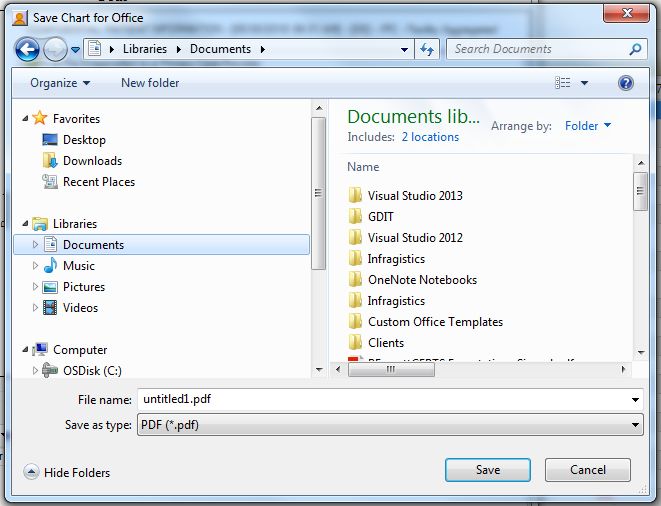
iCare Population Management GUI (BQI)                                                 Version 2.7

          Reduce the amount of horizontal scrolling necessary to see a large number of measure
          data columns: use the right sidebar Category Filter selector to limit columnar data
          display for each of these IPC Measures or measure sets individually:
          •   For a panel designated as an IPC panel, Patient Detail displays all patients with
              the values of their IPC Measures. The calculated values are based on the last
              iCare nightly job or weekly National Measures job.
          •   For the Panel Detail sub-tab, core, and supplemental IPC Measure compliance
              data for each provider are shown in the table by display of measure numerator,
              denominator, and compliance (% Met = numerator/denominator, Figure 2-6). In
              the Panel menu above the data table, display single IPC Measure data for all
              listed providers by selecting the measure name.
          •   In the Panel Detail view, a new column will display the total number of IPC
              patients who have no data available (Total NDA) (Figure 2-6). To the left of the
              NDA column, a new Total Deceased column also displays, which totals the
              suspected number of deceased patients erroneously included in each measure.

          Figure 2-6: IPC Panel Detail view with Total NDA column highlighted

          Click Aggregate to change the data in the table to an aggregated view for all
          measures and for all providers. The Aggregate View hides the Provider column and
          displays aggregated totals for all providers for each measure.

          IPC Goal data for the indicated measures also display in this table (Figure 2-7).

              Note: IPC Goal values currently only exist for IPC Version
                    IPC4/IPC5.

          For a panel designated as an IPC panel, Panel Detail displays aggregated data for all
          patients in the panel for all IPC Measures by provider. The values are calculated
          based on the last iCare nightly job or weekly National Measures job.

Improving Patient Care User Manual                       Improving Patient Care Support in iCare
June 2018
                                                7
iCare Population Management GUI (BQI) Version 2.7
Figure 2-7: IPC Panel Detail sub-tab – IPC Goal column
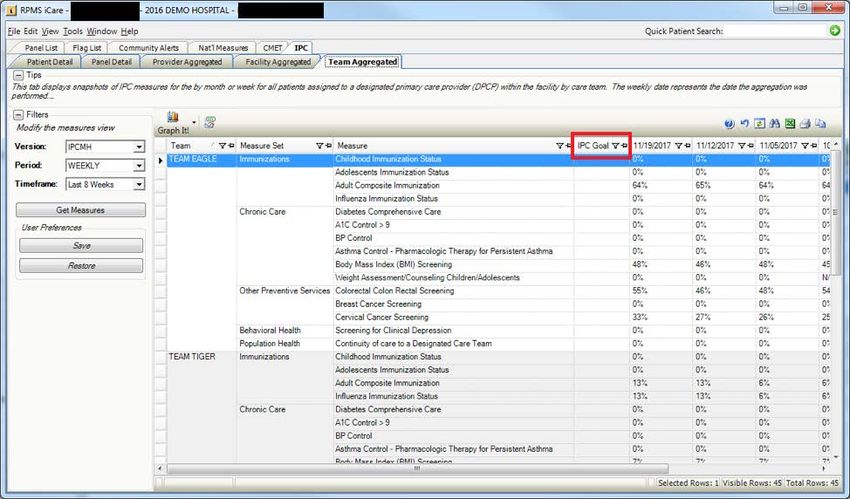
2.4.2.1 Provider Aggregated Sub-Tab
For the Provider Aggregated sub-tab, core, and supplemental IPC-measures
compliance data for each provider are shown in the table by the compliance rate
(% Met = numerator/denominator) for the indicated month (Figure 2-8). Move the
cursor to each data cell in the table to view the numerator and denominator (in a
hover box/tooltip) used for calculating the displayed compliance rate.
IPC Goal data for the indicated measures also display in this table (Figure 2-8).
Note: Currently, IPC Goal values exist for IPC Version
IPC4/IPC5 only.
As each month or week is processed, Provider Aggregated is a view of all providers
who are Primary Care Providers for all IPC Measures. These values are not refreshed
after they are calculated. They are a snapshot for the previous month or week, which
is calculated the next month or weekly on the day specified in the IPC site parameters
for data collection.
Improving Patient Care User Manual Improving Patient Care Support in iCare
June 2018
8iCare Population Management GUI (BQI) Version 2.7
Figure 2-8: Provider Aggregated sub-tab with data displayed
Click Graph It! for a user-definable, graphical display of the data in the table. The
appropriate IPC goals will also display in the graphs.
2.4.2.2 Facility Aggregated Sub-Tab
For the Facility Aggregated sub-tab, core, and supplemental IPC Measures
compliance data for all providers combined are shown in the table by display of the
compliance rate (% Met = numerator/denominator) for the indicated month (Figure
2-9). Move the cursor to each data cell in the table to view the numerator and
denominator (in a hover box) used for calculating the displayed compliance rate.
IPC Goal data for the indicated measures also appear in this table (Figure 2-9).
Note: Currently, IPC Goal values exist for IPC Version
IPC4/IPC5 only.
The Facility Aggregated sub-tab provides a month-by-month or weekly view for all
IPC Measures for all providers who are Primary Care Providers. These values are not
refreshed once they are calculated. They are a snapshot for the previous month that is
calculated the next month on the day specified in the IPC site parameters for data
collection.
Click Graph It! for a user-definable, graphical display of the data in the table. The
appropriate IPC goals will also display in the graphs.
Improving Patient Care User Manual Improving Patient Care Support in iCare
June 2018
9iCare Population Management GUI (BQI) Version 2.7
Figure 2-9: Facility Aggregated sub-tab
2.4.2.3 Team Aggregated Sub-Tab
For the Team Aggregated sub-tab, core, and supplemental IPC Measures compliance
data for all providers combined are shown in the table by display of the compliance
rate (% Met = numerator/denominator) for the indicated month (Figure 2-10). Move
the cursor to each data cell in the table to view the numerator and denominator (in a
hover box) used for calculating the displayed compliance rate.
IPC Goal data for the indicated measures also appear in this table (Figure 2-10).
The Team Aggregated sub-tab provides a month-by-month or weekly view for all
IPC Measures by team. These values are not refreshed once they are calculated. They
are a snapshot for the previous month that is calculated the next month on the day
specified in the IPC site parameters for data collection.
Click Graph It! for a user-definable, graphical display of the data in the table. The
appropriate IPC goals will also display in the graphs.
Note: Currently, IPC Goal values exist for IPC Version
IPC4/IPC5 only.
Improving Patient Care User Manual Improving Patient Care Support in iCare
June 2018
10iCare Population Management GUI (BQI) Version 2.7
Figure 2-10: Team Aggregated sub-tab – IPC Goal
2.4.3 Glossary/Tips/Tooltips
As shown in Figure 2-11, there are Tips for some IPC tabs that describe the displayed
information. Users can hide or display these Tips by clicking the Tips plus (+) or
minus (-) buttons.
By moving the cursor over IPC column names, measure names, and data cells, you
can also view informational IPC Tooltips that display in hover boxes.
Access the IPC Glossary by clicking Help in the top tool banner and selecting IPC
Glossary (Figure 2-11).
Improving Patient Care User Manual Improving Patient Care Support in iCare
June 2018
11iCare Population Management GUI (BQI) Version 2.7
Figure 2-11: Help menu, IPC Glossary
2.5 User Preferences
Click Tools in the tool banner to access the IPC User Preferences dialog. iCare
users can define IPC views from five IPC tab preferences; Patient Detail, Panel
Detail, Provider Aggregated, Facility Aggregated, and Team Aggregated.
The standard default for the Patient Detail and Panel Detail IPC User Preferences is
IPC Version IPC4/IPC5 and all measures checked (if no previous modification of
measures has been done by the user). Changing the IPC Version, Measure Set or
Panel and clicking OK saves the User Preferences for that tab. There is no way to
cancel any changes once OK has been clicked. Simply re-do them.
Check at least one measure for Measure Set before clicking OK. No data will display
unless measures are checked.
If a panel is not selected for the Panel, IPC Patient Detail or Panel Detail will
automatically select the first IPC panel from the panel list to load data.
There are three tabs were to set User Preferences for Provider Aggregated, Facility
Aggregated and Team Aggregated. The standard default values will be IPC Version
IPC4/IPC5; Period will be MONTHLY, and Timeframe will be This Current Year.
Improving Patient Care User Manual Improving Patient Care Support in iCare
June 2018
12iCare Population Management GUI (BQI) Version 2.7
If this is the first time signing on after the install of v2.7, the User Preferences will
default to the standard default. If the IPC tab is immediately selected after changing
User Preferences, it may be necessary to click Restore to implement the changes
made to User Preferences. On the Aggregated tabs, click Get Measures to refresh the
view. The alternate solution is to sign off from iCare and sign back on.
1. Patient Detail tab: IPC Version, Measure Set, Panel, Collapse Tips Display,
and Collapse Filters Display default (Figure 2-12).
Figure 2-12: User Preferences dialog – IPC tab, Patient Detail sub-tab
2. Panel Detail tab: IPC Version, Measure Set, Panel, Collapse Tips Display, and
Collapse Filters Display default (Figure 2-13).
Figure 2-13: User Preferences dialog – IPC tab, Panel Detail sub-tab
3. Provider Aggregated tab: IPC Version, Period, Timeframe, Collapse Tips
Display, and Collapse Filters Display (Figure 2-14)
Improving Patient Care User Manual Improving Patient Care Support in iCare
June 2018
13iCare Population Management GUI (BQI) Version 2.7
Figure 2-14: User Preferences dialog – IPC tab, Provider Aggregated sub-tab
4. Facility Aggregated tab: IPC Version, Period, Timeframe, Collapse Tips
Display, and Collapse Filters Display (Figure 2-15).
Figure 2-15: User Preferences dialog – IPC tab, Facility Aggregated sub-tab
5. Team Aggregated tab: IPC Version, Period, Timeframe, Collapse Tips
Display, and Collapse Filters Display (Figure 2-16).
Improving Patient Care User Manual Improving Patient Care Support in iCare
June 2018
14iCare Population Management GUI (BQI) Version 2.7
Figure 2-16: User Preferences dialog: IPC tab, Team Aggregated sub-tab
2.6 IPC Data Collection
The monthly IPC data aggregation will be automatically performed on the day of the
month as defined in the IPC site parameters for data collection, during the iCare
nightly job. The default date is the first of the month. Depending on the timeliness of
data entry at each site, this can be adjusted up to the seventh of the month.
The weekly IPC data aggregation will be automatically performed on Sunday during
the iCare Nightly Background job.
Version IPC4/IPC5 data can still be exported to the existing Excel templates that
were being used before. Version IPCMH data cannot be exported to the Excel
templates, but can be exported via the generic Excel export available on all datagrids
in iCare.
Figure 2-17: Export button
Improving Patient Care User Manual Improving Patient Care Support in iCare
June 2018
15iCare Population Management GUI (BQI) Version 2.7
To export the IPC4/IPC5 data, click Export in the tab toolbar as shown in Figure
2-17. A dialog will open. To complete the export process:
1. In the Provider box, add the appropriate providers.
2. On the IPC Export Parameters dialog (Figure 2-18), click Edit to edit the
Provider listings and select the Reporting Month. The selected reporting month
must have previously saved calculations and data.
Figure 2-18: IPC Export Parameter dialog – Reporting Month and Provider fields
3. Click OK; the file may now be opened in Excel.
Figure 2-19: Excel icon
4. Select the Provider’s Excel template to use (the standard one that you have been
using). Click OK to automatically populate the Excel template for the providers
specified in step 2.
5. Once the Excel template is updated, save the changes to the Excel file to complete
the export process. The data for the reporting month will display in the proper row
in the template.
Improving Patient Care User Manual Improving Patient Care Support in iCare
June 2018
16iCare Population Management GUI (BQI) Version 2.7
2.7 Graphing IPC Measures Over Time
2.7.1 Graph It!
Each of the IPC aggregated subtabs allows the user to graph the measure data by
provider, team or facility over time. This functionality seeks to show trends and
replaces the graphing capabilities that are no longer available with the former IPC
data portal. Once the data has loaded in the datagrid, the Graph It! menu options will
be enabled.
On the Provider Aggregated tab, the Graph It! menu option allows users to select By
Measure or By Provider, as shown in Figure 2-20.
Figure 2-20: Provider Aggregated - Graph It! By Provider
By Measure allows users to select one measure and one or more providers.
By Provider allows users to select one provider and one or more measurements.
On the Team Aggregated tab, the Graph It! menu option allows users to select By
Measure or By Provider, as shown in Figure 2-21.
Improving Patient Care User Manual Improving Patient Care Support in iCare
June 2018
17iCare Population Management GUI (BQI) Version 2.7
Figure 2-21: Team Aggregated - Graph It! By Team
By Measure allows users to select one measure and one or more teams.
By Team allows users to select one team and one or more measurements.
On the Facility Aggregated tab, Graph It! will not have options. Click Graph It! to
open the Graph It! dialog as shown in Figure 2-22.
Figure 2-22: Facility Aggregated - Graph It!
2.7.2 Common Graph It! Features
Accessing Graph It! from each of the IPC Aggregated tabs will have a common
interface.
2.7.2.1 File Menu
In the Graph It! dialog, the File menu has a Chart submenu with the following
options:
Improving Patient Care User Manual Improving Patient Care Support in iCare
June 2018
18iCare Population Management GUI (BQI) Version 2.7
Figure 2-23: Graph It! File > Chart submenu
• Page Setup opens the standard Windows Page Setup dialog.
• Print Preview opens the standard Windows Print Preview dialog.
• Print opens the standard Windows Print dialog.
• Save Chart for Office allows the user to save the chart as a JPG JPEG file as
shown in Figure 2-23.
Figure 2-24: Save Chart for Office as JPG
Improving Patient Care User Manual Improving Patient Care Support in iCare
June 2018
19iCare Population Management GUI (BQI) Version 2.7
• Save Chart as PDF allows the user to save the chart as a PDF as shown in Figure
2-24.
Figure 2-25: Save to PDF
In the Graph It! dialog, the File menu also has a Table submenu with the following
options:
Figure 2-26: Graph It! File > Table submenu
• Search allows users to search the contents of the Chart Data table for search text.
• Excel Export allows users to export the Chart Data table to an Excel file.
• Print opens the standard Windows Print dialog.
Improving Patient Care User Manual Improving Patient Care Support in iCare
June 2018
20iCare Population Management GUI (BQI) Version 2.7
• Copy Rows to Clipboard allows users to copy selected rows in the Chart Data
table to the Windows Clipboard.
2.7.2.2 Chart Options
On the top left, as shown in Figure 2-27, there is a collapsible section called Chart
Options (click the icon to collapse/expand the section). This section contains
selectable items like Provider (or Team) and Measurement Type. The options will
display differently based on the selected tab and menu option that opened the
window. The top control is single select, but the second control allows multiple
selection, if desired. To select multiple items, use the Control key to select items in
the control.
Note: Selecting multiple items will not allow all the Median line
to display.
Figure 2-27: Graph It! Chart Options
The controls from Chart Type list are common to each Graph It! option.
Chart Type is a list of chart types including Bar Chart, Bar Chart 3D, Column Chart,
Column Chart 3D, Cylinder Bar Chart 3D, Cylinder Column Chart 3D, Line Chart
(default), and Line Chart 3D.
Improving Patient Care User Manual Improving Patient Care Support in iCare
June 2018
21iCare Population Management GUI (BQI) Version 2.7
Figure 2-28: Graph It! Chart Type
Grid Lines is a check box that allows the user to show/hide grid lines from the chart
that is displayed, and the default is (checked).
Enable Zooming/Scrolling is a check box that allows the user to enable zooming and
scrolling of the chart for readability when there are too many or too few data points
and the default is unchecked.
Title is a check box that allows the user to show or hide the title bar of the chart
based on user preference and the default is checked.
Show Legend is a check box that allows the user to show or hide the legend for the
chart based on user preference and the default is checked. If checked, the list will
allow the user to display the legend at Top (default), Left, Right or Bottom
2.7.2.3 Chart
On the top right of the window, as shown in Figure 2-29, the Chart is displayed as a
visualization of the data. The user settings as selected in Chart Options will
determine how the Chart is generated.
Figure 2-29: Graph It! Chart
Improving Patient Care User Manual Improving Patient Care Support in iCare
June 2018
22iCare Population Management GUI (BQI) Version 2.7
2.7.2.4 Chart Data
At the bottom of the window is Chart Data, a collapsible section (click the icon
to collapse/expand the section). The data displayed in the data grid is provided to
confirm that the chart displays as expected. The columns are filtered (with the funnel
icon ) based on the selections in the Chart Options selected above.
Figure 2-30 Graph It! Chart Data
Figure 2-31 shows the dialog with both the Chart Options and Chart Data sections
collapsed.
Figure 2-31: Graph It! with Chart Options and Chart Data collapsed
2.7.3 Sample Graphs
2.7.3.1 Provider Aggregated – Graph It! By Measure
From the IPC – Provider Aggregated subtab, select the Graph It! menu option By
Measure, the window as shown in Figure 2-32, will display.
Improving Patient Care User Manual Improving Patient Care Support in iCare
June 2018
23iCare Population Management GUI (BQI) Version 2.7
Figure 2-32: Graph It! IPC - Provider Aggregated by Measure
2.7.3.2 Provider Aggregated – Graph It! By Provider
From the IPC – Provider Aggregated subtab, select the Graph It! menu option By
Provider, the window shown in Figure 2-33 will display.
Figure 2-33: Graph It! - IPC - Provider Aggregated by Provider
2.7.3.3 Team Aggregated – Graph It! by Measure
From the IPC – Team Aggregated subtab, select the Graph It! menu option By
Measure, the window as shown in Figure 2-34 will display.
Improving Patient Care User Manual Improving Patient Care Support in iCare
June 2018
24iCare Population Management GUI (BQI) Version 2.7
Figure 2-34: Graph It! IPC - Team Aggregated by Measure
2.7.3.4 Team Aggregated – Graph It! by Team
From the IPC – Provider Aggregated subtab, select the Graph It! menu option By
Team, the window as shown in Figure 2-35 will display.
Figure 2-35: Graph It! IPC - Team Aggregated by Team
Improving Patient Care User Manual Improving Patient Care Support in iCare
June 2018
25iCare Population Management GUI (BQI) Version 2.7
2.7.3.5 Facility Aggregated – Graph It!
From the IPC – Provider Aggregated subtab, select the Graph It! menu option By
Measure, the window as shown in Figure 2-36, will display.
Figure 2-36: Graph It! IPC - Facility Aggregated by Measure
Improving Patient Care User Manual Improving Patient Care Support in iCare
June 2018
26iCare Population Management GUI (BQI) Version 2.7
3.0 IPC Measures
Many of the measures used in IPC are mapped to IHS Clinical Reporting System
(CRS) measures. See the National Measures Glossary for details on the logic
definitions for these measures.
3.1 IPC4/IPC5
The following is a list of measures by name for all the IPC4/IPC5 measures available
for review in iCare v2.7 and earlier:
• Pap Smear w/HPV (24–64) (AC)
• Mammogram Rates 52–64
• Colorectal Cancer Screen 50–75
• DM: Comprehensive Care
• DM: Dental Access
• Topical Fluoride: 1–15
• Patients 5+: Physical Activity Assessment
• Goal Setting: Goal Set
• DM: A1c Good Glycemic ControliCare Population Management GUI (BQI) Version 2.7
• DM: Foot Exam
• STI: Prenatal HIV Screening
• Breastfeed Screen at two months: exclusive/mostly breastfed
• Breastfeed Screen at six months: exclusive/mostly breastfed
• Breastfeed Screening at two months
• Breastfeed Screening at six months
• Appropriate Testing for Pharyngitis (3–18)
• Weight Assessment & Counseling (3-–17): BMI
• Weight Assessment & Counseling (3–17): Nutrition
• Weight Assessment & Counseling (3–17): Physical Activity
• Antidepressant Medication Management: Acute Phase Management
• Antidepressant Medication Management: Continuation Phase Management
• Breastfeed Screen Rates
3.2 IPCMH Measures
Most of the IPCMH measures updated in iCare V2.7 p1 are based on measures
created for IPC in the IHS Clinical Reporting module (CRS) which is displayed in
iCare on the National Measures tabs.
The CRS report period in iCare is a Floating Date Range for a 12-month period. It is
not a specific Date Range such as a Calendar Year (January through December) or a
Fiscal Year (October through September). The report period is based on the date that
the patient is being updated; it could be during the nightly job or the weekly job. If a
patient has a visit in the past 24 hours, they will be updated in the nightly job.
Otherwise, all active patients are updated during the weekly job.
The iCare Report Begin Date is the Running Day minus 12 months. The Report End
Date is the Running Day.
All SNOMED subsets and taxonomies can be viewed in iCare to see specific code
values. The path is iCare Main View > Tools > Taxonomy Maintenance >
View/Edit Taxonomy Entries.
Improving Patient Care User Manual IPC Measures
June 2018
28iCare Population Management GUI (BQI) Version 2.7
3.2.1 Immunizations
Table 3-1: Childhood Immunization Status
Measure Description
Childhood Patients who have received the 4:3:1:3:3:1:4:1:2/3:2 combination (i.e. 4
Immunization DTaP, 3 Polio, 1 MMR, 3 HiB, 3 Hepatitis B, 1 Varicella, 4
Status Pneumococcal, 1 Hepatitis A, 2 or 3 Rotavirus, and 2 Influenza) by their
second birthday, including contraindications and evidence of disease.
Denominator Patients 2 years of age with no hospice indicator.
Denominator Checks the age of the patient. Not valid if patient turned 2 YEARS after
Logic Report End Date or the last day they are 2 years old is before the Report
Begin Date.
Hospice indicator check all POV visits during the Report Period for any
SNOMED found in SNOMED Subset PXRM BGP IPC HOSPICE or any
IPL problem list entry with a SNOMED found in SNOMED Subset PXRM
BGP IPC HOSPICE that does not have a status of Deleted or Inactive.
Or checks all inpatient discharges during the report period that has a
SNOMED from subset PXRM BGP IPC INPT ENC or subset PXRM
BGP IPC DISCHG HOSPICE.
The patient must have visit encounter during the Report Period that is a
Face to Face encounter (determined by using SNOMED subset PXRM
BGP IPC FACE2FACE or CPT Code from BGP IPC OFFICE VISIT
CPTS, BGP IPC PREVCARE EOV >=18 CPTS, BGP IPC PREVCARE
IOV >=18 CPTS, BGP IPC HOMEHEALTH VISIT CPTS, or BGP IPC
ANNUAL WELLNESS CPTS.
Numerator Patients who have received the 4:3:1:3:3:1:4:1:2/3:2 combination (i.e. 4
DTaP, 3 Polio, 1 MMR, 3 HiB, 3 Hepatitis B, 1 Varicella, 4
Pneumococcal, 1 Hepatitis A, 2 or 3 Rotavirus, and 2 Influenza) by their
second birthday, including contraindications and evidence of disease.
Improving Patient Care User Manual IPC Measures
June 2018
29iCare Population Management GUI (BQI) Version 2.7
Measure Description
Numerator 4 DTAP – Uses taxonomies BGP IPC DTAP CVX CODES and BGP IPC
Logic DTAP CPT CODES. For contraindication, it looks for Anaphylaxis value
or a POV/IPL for encephalopathy using taxonomy BGP IPC IZ
ENCEPHALOPATHY DXS or SNOMED subset PXRM BGP IPC IZ
ENCEPHAL
3 POLIO – Uses taxonomies BGP IPC IPV CVX CODES and BGP IPC
IPV CPT CODES between 42 days and 730 days of birth at least 1 day
apart. Patient is excluded if contraindicated for Anaphylaxis or Neomycin
Allergy.
1 MMR – Uses taxonomies BGP IPC MMR CVX CODES or BGP IPC
MMR CPT CODES within 730 days of birth. Patient is excluded for
Anaphylaxis or Neomycin Allergy contraindication or has a Problem,
POV or Refusal for SNOMED ID 292927007 Neomycin adverse reaction
(disorder) or immune disorder using taxonomy BGP IPC IMMUNE
DISORDERS DXS or SNOMED subset PXRM BGP IPC IMMUNE DIS
or HIV using taxonomy BGP IPC HIV DXS or SNOMED subset PXRM
BGP IPC HIV or lymphatic cancer using taxonomy BGP IPC
LYMPHATIC CANCER DXS or SNOMED subset PXRM BGP IPC
LYMPH CANCER.
3 HiB – Uses taxonomies BGP IPC HIB CVX CODES or BGP IPC HIB
CPT CODES to find HiB immunization between 42 days and 730 days of
birth at least 1 day apart. Patient is excluded for Anaphylaxis
contraindication.
3 Hepatitis B – Uses taxonomies BGP IPC HEPB CVX CODES or BGP
IPC HEPB CPT CODES to find immunizations within 730 days of birth at
least 1 day apart. Patient is excluded for Anaphylaxis contraindication or
a contraindication as a POV or Problem or Refusal for SNOMED ID
428321000124101 Anaphylaxis due to Hepatitis B vaccine (disorder),
34015007 Bakers' asthma (disorder), 419447004 Allergic reaction
caused by flour dust (disorder). Patient can be excluded if there is
evidence of Hep B as a POV or Problem using taxonomy BGP IPC HEP
B DXS or SNOMED subset PXRM BGP IPC HEP B EVID.
1 Varicella – Uses taxonomies BGP IPC VZV CVX CODES or BGP IPC
VZV CPT CODES within 730 days of birth. Patient is excluded if
contraindication for Anaphylaxis, Neomycin Allergy, or Immune
Deficiency or as a POV or Problem or Refusal using SNOMED ID
292927007 Neomycin adverse reaction (disorder) or POV using
taxonomy BGP IPC IMMUNE DISORDERS DXS or SNOMED subset
PXRM BGP IPC IMMUNE DIS or HIV using taxonomy BGP IPC HIV
DXS or SNOMED subset PXRM BGP IPC HIV or lymphatic cancer using
taxonomy BGP IPC LYMPHATIC CANCER DXS or SNOMED subset
PXRM BGP IPC LYMPH CANCER.
4 Pneumococcal – Uses taxonomies BGP IPC PNEUMO CVX CODES
or BGP IPC PNEUMO CPT CODES between 42 days and 730 days of
birth at least 1 day apart. Patient is excluded if contraindicated for
Anaphylaxis or a POV, Problem or Refusal for SNOMED ID 293116002
Pneumococcal vaccine adverse reaction (disorder).
Improving Patient Care User Manual IPC Measures
June 2018
30iCare Population Management GUI (BQI) Version 2.7
Measure Description
Numerator 1 Hepatitis A – Uses taxonomies BGP IPC HEPA CVX CODES or BGP
Logic (cont.) IPC HEPA CPT CODES within 730 days of birth. Patient is excluded if
contraindicated for Anaphylaxis or a POV, Problem or Refusal for
SNOMED ID 293126009 Hepatitis A vaccine adverse reaction (disorder)
or evidence of Hep A with a POV or Problem using taxonomy BGP IPC
HEP A DXS or SNOMED subset PXRM BGP IPC HEP A EVID.
2-3 Rotavirus – Uses taxonomies BGP IPC ROTA 2 DOSE CVX
CODES or BGP IPC ROTA 2 DOSE CPT CODES between 42 days and
730 days of birth at least 1 day apart to check for 2 doses. Uses
taxonomies BGP IPC ROTA 3 DOSE CVX CODES or BGP IPC ROTA 3
DOSE CPT CODES to check for 3 doses. Patient is excluded if
contraindicated for Anaphylaxis or Immune Deficiency or SNOMED ID
428331000124103 Anaphylaxis due to rotavirus vaccine (disorder) or a
POV for SCID using taxonomy BGP IPC SCID DXS or SNOMED subset
PXRM BGP IPC SCID or a POV for Intussusception using taxonomy
BGP IPC INTUSSUSCEPTION DXS or SNOMED subset PXRM BGP
IPC INTUSSUS.
2 Influenza - Uses taxonomies BGP IPC INFLUENZA CVX CODES or
BGP IPC INFLUENZA CPT CODES between 180 days and 730 days of
birth at least 1 day apart. Patient is excluded if contraindicated for a
POV, Problem or Refusal using SNOMED ID 420113004 Influenza virus
vaccine adverse reaction (disorder) or 292927007 Neomycin adverse
reaction (disorder) or POV using taxonomy BGP IPC IMMUNE
DISORDERS DXS or SNOMED subset PXRM BGP IPC IMMUNE DIS
or HIV using taxonomy BGP IPC HIV DXS or SNOMED subset PXRM
BGP IPC HIV or lymphatic cancer using taxonomy BGP IPC
LYMPHATIC CANCER DXS or SNOMED subset PXRM BGP IPC
LYMPH CANCER.
Table 3-2: Adolescents IZ: Meningococcal
Measure Description
Adolescents IZ: IPC User Population patients age 13 with no contraindication for Tdap,
Meningococcal Td, or meningococcal who had one dose of meningococcal vaccine on
or between the patient’s 11th and 13th birthdays.
Denominator IPC User Population patients age 13 with no contraindication for Tdap,
Td, or meningococcal.
Denominator Checks the age of the patient. Not valid if patient turned 13 YEARS after
Logic Report End Date or turned 13 before the Report Begin Date.
Numerator Patients who had one dose of meningococcal vaccine on or between the
patient’s 11th and 13th birthdays.
Numerator Uses taxonomies BGP MENINGOCOCCAL CVX CODES and BGP CPT
Logic MENINGOCOCCAL. For contraindication, it looks for Anaphylaxis value.
Improving Patient Care User Manual IPC Measures
June 2018
31iCare Population Management GUI (BQI) Version 2.7
Table 3-3: Adolescents IZ: Tdap/TD
Measure Description
Adolescents IZ: IPC User Population patients age 13 with no contraindication for Tdap,
Tdap/TD Td, or meningococcal who had one Tdap OR Td OR at least one tetanus
vaccine and at least one diphtheria vaccine on the same date of service
or on different dates of service on or between the patient’s 10th and 13th
birthdays.
Denominator IPC User Population patients age 13 with no contraindication for Tdap,
Td, or meningococcal.
Denominator Checks the age of the patient. Not valid if patient turned 13 YEARS after
Logic Report End Date or turned 13 before the Report Begin Date.
Numerator Patients who had one Tdap OR Td OR at least one tetanus vaccine and
at least one diphtheria vaccine on the same date of service or on
different dates of service on or between the patient’s 10th and 13th
birthdays.
Numerator Uses taxonomies BGP IPC TDAP CVX CODES and BGP CPT
Logic TDAP/TD or BGP IPC TD CVX CODES and BGP CPT TDAP/TD. Or
checks for 1 Diphtheria and 1 Tetanus using taxonomies BGP
DIPHTHERIA IZ DXS and BGP TETANUS TOXOID IZ DXS. For
contraindication, it looks for Anaphylaxis value.
Table 3-4: Adolescents IZ: Td/Tdap & Meningococcal
Measure Description
Adolescents IZ: IPC User Population patients age 13 with no contraindication for Tdap,
Td/Tdap & Td, or meningococcal who are compliant for both meningococcal and
Meningococcal Td/Tdap during the specified timeframes.
Denominator IPC User Population patients age 13 with no contraindication for Tdap,
Td, or meningococcal.
Denominator Checks the age of the patient. Not valid if patient turned 13 YEARS after
Logic Report End Date or turned 13 before the Report Begin Date.
Numerator Patients who are compliant for both meningococcal and Td/Tdap during
the specified timeframes.
Table 3-5: Adult Immunization Status
Measure Description
Adult IPC User Population patients ages 19 and older who have received all
Immunization age-appropriate immunization combinations. NOTE: The only refusals
Status included in this numerator are NMI (not medically indicated).
Denominator IPC User Population patients ages 19 and older.
Denominator Checks the age of the patient. Not valid if patient is less than 19 years
Logic old.
Numerator Patients who have received all age-appropriate immunization
combinations. NOTE: The only refusals included in this numerator are
NMI (not medically indicated) refusals.
Improving Patient Care User Manual IPC Measures
June 2018
32iCare Population Management GUI (BQI) Version 2.7
Measure Description
Numerator Patient’s age is between 19 and 59 they have had a DTAP immunization
Logic defined as a CVX code 115 or a CPT code of 90715 TDAP VACCINE 7
YRS/> IM if not contraindicated with Anaphylaxis or a NMI (not medically
indicated) refusal by the patient OR patient has 1 Tdap/Td immunization
in past 10 years with CVX codes 9, 113, 115, 138, 139 or a CPT from
taxonomy BGP CPT TDAP/TD or a diagnosis from taxonomy BGP TD IZ
DXS if not contraindicated with Anaphylaxis or a NMI (not medically
indicated) refusal by the patient.
Patient’s age is between 60 and 64 add a Zoster immunization to the
DTAP immunization. Zoster immunization defined as a CVX code 121,
187 or 188 or a CPT code from taxonomy BGP ZOSTER IZ CPTS or 2
BGP ZOSTER SHINGRIX CPTS (10 days apart) if not contraindicated
with Anaphylaxis or Immune Deficiency or a NMI (not medically
indicated) refusal by the patient.
Patient is excluded if patient contraindicated for a PPS23 immunization
defined with taxonomy BGP PPSV23 CVX CODES with Anaphylaxis or
taxonomy BGP PPSV23 CPT CODES with a NMI (not medically
indicated) refusal by the patient or contraindicated for a PCV13
immunization defined with taxonomy BGP PCV13 CVX CODES with
Anaphylaxis or taxonomy BGP PNEUMO CONJUGATE CPTS with a
NMI (not medically indicated) refusal by the patient.
Patient is included if patient has a PPS23 immunization defined with
taxonomy BGP PPSV23 CVX CODES or diagnosis using taxonomy
BGP PNEUMO IZ DXS or a CPT using taxonomy BGP PPSV23 CPT
CODES ever, past 5 years, past year or since turning 65. Patient is
included if patient has a PCV13 immunization defined with taxonomy
BGP PCV13 CVX CODES or a CPT with taxonomy BGP PNEUMO
CONJUGATE CPTS ever, last 5 years, past year or since turning 65.
Table 3-6: Influenza Immunization Status
Measure Description
Influenza Patients aged 6 months and older seen for a visit with no
Immunization contraindication for influenza vaccine who received an influenza
Status immunization OR who reported previous receipt of an influenza
immunization.
Denominator Patients aged 6 months and older seen for a visit during the period 92
days prior to the Report Period through 89 days after the beginning of
the Report Period with no contraindication for influenza vaccine.
Improving Patient Care User Manual IPC Measures
June 2018
33iCare Population Management GUI (BQI) Version 2.7
Measure Description
Denominator Checks the age of the patient. Not valid if patient turned 6 months after
Logic end date of report. Patient had a visit with a CPT from taxonomy BGP
IPC FLU ENCOUNTER CPTS, BGP IPC PERI DIALYSIS CPTS, or BGP
IPC HEMO DIALYSIS CPTS or SNOMED subset PXRM BGP IPC
FACE2FACE, PXRM BGP IPC PAT PROV INT or PXRM BGP IPC FLU
ENCOUNTER.
Patient is excluded if they have refusal using taxonomy BGP IPC
INFLUENZA CVX CODES or SNOMED ID 315640000 Influenza
vaccination declined (situation) or medical reason not done using
SNOMED ID 443390004 Refused (qualifier value) or subset PXRM BGP
IPC NO IZ MED, PXRM BGP IPC NO IZ PAT, or PXRM BGP IPC NO IZ
SYS
Patient is excluded if they have an allergy using diagnosis from
taxonomy BGP IPC EGG ALLERGY DXS or SNOMED subset PXRM
BGP IPC EGG ALLERGY or has a contraindication using taxonomy
BGP FLU IZ CVX CODES for Egg Allergy or Anaphylaxis or a Not
Medically Indicated refusal using taxonomy BGP IPC INFLUENZA CVX
CODES or BGP IPC INFLUENZA CPT CODES or a diagnosis using
taxonomy BGP IPC EGG ALLERGY or SNOMED subset PXRM BGP
IPC EGG ALLERGY or has one of the following SNOMED IDs;
294647003 Influenza vaccine allergy (disorder), 294648008 Influenza
split virion vaccine allergy (disorder), 294649000 Influenza surface
antigen vaccine allergy (disorder), 293112000 Influenza split virion
vaccine adverse reaction (disorder), 293113005 Influenza surface
antigen vaccine adverse reaction (disorder), 390796006 Influenza
vaccination contraindicated (situation), 420113004 Influenza virus
vaccine adverse reaction (disorder).
Numerator Patients who received an influenza immunization OR who reported
previous receipt of an influenza immunization.
Numerator Patient received an influenza immunization from taxonomy BGP IPC
Logic INFLUENZA CVX CODES or BGP IPC INFLUENZA CPT CODES or
has a problem or POV with one of the following SNOMED IDs;
185900003 Has influenza vaccination at home (finding), 185901004 Has
influenza vaccination at surgery (finding), 185902006 Has influenza
vaccination at hospital (finding), 416928007 Has influenza vaccination at
work (finding).
3.2.2 Chronic Care and Clinical Outcomes
Table 3-7: Diabetes Comprehensive Care
Measure Description
Diabetes IPC User Population patients with comprehensive diabetes care
Comprehensive (documented A1c AND blood pressure AND nephropathy assessment
Care AND retinal exam AND diabetic foot exam).
Denominator IPC User Population patients diagnosed with diabetes prior to the Report
Period.
Improving Patient Care User Manual IPC Measures
June 2018
34iCare Population Management GUI (BQI) Version 2.7
Measure Description
Denominator Patient must have had a Diabetes diagnosis using taxonomy
Logic SURVEILLANCE DIABETES prior to the beginning of the Report Period.
Patient is excluded if blind. Blind is determined as a problem using
taxonomy BGP BILATERAL BLINDNESS DXS or SNOMED subset
PXRM BGP BILAT BLINDNESS or PXRM BGP BLINDNESS
UNSPECIFIED (with laterality=bilateral) or both PXRM BGP LEFT EYE
BLIND and PXRM BGP RIGHT EYE BLIND or if patient had a procedure
using taxonomy BGP RIGHT EYE ENUCLEATION PROC and BGP
LEFT EYE ENUCLEATION PROCS or a CPT from BGP EYE
ENUCLEATION CPTS with modifier 50 (bilateral) or two CPTS at least
14 days apart.
Patient is excluded if they had a foot amputation. Foot amputation is
defined as a problem using SNOMED subset PXRM BGP ABSENCE OF
FOOT BIL, PXRM BGP ABSENCE OF FOOT RIGHT, PXRM BGP
ABSENCE OF FOOT LEFT or taxonomy BGP RIGHT FOOT AMP DXS,
BGP LEFT FOOT AMP DXS, BGP UNILATERAL FOOT AMP DXS or an
ICD procedure using taxonomy BGP BILAT FOOT AMP
PROCEDURES, BGP RIGHT FOOT AMP PROCS, BGP LEFT FOOT
AMP PROCS or a CPT from taxonomy BGP CPT BILAT FOOT AMP,
BGP FOOT AMP CPTS, or BGP CPT FOOT AMP UNKNOWN SIDE.
Numerator Patients with comprehensive diabetes care (documented A1c AND
blood pressure AND nephropathy assessment AND retinal exam AND
diabetic foot exam).
Improving Patient Care User Manual IPC Measures
June 2018
35iCare Population Management GUI (BQI) Version 2.7
Measure Description
Numerator Patient has an A1C lab test from taxonomies BGP IPC HBA1C LOINC
Logic CODES and DM AUDIT HGB A1C TAX during the Report Period.
Patient has Blood Pressure recorded as a measurement or a CPT from
taxonomy BGP BP MEASURED CPT or from both BGP SYSTOLIC BP
CPTS and BGP DIASTOLIC BP CPTS or a diagnosis from taxonomy
BGP HYPERTENSION SCREEN DXS.
Patient has Nephropathy Assessment which is met if patient is
diagnosed with End Stage Renal Disease (ESRD) using taxonomy BGP
ESRD PMS DXS or SNOMED subset PXRM END STAGE RENAL
DISEASE or taxonomy BGP ESRD CPTS or BGP ESRD PROCS OR
patient has an Estimated GFR lab using a lab test named ESTIMATED
GFR or taxonomy BGP GPRA ESTIMATED GFR TAX or BGP
ESTIMATED GFR LOINC with a recorded result AND a Quantitative
UACR lab test using taxonomy BGP QUANT UACR TESTS or BGP
QUANT UACR LOINC with a recorded result.
Patient has Retinal Exam defined as a DIABETIC EYE EXAM (03) in the
V Exam file or a CPT from taxonomy BGP DM RETINAL EXAM CPTS or
BGP DM EYE EXAM CPTS or an ICD procedure from taxonomy BGP
EYE EXAM PROCS or a visit to a Hospital Location (appointment clinic)
that is linked to Clinic Code A1 (DIABETIC RETINOPATHY) that was not
Did Not Keep Appointment or the Provider Class of the Primary Provider
on the visit was 24 (CONTRACT OPTOMETRIST), 79
(OPHTHALMOLOGIST) or 08 (OPTOMETRIST).
Patient has Diabetic Foot Exam defined as a DIABETIC FOOT EXAM
(28) in the V Exam file or a CPT from taxonomy BGP CPT FOOT EXAM
or a visit to a Hospital Location (appointment clinic) that is linked to
Clinic Code B7 (DIABETIC FOOT CLINIC) or 65 (PODIATRY) or the
Provider Class of the Primary Provider on the visit was 33
(PODIATRIST) or 84 (PEDORTHIST) or 25 (CONTRACT
PODIATRIST).
Table 3-8: Diabetes: Glycemic Control
Measure Description
Diabetes: Patients 18 through 75 years of age with diabetes and no hospice
Glycemic indicator who have poor control of their A1c (greater than (>) 9).
Control
Denominator Patients 18 through 75 years of age with diabetes and no hospice
indicator.
Improving Patient Care User Manual IPC Measures
June 2018
36iCare Population Management GUI (BQI) Version 2.7
Measure Description
Denominator Checks the age of the patient. Not valid if patient is less than 18 or
Logic greater than 74.
Must have had a diagnosis of diabetes as a POV or Problem using
taxonomy BGP IPC DIABETES DXS or SNOMED subset PXRM BGP
IPC DIABETES.
Must have had an office visit during the Report Period with a code using
taxonomies BGP IPC OFFICE VISIT CPTS, BGP IPC PREVCARE EOV
>=18 CPTS, BGP IPC PREVCARE IOV >=18 CPTS, BGP IPC
HOMEHEALTH VISIT CPTS, BGP IPC ANNUAL WELLNESS CPTS or
SNOMED subset PXRM BGP IPC FACE2FACE.
Hospice indicator checks all POV visits during the Report Period for any
SNOMED found in SNOMED Subset PXRM BGP IPC HOSPICE or any
IPL problem list entry with a SNOMED found in SNOMED Subset PXRM
BGP IPC HOSPICE that does not have a status of Deleted or Inactive.
Or checks all inpatient discharges during the report period that has a
SNOMED from subset PXRM BGP IPC DISCHG HOSPICE.
Numerator Poor Control. Patients with A1c greater than (>) 9.
Numerator Looks at lab tests from taxonomies BGP IPC HBA1C LOINC CODES
Logic and DM AUDIT HGB A1C TAX during the Report Period with a result
value greater than 9.
Table 3-9: Controlling High Blood Pressure
Measure Description
Controlling Patients 18 through 85 years of age diagnosed with hypertension and no
High Blood documented history of ESRD/kidney disease or current diagnosis of
Pressure pregnancy or hospice indicator with blood pressure < 140/90 (i.e., the
systolic value is less than 140 AND the diastolic value is less than 90)
Denominator Patients 18 through 85 years of age diagnosed with hypertension and no
documented history of ESRD/kidney disease or current diagnosis of
pregnancy or hospice indicator.
Improving Patient Care User Manual IPC Measures
June 2018
37iCare Population Management GUI (BQI) Version 2.7
Measure Description
Denominator Checks the age of the patient. Not valid if patient is less than 18 or
Logic greater than 85.
Must have had an office visit during the Report Period with a code using
taxonomies BGP IPC OFFICE VISIT CPTS, BGP IPC PREVCARE EOV
>=18 CPTS, BGP IPC PREVCARE IOV >=18 CPTS, BGP IPC
HOMEHEALTH VISIT CPTS, BGP IPC ANNUAL WELLNESS CPTS or
SNOMED subset PXRM BGP IPC FACE2FACE.
Must have hypertension diagnosis using taxonomies BGP IPC
ESSENTIAL HTN DXS, BGP IPC ESSENTIAL HTN DXS or SNOMED
subset PXRM BGP IPC HTN.
Hospice indicator checks all POV visits during the Report Period for any
SNOMED found in SNOMED Subset PXRM BGP IPC HOSPICE or any
IPL problem list entry with a SNOMED found in SNOMED Subset PXRM
BGP IPC HOSPICE that does not have a status of Deleted or Inactive.
Or checks all inpatient discharges during the report period that has a
SNOMED from subset PXRM BGP IPC DISCHG HOSPICE.
Patient has a pregnancy problem recorded during the Report Period
from taxonomy BGP IPC PREGNANCY DXS or SNOMED subset PXRM
BGP IPC PREGNANCY.
Patient having ESRD using taxonomy BGP IPC ESRD DXS or one of
the following SNOMED IDs; 236434000 End stage renal failure
untreated by renal replacement therapy (disorder), 236435004 End
stage renal failure on dialysis (disorder), 236436003 End stage renal
failure with renal transplant (disorder), 46177005 End stage renal
disease (disorder).
Patient having CKD using taxonomy BGP IPC CKD STG 5 DXS or
SNOMED ID 433146000 Chronic kidney disease stage 5 (disorder).
Patient having a procedure from BGP IPC VASCULAR ACC DIAL
CPTS, BGP IPC ESRD OPT SRV CPTS, BGP IPC KIDNEY
TRANSPLANT CPTS, or BGP IPC DIALYSIS SRV CPTS.
Numerator Patients with blood pressure < 140/90 (i.e., the systolic value is less than
140 AND the diastolic value is less than 90).
Numerator Checks the most recent Blood Pressure measurement during the Report
Logic Period where the systolic value is less than 140 AND the diastolic value
is less than 90.
Table 3-10: Medication Therapy for Persons with Asthma
Measure Description
Medication IPC User Population patients ages 5 and older with persistent asthma
Therapy for during the Report Period who were prescribed long-term control
Persons with medication during the Report Period.
Asthma
Denominator IPC User Population patients ages 5 and older with persistent asthma
during the Report Period.
Improving Patient Care User Manual IPC Measures
June 2018
38iCare Population Management GUI (BQI) Version 2.7
Measure Description
Denominator Checks the age of the patient. Not valid if patient is less than 5 years
Logic old.
Checks if the patient has an Asthma diagnosis from taxonomy BGP
ASTHMA DXS in the problem file as well as a persistent asthma
SNOMED ID from subset PXRM ASTHMA PERSISTENT or a severity
value greater than 1 from SNOMED subset PXRM ASTHMA or a
severity recorded in the V Asthma file.
Checks if patient refused a controller medication from taxonomy BGP
PQA CONTROLLER MEDS.
Checks if patient has a medication allergy to a medication from
taxonomy BGP PQA CONTROLLER MEDS or one of the following
asthma drugs; BECLOMETHASONE, BUDESONIDE, CICLESONIDE,
FLUNISOLIDE, FLUTICASONE, FORMOTEROL, LUTICASONE,
MOMETASONE, MONTELUKAST, SALMETEROL, THEOPHYLLINE,
ZAFIRLUKAST, or ZILEUTON.
Numerator Patients who were prescribed long-term control medication during the
Report Period.
Numerator Checks if Asthma patient has an active medication from taxonomy BGP
Logic PQA CONTROLLER MEDS or BGP PQA CONTROLLER NDC
Table 3-11: Dental Treatment
Measure Description
Dental IPC User Population patients with a dental exam during the Report
Treatment Period with all dental treatment completed.
Denominator IPC User Population patients with a dental exam during the Report
Period.
Denominator A visit during the report period containing dental codes from taxonomy
Logic BGP DENTAL EXAM ADA CODES or BGP DENTAL EXAM CPTS.
Numerator Patients with all treatment completed.
Numerator A visit during the report period containing ADA code 9990.
Logic
Table 3-12: Body Mass Index (BMI) Screening/Follow up
Measure Description
Body Mass Patients aged 18 years and older with at least one eligible encounter
Index (BMI) during the Report Period and no diagnosis of pregnancy with a
Screening documented BMI during the encounter or during the previous twelve
/Follow up months, AND when the BMI is outside of normal parameters, a follow-up
plan is documented during the encounter or during the previous twelve
months of the current encounter.
Denominator Patients aged 18 years and older with at least one eligible encounter
during the Report Period and no diagnosis of pregnancy.
Improving Patient Care User Manual IPC Measures
June 2018
39You can also read