Development and validation of a nomogram for predicting severity in patients with hemorrhagic fever with renal syndrome: A retrospective study
←
→
Page content transcription
If your browser does not render page correctly, please read the page content below
Open Medicine 2021; 16: 944–954
Research Article
Zheng Yang#, Qinming Hu#, Zhipeng Feng#, Yi Sun*
Development and validation of a nomogram for
predicting severity in patients with hemorrhagic
fever with renal syndrome: A retrospective study
https://doi.org/10.1515/med-2021-0307 Conclusion ‒ In this study, we established a simple and
received February 3, 2021; accepted May 11, 2021 feasible model to predict severity in patients with HFRS,
Abstract with which HFRS would be better identified and patients
Background ‒ Hemorrhagic fever with renal syndrome can be treated early.
(HFRS) is a zoonotic disease caused by hantavirus infec- Keywords: hantavirus, hemorrhagic fever with renal syn-
tion. Patients with severe HFRS may develop multiple drome, severity, nomogram, predictive model
organ failure or even death, which makes HFRS a serious
public health problem.
Methods ‒ In this retrospective study, we included a
total of 155 consecutive patients who were diagnosed 1 Introduction
with HFRS, of whom 109 patients served as a training
cohort and 46 patients as an independent verification Hemorrhagic fever with renal syndrome (HFRS) is a rodent-
cohort. In the training set, the least absolute shrinkage borne zoonotic disease caused by hantavirus infection.
and selection operator (LASSO) regression was used to HFRS can be caused by Hantaan virus (HTNV), Dobrava
screen the characteristic variables of the risk model. virus (DOBV), Seoul virus (SEOV), Amur virus (AMV),
Multivariate logistic regression analysis was used to con- Puumala virus (PUUV), etc. The severity of HFRS patients
struct a nomogram containing the characteristic vari- caused by different viral infections is also different [1]. HFRS
ables selected in the LASSO regression model. is characterized by systemic vascular endothelial dysfunc-
Results ‒ The area under the receiver operating charac- tion and increased vascular permeability. The clinical mani-
teristic curve (AUC) of the nomogram indicated that the festations include fever, hemorrhage, renal insufficiency,
model had good discrimination. The calibration curve thrombocytopenia, and shock [2,3]. HFRS is mainly preva-
exhibited that the nomogram was in good agreement between lent in Asia and Europe, while China is the most serious
the prediction and the actual observation. Decision curve epidemic area in the world. A total of 1,118,124 cases were
analysis and clinical impact curve suggested that the predic- reported during 2008–2018 in China, which accounts for
tive nomogram had clinical utility. more than 90% of global HFRS cases [4–6]. In China,
HFRS is mainly infected by HTNV and SEOV, and the mor-
tality rate of HFRS caused by these viruses is between 5 and
15%, making it a serious public health concern [7]. Until
now, there is no effective antiviral treatment for HFRS,
which leads to a high mortality rate in critically ill cases.
# Zheng Yang, Qinming Hu and Zhipeng Feng contributed equally
Early and accurate assessment of the severity and prognosis
to this work.
of HFRS patients is of great significance for guiding clinical
treatment and the reasonable allocation of medical resources.
* Corresponding author: Yi Sun, Department of Dermatology, However, currently, there is no simple and effective
Jingzhou Hosiptal, Yangtze University, No. 60 Jingzhong Road, model to predict the severity in patients with HFRS. A study
Jingzhou District, Hubei Province, Jingzhou, 434020, China, shows that the Sequential Organ Failure Assessment (SOFA)
e-mail: jzzxyysy@163.com, tel: +86-0716-8436354,
score is related to the severity of HFRS, but this scoring
fax: +86-0716-8436354
Zheng Yang, Qinming Hu, Zhipeng Feng: Department of Infectious
system is more complex compared with other scoring sys-
Disease, Jingzhou Hospital, Yangtze University, Jingzhou, 434020, tems. Besides, it does not include the clinical characteristics
China of patients and cannot directly reflect the severity of
Open Access. © 2021 Zheng Yang et al., published by De Gruyter. This work is licensed under the Creative Commons Attribution 4.0
International License.
Nomogram for predicting severity in HFRS patients 945
patients, so its clinical application is limited [8]. Nomogram edema, and renal injury indicators like urinary protein
is a statistical prediction model established based on the and urea nitrogen, the severity of HFRS was divided
characteristic phenotype of the disease, which is used to into four clinical types [10]. The four clinical types were
predict the probability of a certain outcome event in a popu- as follows: (1) the mild group had renal injury without
lation with certain characteristics in the future. Nomogram hypotension and oliguria; (2) the moderate group had
transforms the complex regression equation into a visual obvious uremia, bulbar conjunctival edema, skin and
graph, making the results of the prediction model more mucosal hemorrhage, and acute renal failure with typical
readable and convenient to evaluate the patient’s condition oliguria; (3) the severe group showed severe uremia,
[9]. With this clinical prediction model, doctors can simply bulbar conjunctiva and peritoneal or pleural effusion,
and accurately predict the patient’s condition, thereby pro- skin and mucosal bleeding, hypotension, and acute
viding a basis for clinical decision-making. Consequently, renal failure with oliguria (patients with daily output
in this study, we retrospectively analyzed the clinical cha- of 50–500 mL ≤5 days or urine output 5 days)
or anuria (urine 2 days) or blood urea
2 Methods nitrogen (BUN) >42.84 mmol/L. In this study, patients
were divided into two groups. The mild group was com-
posed of mild and moderate patients, while the severe
2.1 Study population
group was composed of severe and critically ill patients.
This study retrospectively analyzed a total of 155 conse-
Ethics approval and consent to participate: The study
cutive patients diagnosed with HFRS in Jingzhou Central
was reviewed and approved for publication by the
Hospital from January 1, 2015, to December 31, 2019. One
Institutional Review Board of Jinghzou Central Hospital,
hundred nine patients from January 1, 2015, to December
and the requirement for informed consent from the study
31, 2018, served as a training cohort, and 46 patients
participants was waived.
from January 1, 2019, to December 31, 2019, served as an
independent verification cohort. Patients with confirmed
Consent for publication: Not applicable.
HFRS were included in this study. The diagnostic criteria
of the patients were as follows: (1) acute fever, accompanied
by abnormal renal function, thrombocytopenia, etc.; and (2)
2.3 Statistical analysis
the hantavirus-specific immunoglobulin (Ig) M antibody in
the peripheral blood was positive. The exclusion criteria
All statistical analyses in this study were carried out using
included: (1) age946 Zheng Yang et al.
presented as percentages (%). LASSO regression is a 3 Results
model in which the L1-norm constraint term is added to
the cost function of the linear regression model. It is used
3.1 Demographic and clinical characteristics
to analyze medical data with high dimension, strong cor-
relation, and small samples by controlling the parameter of patients with HFRS
lambda for variable screening and complexity adjust-
ment [11]. In this study, the glmnet package in LASSO A total of 155 HFRS patients were included in our study,
regression was used to select the best predictive charac- of whom 11 died, with a mortality rate of 7.10%. Table 1
teristics of risk factors from HFRS patients. Multivariate summarizes the demographic characteristics of HFRS in
logistic regression analysis was applied to construct the the training cohort and the verification cohort, showing
nomogram of the predictive model by including the that there is no significant difference in gender, age, basic
selected variables with non-zero coefficient characteris- disease, clinical disease classification, and clinical out-
tics in the LASSO regression model [12]. come between the two populations. We analyzed the clin-
We evaluated the performance of the nomogram ical characteristics of mild and severe groups in the
through discrimination and calibration in the training training cohort of 109 patients with HFRS. The median
population and the verification population, respectively. age of the training cohort was 53 years, including 79 men
Since the consistency index (C-index) is equivalent to the and 30 women (Table 2). The most common clinical mani-
area under the receiver operating characteristic curve festations of HFRS patients were fever (90.8%), oliguria
(AUC) in logistic regression, we used the AUC to evaluate (58.7%), nausea (35.8%), chills (35.8%), vomiting (33.0%),
the discriminative ability of the nomogram [13]. The Hosmer– diarrhea (28.4%), headache (26.6%), low back pain (25.7%),
Lemeshow goodness-of-fit test is performed to evaluate fatigue (22.0%), abdominal distension (20.2%), and so on.
the calibration of the nomogram, and a calibration curve Among the aforementioned symptoms, only oliguria and
is drawn to visualize the consistency between the pre- arthralgia were statistically different between the critically
dicted results and the observed results [14]. By quanti- ill group and the mild group. The results of laboratory
fying the net benefit under each risk threshold prob- examination showed that the levels of white blood cells
ability, the decision curve analysis (DCA) of the model (WBCs), neutrophils, lymphocytes, procalcitonin (PCT),
is drawn to evaluate the clinical validity of the nomogram C-reactive protein (CRP), urine protein, urea nitrogen,
[15]. We drew a nomogram plot and a calibration plot creatinine, cystatin C, creatine kinase, creatine kinase
based on the rms R package. The pROC R package was muscle-brain isoform (CK-MB), and myoglobin increased
used to draw the receiver operating characteristic (ROC) more significantly in severe HFRS patients, while the levels
curve and calculate the C-index. The rmda R package was of platelets (PLT), hemoglobin (Hb), albumin, and calcium
used to draw the DCA and the clinical impact curve. (Ca) decreased more significantly in severe patients.
Table 1: Baseline characteristics of patients with HFRS in the training and validation cohorts
Characteristic All patients Training cohort Validation cohort P value
N = 155 N = 109 N = 46
Sex 0.790
Female 41 (26.5%) 30 (27.5%) 11 (23.9%)
Male 114 (73.5%) 79 (72.5%) 35 (76.1%)
Age, years 54.0 (47.0–62.0) 53.0 (47.0–62.0) 55.0 (50.0–63.8) 0.323
Basic disease 0.139
No 109 (70.3%) 81 (74.3%) 28 (60.9%)
Yes 46 (29.7%) 28 (25.7%) 18 (39.1%)
Clinical type 0.474
Mild 69 (44.5%) 46 (42.2%) 23 (50.0%)
Severe 86 (55.5%) 63 (57.8%) 23 (50.0%)
Clinical outcomes 0.508
Deceased 11 (7.10%) 9 (8.26%) 2 (4.35%)
Survived 144 (92.9%) 100 (91.7%) 44 (95.7%)
Basic diseases include hypertension, diabetes, coronary heart disease, stroke, chronic liver disease, chronic lung disease, and other
diseases. P values indicate differences between training and validation cohorts. P < 0.05 was considered statistically significant.Nomogram for predicting severity in HFRS patients 947
Table 2: Demographic and clinical features of patients with HFRS in the training cohorts
Characteristic All patients Mild Severe P value
N = 109 N = 46 N = 63
Sex 0.218
Female 30 (27.5%) 16 (34.8%) 14 (22.2%)
Male 79 (72.5%) 30 (65.2%) 49 (77.8%)
Age, years 53.0 (47.0–62.0) 50.5 (47.0–62.0) 57.0 (46.5–62.5) 0.337
Signs and symptoms
Fever 0.186
No 10 (9.17%) 2 (4.35%) 8 (12.7%)
Yes 99 (90.8%) 44 (95.7%) 55 (87.3%)
Chills 0.428
No 70 (64.2%) 32 (69.6%) 38 (60.3%)
Yes 39 (35.8%) 14 (30.4%) 25 (39.7%)
Headache 1.000
No 80 (73.4%) 34 (73.9%) 46 (73.0%)
Yes 29 (26.6%) 12 (26.1%) 17 (27.0%)
Nausea 1.000
No 70 (64.2%) 30 (65.2%) 40 (63.5%)
Yes 39 (35.8%) 16 (34.8%) 23 (36.5%)
Vomiting 0.053
No 73 (67.0%) 36 (78.3%) 37 (58.7%)
Yes 36 (33.0%) 10 (21.7%) 26 (41.3%)
Abdominal bloating 0.917
No 87 (79.8%) 36 (78.3%) 51 (81.0%)
Yes 22 (20.2%) 10 (21.7%) 12 (19.0%)
Poor appetite 0.356
No 95 (87.2%) 38 (82.6%) 57 (90.5%)
Yes 14 (12.8%) 8 (17.4%) 6 (9.52%)
Abdominal pain 0.731
No 100 (91.7%) 43 (93.5%) 57 (90.5%)
Yes 9 (8.26%) 3 (6.52%) 6 (9.52%)
Backache 0.762
No 81 (74.3%) 33 (71.7%) 48 (76.2%)
Yes 28 (25.7%) 13 (28.3%) 15 (23.8%)
Diarrhea 0.124
No 78 (71.6%) 37 (80.4%) 41 (65.1%)
Yes 31 (28.4%) 9 (19.6%) 22 (34.9%)
Dyspnea 0.072
No 104 (95.4%) 46 (100%) 58 (92.1%)
Yes 5 (4.59%) 0 (0.00%) 5 (7.94%)
Oliguria 0.010
No 45 (41.3%) 26 (56.5%) 19 (30.2%)
Yes 64 (58.7%) 20 (43.5%) 44 (69.8%)
Cough 0.731
No 100 (91.7%) 43 (93.5%) 57 (90.5%)
Yes 9 (8.26%) 3 (6.52%) 6 (9.52%)
Expectoration 1.000
No 104 (95.4%) 44 (95.7%) 60 (95.2%)
Yes 5 (4.59%) 2 (4.35%) 3 (4.76%)
Chest tightness 0.394
No 104 (95.4%) 45 (97.8%) 59 (93.7%)
Yes 5 (4.59%) 1 (2.17%) 4 (6.35%)
Black stool 1.000
No 106 (97.2%) 45 (97.8%) 61 (96.8%)
Yes 3 (2.75%) 1 (2.17%) 2 (3.17%)
Fatigue 0.521
No 85 (78.0%) 34 (73.9%) 51 (81.0%)
Yes 24 (22.0%) 12 (26.1%) 12 (19.0%)
Orbita pain 0.261948 Zheng Yang et al.
Table 2: Continued
Characteristic All patients Mild Severe P value
N = 109 N = 46 N = 63
No 106 (97.2%) 46 (100%) 60 (95.2%)
Yes 3 (2.75%) 0 (0.00%) 3 (4.76%)
Myalgia 0.163
No 100 (91.7%) 40 (87.0%) 60 (95.2%)
Yes 9 (8.26%) 6 (13.0%) 3 (4.76%)
Arthralgia 0.029
No 105 (96.3%) 42 (91.3%) 63 (100%)
Yes 4 (3.67%) 4 (8.70%) 0 (0.00%)
Pulmonary hemorrhage 0.508
No 107 (98.2%) 46 (100%) 61 (96.8%)
Yes 2 (1.83%) 0 (0.00%) 2 (3.17%)
Gastrointestinal bleeding 0.072
No 104 (95.4%) 46 (100%) 58 (92.1%)
Yes 5 (4.59%) 0 (0.00%) 5 (7.94%)
Cerebral hemorrhage 0.508
No 107 (98.2%) 46 (100%) 61 (96.8%)
Yes 2 (1.83%) 0 (0.00%) 2 (3.17%)
History of rat exposure 0.507
No 33 (30.3%) 16 (34.8%) 17 (27.0%)
Yes 76 (69.7%) 30 (65.2%) 46 (73.0%)
Highest temperature, °C 39.0 ± 0.63 39.1 ± 0.59 39.0 ± 0.65 0.192
Time from symptom onset to admission 5.00 (4.00–7.00) 5.00 (4.00–7.00) 5.00 (4.00–6.00) 0.173
Laboratory findings
WBC, ×109/L 20.5 (12.4–30.6) 12.6 (9.53–21.5) 25.2 (17.5–35.8)Nomogram for predicting severity in HFRS patients 949
3.2 Prognostic factors in patients with In the training cohort and the validation cohort, the calibra-
severe HFRS tion plot and Hosmer–Lemeshow goodness-of-fit test showed
that the P values were 0.745 and 0.398, respectively; both
After excluding variables with irrelevant characteristics P values were >0.05, demonstrating that the predicted prob-
from the training cohort, 54 variables were finally included ability of nomogram was in good agreement with the real
in the LASSO regression for analysis (Figure 1a). The para- results (Figure 4a and b).
meter lambda (λ) was selected by using tenfold cross-vali-
dation based on the minimum standard in the LASSO
model. The two vertical dashed lines in Figure 1b represent
the log(λ) of the minimum mean square error (left dashed 3.4 Clinical utility
line) and the log(λ) of the minimum distance standard
error (right dashed line). To provide a simple and accurate DCA shows that using nomogram to predict the risk of
clinical model, six variables corresponding to the log(λ) of severe illness in HFRS patients can benefit patients if the
minimum mean square error, “neutrophils,” “Hb,” “Plate- threshold probability of the patient or doctor is between 0
lets,” “Creatinine,” “Ca,” and “Dyspnea,” were selected and 1 (Figure 5a). Within this range, according to the
into the model (Figure 2, Table 3). nomogram, the net benefit is comparable, but there are
multiple overlaps.
3.3 Development and verification of a
nomogram 4 Discussion
The regression model based on six independent variables HFRS is an infectious disease of global concern caused by
for predicting the severity of HFRS determined by LASSO hantavirus infection, which is characterized by increased
regression analysis was represented by a nomogram vascular permeability, acute thrombocytopenia, and
(Figure 2). According to the nomogram, we can get the renal damage. China has recorded the highest number
points corresponding to each predictor and then record of confirmed HFRS cases in the world [3]. HFRS patients
the total score of these points, so as to accurately predict can be clinically manifested as mild, moderate, severe,
the risk of serious illness in the corresponding HFRS and critical. Generally, HFRS caused by HTNV and SEOV
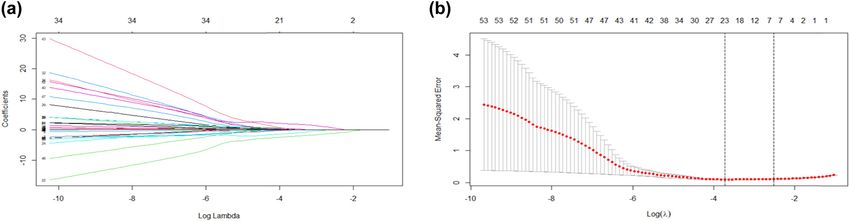
patients. As shown in Figure 3a and b, the AUC of the infection is more serious, with a mortality rate of 5–15%
nomogram in the training and validation cohorts is 0.969 [7]. The purpose of this study is to analyze the clinical
(95% CI: 0.935–1.000) and 0.934(95% CI: 0.847–1.000), characteristics and laboratory examination of patients
respectively. The AUC values of these two cohorts are more with HFRS and establish a nomogram to predict the
than 0.9, indicating that the model has good discrimination. severity of the disease. Through this simple and feasible
Figure 1: Predictive factors for patients with severe HFRS were selected by LASSO regression. (a) Fifty-four variables from the training cohort
were included in the LASSO regression (y-axis). The average number of predictors was shown at the top x-axis. (b) The parameter lambda (λ)
was selected by using tenfold cross-validation based on the minimum standard in the LASSO model. The two vertical dashed lines represent
the log(λ) of the minimum mean square error (left dashed line) and the log(λ) of the minimum distance standard error (right dashed line).
HFRS, hemorrhagic fever with renal syndrome; LASSO, least absolute shrinkage and selection operator; λ, lambda.950 Zheng Yang et al.
Figure 2: Nomogram to predict the risk of severity in patients with HFRS. To use the nomogram in clinical practice, a line can be drawn up to
calculate the patient’s total score by the value of each predictor variable, and then, a line can be drawn down based on the total score to find
out the possibility of severe HFRS. HFRS, hemorrhagic fever with renal syndrome; Hb, hemoglobin; Ca, calcium.
Table 3: Prognostic factors in patients with severe HFRS dysfunction may also lead to abnormal blood coagulation
[17]. In the training cohort (Table 2), there were 63 ser-
Intercept and β Odds ratio (95% CI) P value iously ill patients, including 2 patients with pulmonary
variable hemorrhage, 5 patients with gastrointestinal hemorrhage,
Intercept 4.437 84.523 (0.001–3.508 0.465 and 2 patients with intracranial hemorrhage. However,
× 107) there is no statistical difference between severe and mild
Neutrophils 0.013 1.013 (0.913–1.139) 0.811 patients due to the small sample size.
Hb −0.037 0.963 (0.916–1.004) 0.103
In this study, the platelet count decreased more sig-
Platelets −0.009 0.991 (0.965–1.0140) 0.481
Creatinine 0.011 1.011 (1.007–1.017) 0.001
nificantly in the severe group. At the same time, after the
Ca −2.632 0.072 (0.000–16.208) 0.361 parameter λ was selected by the tenfold cross-validation
Dyspnea 18.937 1.676 × 10⁸ (0.000–NA) 0.994 based on the minimum standard in the LASSO model, the
platelet count was also included in the regression model,
Abbreviations: HFRS, hemorrhagic fever with renal syndrome; β,
indicating that platelet count can be used as a predictor
regression coefficient; CI, confidence interval; Hb, hemoglobin;
Ca, calcium; NA, not applicable. of the severity of HFRS patients.
In patients with viral hemorrhagic fever, platelets
can cause abnormal homeostasis and inflammatory acti-
prediction model, we can identify the patient’s condition vation, thereby inhibiting the body’s antiviral immune
early and provide patients with better medical measures response and thus making patients have a high level of
promptly to reduce patient mortality. viremia. This mechanism leads to the aggravation of the
The typical course of HFRS can be divided into five patient’s condition [18]. Other studies have shown that
different stages: fever, hypotension, oliguria, polyuria, WBC, PLT, platelet distribution width (PDW), and PCT
and recovery. In the hypotension stage, one-third of the can be used as valuable parameters for the severity of
deaths of HFRS patients are related to irreversible shock, HFRS patients, especially the change of PDW on the first
and thrombocytopenia and leukocytosis are the charac- day of hospitalization is related to the survival rate of
teristics of this stage. Thrombocytopenia can cause pete- severe HFRS patients and can be used as a potential pre-
chiae of the skin or mucous membranes, conjunctival dictor [19]. In this study, the increase of WBC in patients
congestion, hematemesis, hemoptysis, hematuria, and with severe HFRS was significantly higher than that in
fatal intracranial hemorrhage [16]. In addition, platelet mild patients, whereas a study showed that comparedNomogram for predicting severity in HFRS patients 951 Figure 3: ROC curve to evaluate the discriminative performance of the nomogram in the training and validation cohorts. (a) Training cohort. (b) Validation cohort. ROC, receiver operating characteristic. Figure 4: Calibration curves for training and validation of the nomogram. (a) Training cohort. (b) Validation cohort. The x-axis represents the nomogram-predicted probability and the y-axis represents the actual probability of severe HFRS. The black solid line represents the predictive performance of the nomogram, and the diagonal gray line represents the ideal nomogram model. HFRS, hemorrhagic fever with renal syndrome. with leukocytosis, thrombocytopenia may better predict be activated by endothelial cells infected by hantavirus the prognosis of severe acute kidney injury (AKI) in and may help to determine the degree of renal patho- patients with acute HTNV infection [20]. Neutrophil acti- logical damage in patients with severe HFRS [21]. In our vation is usually common in bacterial infections. It is study, neutrophil in patients with severe HFRS was also interesting to note that markers of neutrophil activation, higher than that in mild patients, which may further sup- such as myeloperoxidase (MPO), human neutrophil elas- port this view from a clinical perspective. tase (HNE), histone, and interleukin-8 (IL-8), are signifi- Acute renal failure can occur in patients with severe cantly increased in the blood and tissue of patients with HFRS, usually caused by tubulointerstitial and glomer- severe HFRS. These results suggest that neutrophils can ular damage [22]. In addition, the increase of platelet
952 Zheng Yang et al.
Figure 5: The decision curve and clinical impact curve analysis of the nomogram for predicting severe HFRS. (a) The DCA compares the
clinical net benefits of scenarios that predict the probability of severe HFRS: a perfect predictive model (solid grey line), no screening
(horizontal solid black line), and screening based on the nomogram (solid red line). The y-axis measures the net benefit. DCA shows that
using nomogram to predict the risk of severe HFRS can benefit patients if the threshold probability of the patient or doctor is between 0 and 1.
(b) Clinical impact curve of the nomogram plots the number of HFRS patients classified as high risk, and the number of cases classified as
high risk with the event at each risk threshold. HFRS, hemorrhagic fever with renal syndrome; DCA, decision curve analysis.
production and platelet activation may cause intravas- the severity of the patient’s disease, which is consistent with
cular coagulation, the accumulation of inflammatory cells, our findings [29]. The clinical manifestations of HFRS patients
and the release of proinflammatory cytokines in the are diverse, including fever, headache, fatigue, myalgia, back
kidney tissue, which can also lead to kidney damage pain, and so on [30]. In addition to the aforementioned
[23,24]. In this study, renal function impairment indica- symptoms in this study, gastrointestinal symptoms such
tors such as urine protein, urea nitrogen, creatinine, and as nausea, vomiting, diarrhea, abdominal distension, and
cystatin C were significantly increased in severe HFRS respiratory symptoms such as cough and dyspnea were
patients. Previous studies have also confirmed that plasma also manifested. Severe HFRS patients may initially present
cystatin C and alpha-1-microglobulin (A1M) can be used with dry cough, followed by tachycardia, dyspnea, and then
as early and sensitive markers of renal injury in patients may rapidly progress to noncardiogenic pulmonary edema,
with HFRS and can predict AKI [25,26]. The complexity hypotension, and circulatory failure, with a case-fatality rate
adjustment of LASSO regression model is controlled by of about 45% [31].
the parameter λ to avoid overfitting. The larger the λ, the On the basis of LOSSA regression, we finally included
greater the penalty for a linear model with more vari- six predictive indicators: “neutrophils,” “Hb,” “plate-
ables, and a model with fewer variables is finally lets,” “creatinine,” “Ca,” and “dyspnea” to establish a
obtained [11]. So, in the end, only creatinine is included nomogram. The AUC value of the nomogram is greater
in the prediction model. Patients present with acute renal than 0.9 in both the training cohort and the verification
failure are often accompanied by hypocalcemia. Wang cohort, indicating that the predictive model has a high value.
et al. [27] studied the prognostic ability of serum calcium Both the calibration plot and the Hosmer–Lemeshow good-
in patients with severe AKI, and the results showed that ness-of-fit test show that the prediction probability of the
low Ca concentration was an independent predictor of nomogram is in good agreement with the real results. In
all-cause mortality in patients with severe AKI. Similarly, addition, to evaluate the clinical effectiveness of nomogram,
in our study, the average serum calcium concentration in we applied DCA to provide observations of clinical results
HFRS patients was lower than the normal level, espe- based on threshold probability, from which net benefits can
cially in severely ill patients. be derived (net benefit is defined as the proportion of true
In addition, patients with HFRS can also experience positives minus the proportion of false positives, weighted
acute cardiovascular events such as acute myocardial by the relative harm of false-positive and false-negative
infarction and stroke, indicating that the increased levels results) [15,32]. In this study, if the threshold probability of
of myocardial injury indicators such as creatine kinase, the patient or doctor is between 0 and 1, the use of the
CK-MB, and myoglobin can predict the risk of disease nomogram to assess the risk of severe illness in HFRS
progression in patients [28]. Another study showed that hypo- patients can benefit patients. The clinical impact curve
proteinemia in patients with acute HFRS was associated with also intuitively shows that the nomogram has a betterNomogram for predicting severity in HFRS patients 953
overall net benefit within a wide range of threshold CK-MB creatine kinase muscle-brain isoform
probability and affecting the prognosis of patients. PLT platelet
However, our research also has some limitations. λ lambda
First, it is designed to be retrospective, and the inherent PDW platelet distribution width
limitations of this type of research inevitably affect the AKI acute kidney injury
choice of patients. Second, although we collected patient MPO myeloperoxidase
data from different periods to validate the model, it came HNE human neutrophil elastase
from a single center. If possible, we still need cohorts from IL-8 interleukin-8
other research centers to validate the model. Finally, the A1M alpha-1-microglobulin
number of cases in our study is relatively small, which
may weaken the predictive ability of the current model. Acknowledgements: We thank all patients and medical
staff at Jingzhou Central Hospital who were involved in
this study.
5 Conclusion Funding information: This work was supported by Hubei
Province Health and Family Planning Scientific Research
This study developed and verified a novel nomogram for Project (WJ2018H178 to Yi Sun) and the Natural Science
predicting the condition of patients with HFRS, which is Foundation of Hubei Province (2019CFB567 to Yi Sun).
the first nomogram used to predict HFRS. On the basis of
these six laboratory and clinical parameters, clinicians Author contributions: Y.Z., H.Q.M. and S.Y.: conceived
can easily and accurately assess the individual risk of the study idea and performed interpretation, manuscript
HFRS patients, make correct clinical decisions, and pro- writing, and final approval. F.Z.P.: performed data ana-
vide the best treatment for patients. lysis and collection. All authors reviewed and approved
the final version of the manuscript.
Conflict of interest: The authors declare that there is no
Abbreviations conflict of interest.
HFRS hemorrhagic fever with renal syndrome Data availability statement: Due to the finalization of the
LASSO least absolute shrinkage and selection clinical study report, the data analyzed during the cur-
operator rent study are not publicly available, but can be obtained
Hb hemoglobin from the correspondent author under reasonable request.
Ca calcium
AUC area under the receiver operating character-
istic curve
CI confidence interval References
HTNV Hantaan virus
DOBV Dobrava virus [1] Bi Z, Formenty PB, Roth CE. Hantavirus infection: a review and
SEOV Seoul virus global update. J Infect Dev Ctries. 2008;2:3–23.
AMV Amur virus [2] Ma Y, Liu B, Yuan B, Wang J, Yu H, Zhang Y, et al. Sustained
PUUV Puumala virus high level of serum VEGF at convalescent stage contributes to
SOFA sequential organ failure assessment the renal recovery after HTNV infection in patients with
hemorrhagic fever with renal syndrome. Clin Dev Immunol.
Ig immunoglobulin
2012;2012:812386.
PCT procalcitonin [3] Vaheri A, Strandin T, Hepojoki J, Sironen T, Henttonen H,
CRP C-reactive protein Makela S, et al. Uncovering the mysteries of hantavirus
BUN blood urea nitrogen infections. Nat Rev Microbiol. 2013;11:539–50.
SD standard deviation [4] Zhang S, Wang S, Yin W, Liang M, Li J, Zhang Q, et al. Epidemic
characteristics of hemorrhagic fever with renal syndrome in
C-index consistency index
China, 2006-2012. BMC Infect Dis. 2014;14:384.
DCA decision curve analysis [5] Zheng Y, Zhou BY, Wei J, Xu Y, Dong JH, Guan LY, et al.
ROC receiver operating characteristic Persistence of immune responses to vaccine against haemor-
WBC white blood cell rhagic fever with renal syndrome in healthy adults aged954 Zheng Yang et al.
16–60 years: results from an open-label 2-year follow-up [20] Wang M, Wang J, Wang T, Li J, Hui L, Ha X. Thrombocytopenia
study. Infect Dis (Lond). 2018;50:21–6. as a predictor of severe acute kidney injury in patients with
[6] Wang X, Shen W, Qin Y, Ying L, Li H, Lu J, et al. A case-control Hantaan virus infections. PLoS One. 2013;8:e53236.
study on the risk factors for hemorrhagic fever with renal [21] Strandin T, Makela S, Mustonen J, Vaheri A. Neutrophil acti-
syndrome. BMC Infect Dis. 2020;20:103. vation in acute hemorrhagic fever with renal syndrome is
[7] Jonsson CB, Figueiredo LT, Vapalahti O. A global perspective mediated by hantavirus-infected microvascular endothelial
on hantavirus ecology, epidemiology, and disease. Clin cells. Front Immunol. 2018;9:2098.
Microbiol Rev. 2010;23:412–41. [22] Muranyi W, Bahr U, Zeier M, van der Woude FJ. Hantavirus
[8] Yu Z, Zhou N, Li A, Chen J, Chen H, He Z, et al. Performance infection. J Am Soc Nephrol. 2005;16:3669–79.
assessment of the SAPS II and SOFA scoring systems in hanta [23] Hepojoki J, Vaheri A, Strandin T. The fundamental role of
virus hemorrhagic fever with renal syndrome. Int J Infect Dis. endothelial cells in hantavirus pathogenesis. Front Microbiol.
2017;63:88–94. 2014;5:727.
[9] Park SY. Nomogram: an analogue tool to deliver digital [24] Connolly-Andersen AM, Sundberg E, Ahlm C, Hultdin J,
knowledge. J Thorac Cardiovasc Surg. 2018;155:1793. Baudin M, Larsson J, et al. Increased thrombopoiesis and
[10] Bai X, Xu Z. Hemorrhagic fever with renal syndrome. Beijing: platelet activation in hantavirus-infected patients. J Infect Dis.
People’s Medical Publishing House; 2013. 2015;212:1061–9.
[11] Friedman J, Hastie T, Tibshirani R. Regularization paths for [25] Hansson M, Gustafsson R, Jacquet C, Chebaane N, Satchell S,
generalized linear models via coordinate descent. J Stat Softw. Thunberg T, et al. Cystatin C and alpha-1-microglobulin predict
2010;33:1–22. severe acute kidney injury in patients with hemorrhagic fever
[12] Kidd AC, McGettrick M, Tsim S, Halligan DL, Bylesjo M, with renal syndrome. Pathogens. 2020;9:666.
Blyth KG. Survival prediction in mesothelioma using a scalable [26] Ma Y, Li Q, Wang J, Xu Z, Song C, Zhuang R, et al. Cystatin C,
Lasso regression model: instructions for use and initial per- a novel urinary biomarker for sensitive detection of acute
formance using clinical predictors. BMJ Open Respir Res. kidney injury during haemorrhagic fever with renal syndrome.
2018;5:e240. Biomarkers. 2010;15:410–7.
[13] Heyard R, Timsit JF, Held L. Validation of discrete time-to-event [27] Wang B, Li D, Gong Y, Ying B, Cheng B. Association of serum total
prediction models in the presence of competing risks. Biom J. and ionized calcium with all-cause mortality incritically ill patients
2020;62:643–57. with acute kidney injury. Clin Chim Acta. 2019;494:94–9.
[14] Kramer AA, Zimmerman JE. Assessing the calibration of mor- [28] Connolly-Andersen AM, Hammargren E, Whitaker H,
tality benchmarks in critical care: The Hosmer-Lemeshow test Eliasson M, Holmgren L, Klingstrom J, et al. Increased risk of
revisited. Crit Care Med. 2007;35:2052–6. acute myocardial infarction and stroke during hemorrhagic
[15] Vickers AJ, Elkin EB. Decision curve analysis: a novel method fever with renal syndrome: a self-controlled case series study.
for evaluating prediction models. Med Decis Making. Circulation. 2014;129:1295–302.
2006;26:565–74. [29] Kim YO, Yoon SA, Ku YM, Yang CW, Kim YS, Kim SY, et al.
[16] Avsic-Zupanc T, Saksida A, Korva M. Hantavirus infections. Serum albumin level correlates with disease severity in
Clin Microbiol Infect. 2019;21S:e6–e16. patients with hemorrhagic fever with renal syndrome. J Korean
[17] Cosgriff TM, Lee HW, See AF, Parrish DB, Moon JS, Kim DJ, et al. Med Sci. 2003;18:696–700.
Platelet dysfunction contributes to the haemostatic defect in [30] Munir N, Jahangeer M, Hussain S, Mahmood Z, Ashiq M,
haemorrhagic fever with renal syndrome. Trans R Soc Trop Ehsan F, et al. Hantavirus diseases pathophysiology, their
Med Hyg. 1991;85:660–3. diagnostic strategies and therapeutic approaches: a review.
[18] Zapata JC, Cox D, Salvato MS. The role of platelets in the Clin Exp Pharmacol Physiol. 2021;48:20–34.
pathogenesis of viral hemorrhagic fevers. PLoS Negl Trop Dis. [31] de Oliveira SV, Faccini-Martínez Á. Hantavirus infection and
2014;8:e2858. the renal syndrome[M]//tropical nephrology. Cham: Springer;
[19] Fan X, Liu Z, Fu S, Sang J, Deng H, Li F, et al. Platelet distri- 2020. p. 175–92
bution width at first day of hospital admission in patients with [32] Collins GS, Reitsma JB, Altman DG, Moons KG. Transparent
hemorrhagic fever with renal syndrome caused by hantaan reporting of a multivariable prediction model for individual
virus may predict disease severity and critical patients’ sur- prognosis or diagnosis (TRIPOD): the TRIPOD statement. BMJ.
vival. Dis Markers. 2018;2018:9701619. 2015;350:g7594.You can also read