Temporal variation in nutrient requirements of tea (Camellia sinensis) in china based on QUeftS analysis - Nature
←
→
Page content transcription
If your browser does not render page correctly, please read the page content below
www.nature.com/scientificreports

            OPEN           Temporal variation in nutrient
                           requirements of tea (Camellia
                           sinensis) in China based on QUEFTS
                           analysis
                           Sheng Tang1,2, Yanling Liu3, Nan Zheng1, Yu Li3, Qingxu Ma1, Han Xiao1, Xuan Zhou4,
                           Xinpeng Xu5, Taiming Jiang6, Ping He 5 & Lianghuan Wu1,2*
                           Fertilisation datasets collected from field experiments (n = 21) in tea-producing areas from 2016 to
                           2018 were used to build a quantitative evaluation of the fertility of tropical soils (QUEFTS) model to
                           estimate nutrient uptake of tea plants, and to investigate relationships between tea yield and nutrient
                           accumulation. The production of 1000 kg spring tea (based on one bud with two young expanding
                           leaves) required 12.2 kg nitrogen (N), 1.2 kg phosphorus (P), and 3.9 kg potassium (K), and the
                           corresponding internal efficiencies (IEs) for N, P, and K were 82.0, 833.3, and 256.4 kg kg−1. To produce
                           1000 kg summer tea, 9.1 kg N, 0.8 kg P, and 3.1 kg K were required, and the corresponding IEs for N,
                           P, and K were 109.9, 1250.0, and 322.6 kg kg−1. For autumn tea, 8.8 kg N, 1.0 kg P, and 3.2 kg K were
                           required to produce 1000 kg tea, and the corresponding IEs for N, P, and K were 113.6, 1000.0, and
                           312.5 kg kg−1. Field validation experiments performed in 2019 suggested that the QUEFTS model can
                           appropriately estimate nutrient uptake of tea plants at a certain yield and contribute to developing a
                           fertiliser recommendation strategy for tea production.

                           Tea (Camellia sinensis) is the most consumed manufactured drink worldwide, and the plant is widely grown in
                           tropical and subtropical areas, especially in Asian, African, and Latin American countries. It is a perennial crop
                           whose leaves are harvested, and which grows effectively in acidic soil with an optimum pH of 4.0–5.51. In 2013,
                           global tea production reached over 5 million tons, and its consumption continues to increase, particularly in
                           China and India2. The use of nitrogen (N) fertiliser has been shown to improve tea yield and quality, especially for
                           the synthesis of amino acids critical for producing high-quality green tea3,4, and the metabolism of minerals and
                           metabolite products is influenced by phosphate (P) uptake5. Potassium (K) plays vital roles in tea yield and the
                           synthesis of amino acids and caffeine6, and application of K fertiliser can significantly increase water-extractable
                           dry matter7. Tea trees require a high N supply, with the current fertilisation rate ranging from 450 to 1200 kg N
                           ha−1 year−1 8–10, much more than that used in other artificial ecosystems. Recent research suggested that the
                           excessive application of chemical fertiliser in tea gardens in China is a major problem. More than 30% of the tea
                           garden area is over-sprayed, and more than 50% of the tea gardens have high P and K nutrient input, with an
                           unreasonable proportion of nutrients11. Concurrently, massive amounts of N not taken up by plants can be lost to
                           adjacent systems, causing serious environmental problems in tea-planted areas5,7,12,13. Moreover, an unbalanced
                           soil nutrient status can limit plant growth and formation of biochemical ingredients in tea14. Therefore, an opti-
                           mum fertiliser recommendation for tea cultivation should focus on both ensuring high crop yield and reducing
                           environmental risk, so as to maintain sustainable agriculture.

                           1
                            Zhejiang Provincial Key Laboratory of Agricultural Resources and Environment, College of Environmental and
                           Resource Sciences, Zhejiang University, Hangzhou, 310058, China. 2State Key Laboratory of Nutrition Resources
                           Integrated Utilization, Kingenta Ecological Engineering Group Co. Ltd., Linyi, 276000, Shandong, China. 3Institute of
                           Soil and Fertilizer, Guizhou Academy of Agricultural Sciences, Guiyang, 550006, China. 4Institute of Soil and Fertilizer,
                           Hunan Academy of Agricultural Sciences, Changsha, 410125, China. 5Ministry of Agriculture Key Laboratory of
                           Crop Nutrition and Fertilization, Institute of Agricultural Resources and Regional Planning, Chinese Academy of
                           Agricultural Sciences (CAAS), Beijing, 100081, China. 6Institute of Tea research, Guizhou Academy of Agricultural
                           Sciences, Guiyang, 550006, China. *email: finm@zju.edu.cn

Scientific Reports |   (2020) 10:1745 | https://doi.org/10.1038/s41598-020-57809-x                                                                1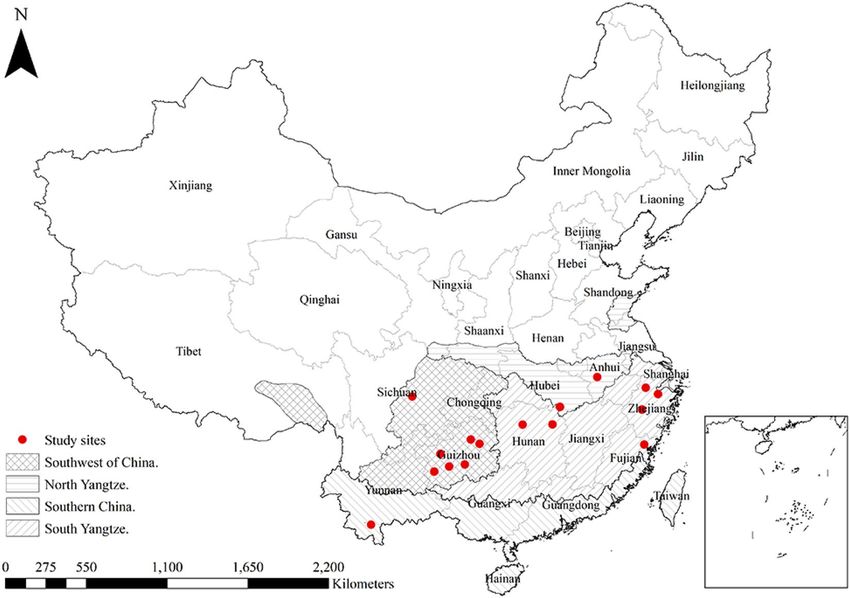
www.nature.com/scientificreports/ www.nature.com/scientificreports
Estimating nutrient requirements of tea plants is essential for rational fertilisation15, but it is difficult to deter-
mine nutrient requirements based on limited experimental data. Because the eco-environment of tea plants varies
substantially in terms of soil type, climate condition, nutrient supply, and tea varieties, interactions between N, P,
and K in tea plantations can be difficult to calculate7. Recently, a quantitative evaluation of the fertility of tropical
soils (QUEFTS) model has been successfully used to estimate the nutrient requirements of various crops, and to
provide recommendations for fertiliser application during their cultivation16,17. This approach has been applied
to maize18–20, rice15,21,22, wheat20,23, and radish24. The QUEFTS model avoids deviation when minimal data are
used to obtain nutrient uptake information to guide fertiliser application for crops19. The model also considers
interactions between uptake rates and crop requirements of N, P, and K25. Therefore, it provides a practical tool
for site-specific nutrient management for major crops18,26. Constants (a) and (d) respectively represent maximum
accumulation (equivalent to the minimum internal nutrient efficiencies, or IEs) and maximum dilution (equiva-
lent to maximum IEs) of N, P, and K as model parameters to evaluate balanced nutrient requirements according
to the model. However, the QUEFTS model has not yet been applied to the cultivation of perennial crops such
as tea.
In China, tea production is classified as spring (late May and earlier), summer (early June to early July), or
autumn (mid-July and later) based on its date of harvest27. The chemical composition and taste quality of tea fluc-
tuate seasonally28. Generally, spring tea has a higher amino acid content and moderate levels of catechins, yield-
ing a heavy, mellow, and brisk flavour29. However, an equivalent-quantification of tea tastes has shown that the
bitterness and astringency are significantly elevated in summer and autumn tea, while its umami flavour declines,
resulting in a sharp drop in price28. After spring tea leaves are harvested, summer and autumn tea leaves remain;
because these tend to have a bitter flavour, they are used to make lower-value products and command a much
lower market price. For example, in Sichuan, the spring tea yield in 2015 was 13.41 million tons, with a value
of 11.9 billion RMB, while the summer and autumn tea yield was 11.43 million tons, with a value of 3.8 billion
RMB30. Improving the flavour and yield of summer and autumn tea crops could increase the annual profitability
of tea production31. As the chemical composition of tea leaves is inextricably linked to nutrient absorption, timely
application of top-dressing fertilisers may improve tea quality and yield32. However, there have been few studies
dealing with nutrient uptakes of summer and autumn tea. We conducted field experiments with different cli-
mates, soil types, and varieties of tea plants over four years (2016–2019). The data collected from the experiments
conducted in the first three years (2016–2018) were used to construct the QUEFTS model, and the data from the
final year (2019) were used to validate the QUEFTS model. We assessed these data using a QUEFTS model to (1)
explore temporal variation in fertiliser requirement among different harvest seasons of tea; (2) evaluate nutrient
uptakes simulated by the QUEFTS model; and (3) recommend optimum fertilisation strategies based on nutrient
uptake and yield over all three tea harvest seasons.
Results
Yield and nutrient uptake. In this study, ‘all tea’ represented the total annual tea including spring, summer,
and autumn tea. The average yield (based on one bud with two young expanding leaves, adjusted to 75% moisture
content) of spring, summer, autumn, and all tea from 2016 to 2018 was 1787 kg ha−1, 2084 kg ha−1, 1583 kg ha−1,
and 8164 kg ha−1, respectively (Supplementary Fig. S1). Summer tea yield was significantly higher than spring and
autumn tea yield (p < 0.05), but there were no significant differences between spring and autumn tea yield. The
average rates of N, P2O5, and K2O application were 321 kg ha−1, 151 kg ha−1, and 137 kg ha−1, respectively.
The average IEs (kg yield per kg nutrient uptake) of N, P, and K for spring tea were 75.7 kg kg−1, 733.2 kg kg−1,
and 239.0 kg kg−1, respectively (Supplementary Table S1), and the corresponding RIEs (reciprocal internal effi-
ciency, nutrient uptake requirement per ton of yield) were 13.6 kg t−1, 1.4 kg t−1, and 4.4 kg t−1 with an N:P:K ratio
of 9.4:1:3.0. For summer tea, the average IEs of N, P, and K were 101.7 kg kg−1, 1134.1 kg kg−1, and 264.8 kg kg−1,
respectively, with RIEs of 10.0 kg t−1, 0.9 kg t−1, and 4.0 kg t−1 with a ratio of 10.9:1:4.3. For autumn tea, the
average IEs of N, P, and K were 106.0 kg kg−1, 1063.9 kg kg−1, and 274.8 kg kg−1, respectively (Supplementary
Table S1), with RIEs of 9.7 kg t−1, 0.99 kg t−1, and 3.9 kg t−1 with a ratio of 9.8:1:3.9. The IEs of N, P, and K
for the three seasons were significantly different (p < 0.05). The IEs of N and K were ranked as autumn > sum-
mer > spring, while P was ranked as summer > autumn > spring. Correspondingly, the RIEs of N and K in spring
tea were significantly higher than those of summer and autumn tea. In addition, there were significant differ-
ences between the RIEs of P for spring, summer, and autumn tea (p < 0.05), and the RIEs could be ranked as
spring > autumn > summer.
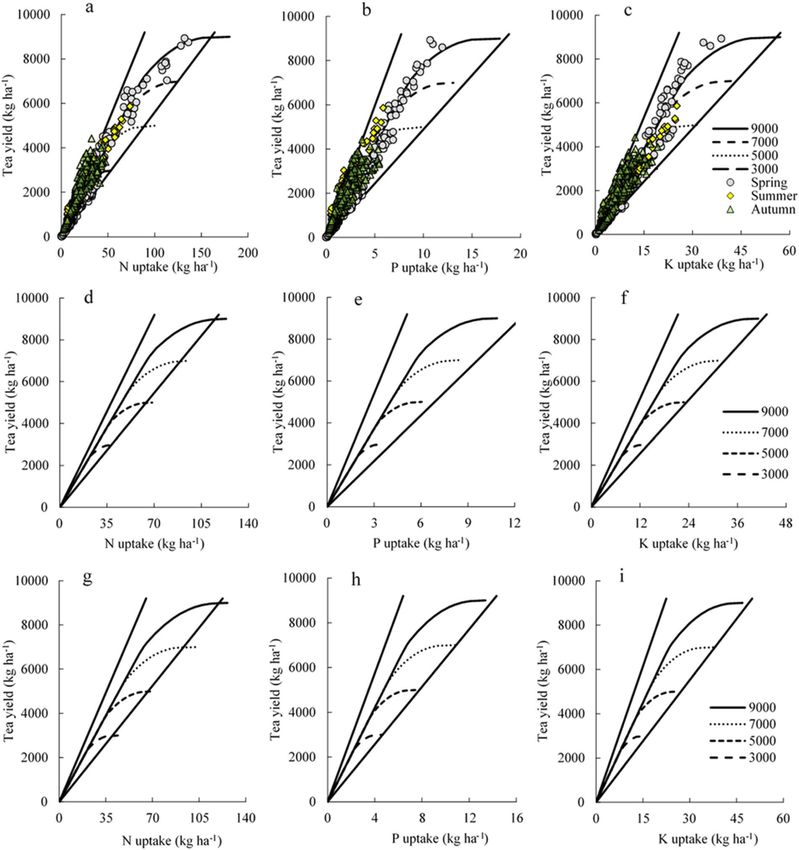
Calculating the parameters for running the QUEFTS models. In Supplementary Table S2, (a) and
(d) were calculated by excluding the upper and lower 2.5 (Set I), 5.0 (Set II), and 7.5 (Set III) percentiles of all IE
data of the combined datasets. We estimated the nutrient requirements for spring, summer, autumn, and all tea
for a specific targeted tea yield based on Sets I-III (Fig. 1). The nutrient requirements simulated by the three series
were similar for spring, summer, autumn, and all tea (Fig. 1, Supplementary Table S2). Set I was selected to run
the QUEFTS model to estimate the relationship between tea yield and nutrient requirements, as it contained a
larger range of variability than did Sets II and III. The values of (a) in N, P, and K requirements were 56, 489, and
161 kg kg−1 for spring tea; 78, 727, and 213 kg kg−1 for summer tea; 75, 642, and 184 kg kg−1 for autumn tea; and
74, 764, and 205 kg kg−1 for all tea, respectively. The values of (d) for N, P, and K were 103, 1193, and 356 kg kg−1
for spring tea; 131, 1798, and 431 kg kg−1 for summer tea; 141, 1436, and 409 kg kg−1 for autumn tea; and 123,
1404, and 344 kg kg−1 for all tea.
Temporal variations in nutrient requirements. Based on the above results, Set I was used to estimate
the nutrient requirements for spring, summer, and autumn tea at the yield potential (maximum attainable yield)
of 5000 kg ha−1 (Fig. 2). At this yield potential, there were significant differences in N requirements between
Scientific Reports | (2020) 10:1745 | https://doi.org/10.1038/s41598-020-57809-x 2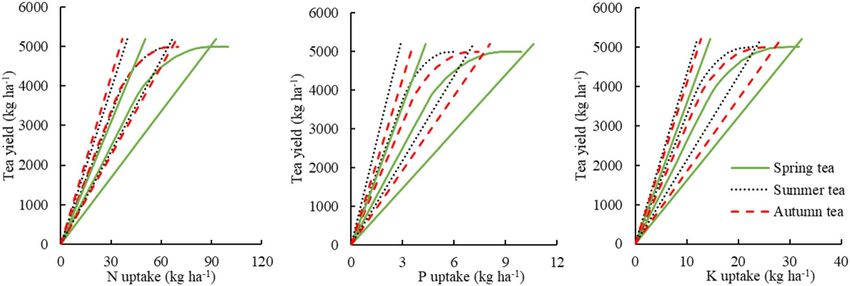
www.nature.com/scientificreports/                                                               www.nature.com/scientificreports

                           Figure 1. The nutrient requirements of spring (a–c), summer (d–f), and autumn (g–i) tea simulated by
                           QUEFTS models based on Set I, Set II, and Set III, respectively. The yield potential of tea was set at 5000 kg ha−1.
                           YD, YA, and YU are the maximum dilution, maximum accumulation, and balanced uptake of N, P, and K in tea,
                           respectively.

                           spring tea and other teas (p < 0.01). In other words, to attain the same targeted tea yield in the range of 0 to
                           5000 kg ha−1, spring tea required more N than did summer or autumn tea. However, no significant differences
                           in N requirement were observed between summer and autumn tea (p > 0.05). For P and K uptake, there were
                           significant differences across all seasons (p < 0.05). In general, to produce the same tea yield, seasonal P and K
                           requirements could be ranked as summer < autumn < spring. At this yield potential, spring tea required relatively
                           more N, P, and K (Fig. 2). To produce 1000 kg tea, spring tea required 12.2 kg N, 1.2 kg P, and 3.9 kg K in a ratio of
                           10.1:1:3.2; summer tea required 9.1 kg N, 0.8 kg P, and 3.1 kg K in a ratio of 11.3:1:3.8; and autumn tea required
                           8.8 kg N, 1.0 kg P, and 3.2 kg K in a ratio of 9.2:1:3.4 (Supplementary Fig. S2).

                           Evaluating the relationship between yield and nutrient uptake. The tea yield potentials were set
                           as ranging from 3000 to 9000 kg ha−1 for spring, summer, and autumn tea, based on the yields recorded in field
                           experiments (Fig. 3). The points distributed in Fig. 3 were recorded in all field experiments. N uptake for sum-
                           mer and autumn tea was almost distributed above the N absorption curve of spring tea (Fig. 3a), indicating that
                           summer and autumn tea require less N than does spring tea to achieve the same yield. Most of the observations
                           of P and K uptake for summer and autumn tea were distributed under the uptake curve of spring tea (Fig. 3b,c).
                           Therefore, P and K requirements of summer and autumn tea were less than those of spring tea to achieve the same

Scientific Reports |   (2020) 10:1745 | https://doi.org/10.1038/s41598-020-57809-x                                                             3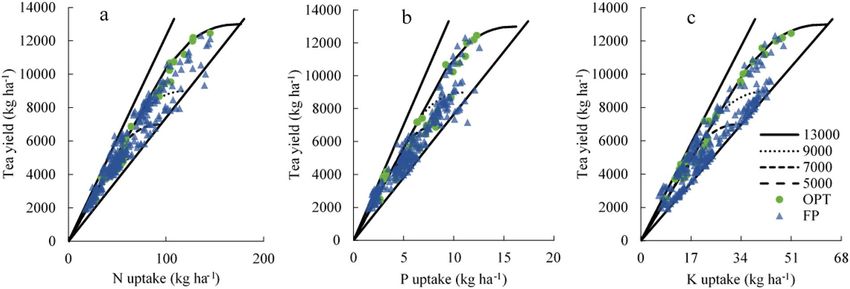
www.nature.com/scientificreports/                                                               www.nature.com/scientificreports

                           Figure 2. At the tea yield of 5000 kg ha−1, the nutrient requirements of spring, summer, and autumn tea
                           estimated by QUEFTS based on Set I.

                           yield. The yield potential of all tea was set as ranging from 5000 to 13,000 kg ha−1 (Fig. 4). Most optimum practice
                           treatment (OPT) practices were distributed around the nutrient uptake curve (Fig. 4). This indicated that the fer-
                           tiliser application of OPT was rational for tea plant requirements. However, farmers’ practices (FP) approaches to
                           fertilisation were distributed above and below the nutrient uptake curve, indicating that the fertiliser application
                           of FP was not in balance.

                           QUEFTS model validation. The datasets collected from OPT experiments conducted in 2019 were used to
                           validate the QUEFTS model (Fig. 5). The tea yield and nutrient uptake data from 2019 are listed in Supplementary
                           Table S3. OPT approaches and QUEFTS predictions were distributed around the 1:1 line. The parameters of root
                           mean square error (RMSE) and normalised RMSE (n-RMSE) were used to evaluate the QUEFTS model and
                           the deviation between the observations and simulated data. The RMSE values of N, P, and K were 2.5, 0.3, and
                           1.0 kg ha−1, respectively, and the n-RMSE values of N, P, and K were 22.9%, 33.5%, and 28.3%. The relatively lower
                           values of RMSE and n-RMSE indicated that the data simulated by QUEFTS were similar to the observations.
                           There were no significant differences between observed and simulated data (p > 0.05). This indicates that the
                           nutrient uptake of tea plants can be appropriately predicted by QUEFTS at a targeted yield.

                           Discussion
                           In this study, we chose one bud with two young expanding leaves as our harvest standard, which is commonly
                           used among the main tea production regions. In addition to this standard, there are harvest standards such as
                           one bud with three expanding leaves, one bud and so on. Therefore, the QUEFTS model is not able to adapt for
                           all the harvest standards. The yield potential of tea was set at 5000 kg ha−1 as an example, as the yield potential has
                           no effect on sensitivity testing23,33. The N requirement was about 10 times the P requirement and 2.5 times the K
                           requirement, according to the RIE ratio. Previous studies have found that the RIE ratio of N, P, and K simulated
                           using QUEFTS was 5.08:1:0.97 for wheat, 4.65:1:3.88 for maize, and 4.98:1:5.54 for rice in China15,19,23. As a typi-
                           cal leaf-based crop, tea plants require sufficient macronutrients to meet the demands of leaf growth and synthesis
                           of metabolites34. Tea also has a comparatively greater N requirement relative to other crops35,36.
                                The RIEs simulated by our QUEFTS models were constant only when the targeted yield was below 60–70%
                           of the yield potential, and increased as the targeted yield exceeded this threshold, as has been found in previous
                           studies15,19,22,23. However, the RIEs of N, P, and K for different seasons predicted by QUEFTS differed from those
                           reported in previous studies. The RIEs of N, P, and K estimated by Pan32 were 14.3, 0.7, and 4.3 kg t−1, respec-
                           tively; the values for N and K estimated by Pan were similar to the mean measured nutrient uptake of N and K for
                           spring tea, at 13.6 and 4.4, respectively. The differences in RIE could be due to the tea variety cultivated, climate
                           condition, harvest standard, fertiliser application regime, and other factors37–40. A previous survey found that
                           the annual N application rate ranged from 0 to 2600 kg ha−1 with an average of 553 kg ha−1 in typical tea fields of
                           China41. For our field experiments, the average N, P2O5, and K2O application rates appeared rational in terms of
                           the data collected from various fertilisation situations including FP, OPT, and nutrient omission plots.
                                The above results suggest that spring tea has a greater nutrient requirement than do summer or autumn tea
                           (Fig. 2, Supplementary Fig. S2). Correspondingly, the N, P, and K content in spring tea leaves were greater than
                           those in summer and autumn tea leaves, and the RIEs of summer tea were similar to those of autumn tea. The
                           relatively higher nutrient content in new shoots of spring tea, in comparison with those in the shoots of summer
                           and autumn tea, results in greater concentrations of metabolites such as amino acids and polyphenols, which
                           benefit tea quality2,27. Spring provides comparably favourable weather, with steadily rising temperature and high
                           humidity, which are suitable for new shoot growth in tea42,43. In addition, long-term nutrient accumulation in
                           tea plants from late autumn to early spring contributes to sufficient nutrient storage. The nutrients supplied by
                           basal application of fertilisers as well as top dressing before spring tea harvest also possibly play a role in greater
                           nutrient uptake by tea plants during spring. By contrast, warmer and drier weather in summer and autumn is less
                           favourable for the growth of new shoots43, and the nutrients in tea plants decrease after spring tea harvest27,32.
                           These factors account for the relatively higher RIEs of spring tea. Moreover, the nutrient uptake of tea fluctuates

Scientific Reports |   (2020) 10:1745 | https://doi.org/10.1038/s41598-020-57809-x                                                              4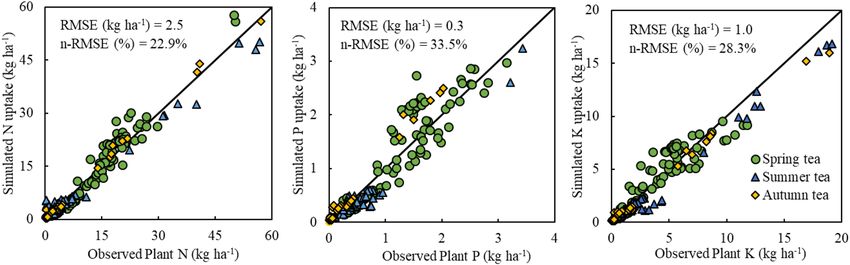
www.nature.com/scientificreports/                                                              www.nature.com/scientificreports

                           Figure 3. Nutrient requirements of spring (a–c), summer (d–f), and autumn (g–i) tea of different tea yield
                           potentials simulated by QUEFTS model.

                           with seasons, affecting the chemistry and quality of tea leaves28,43,44. Wang et al.43 found that daily average tem-
                           perature, relative humidity, and precipitation had significant effects on the synthesis of tea polyphenols. The tea
                           polyphenols (TP) to total free amino acids (AA) ratio, which is inversely correlated with the quality of green tea,
                           increases in summer because of higher temperatures45,46. Based on meteorological data and statistical data of tea
                           yield and quality, Jin et al.47,48 found a close relationship between climate and tea yield and quality.
                               Tea quality is affected by both fertiliser management and regional climate43, and the relatively higher TP/AA
                           ratio in summer and autumn tea results in a sharp price decrease27. Rational fertilisation to improve the yield
                           and quality of tea could increase farmers’ income. The ratio of RIE of N for spring, summer, and autumn tea was
                           approximately 3:2:2, the same as in the top-dressing application of N fertiliser. P and K removed from tea shoots
                           should be returned by fertiliser application to avoid soil nutrient depletion as well as minimise environmental risk.
                               Fertilisation evaluation can also be combined with a QUEFTS model15,23. Our comparison indicated that
                           nutrient provision was insufficient when practice datasets were distributed above the nutrient uptake curve and
                           close to the upper boundary, and our model predicted a potentially greater tea yield under increased nutrient
                           application. In contrast, if the datasets are distributed below the nutrient uptake curve and close to the lower
                           boundary, it might indicate excessive nutrient provision, with tea yield being limited by other growth factors

Scientific Reports |   (2020) 10:1745 | https://doi.org/10.1038/s41598-020-57809-x                                                            5
www.nature.com/scientificreports/ www.nature.com/scientificreports
Figure 4. N (a), P (b), and K (c) requirements for all tea with the tea yield potentials set as ranging from 5000 to
13000 kg ha−1. The datasets shown were collected from all experiments from 2016 to 2018.
Figure 5. Relationships between the observed and simulated N, P, and K uptake for spring, summer, and
autumn tea. The observed nutrient uptake is from tea expert-based fertiliser recommendations in Anhui, Hubei,
Hunan, Zhejiang, Fujian, Yunnan, Sichuan, and Guizhou provinces, and the simulated nutrient uptake was
derived from the QUEFTS model.
(Fig. 4). Most of the observations of N and P uptake of FP indicated luxury absorption, suggesting that N and P
fertiliser application were excessive in FP of tea planting. In addition, K fertiliser application in FP was excessive
in some areas and deficient in others. These observations are consistent with the findings of previous studies11,14.
Overall, these results suggest that fertiliser application can be recommended based on the nutrient uptake of tea
plants.
Conclusions
In summary, we found significant differences in N, P, and K uptake across spring, summer, and autumn tea
(p < 0.05), and the nutrient uptake characteristics varied across harvest seasons. In order to attain a targeted yield
(based on one bud with two young expanding leaves), the nutrient requirements of spring tea were relatively
greater than those in summer or autumn, but there were no significant differences between summer and autumn
tea in this regard (p > 0.05). The fertilisation practice datasets collected in our study represented a wide range of
tea-growing environments in China, with different values of (a) and (d) for spring, summer, and autumn tea. Field
validation indicated that the QUEFTS model could be used to estimate N, P, and K uptake of tea plants at a precise
targeted yield. Regardless of yield potential, the model predicted a linear increase in tea yield if there is a balanced
nutrient uptake until the yield reaches about 60–70% of the yield potential. Thus, fertiliser recommendation for
tea using a QUEFTS models could help to avoid excessive fertilisation and reduce its effect on the environment
and improve tea yield.
Materials and Methods
Experimental sites. In China, regional tea cultivation varies based on climate, tea variety, and produc-
tion history. Accordingly, tea-producing areas can be divided into four regions: the Southwest of China (SW),
South Yangtze (SY), North Yangtze (NY), and Southern China (SC) (Fig. 6). Field experiments were conducted
in Anhui, Hubei (NY), Yunnan (SC), Sichuan, Guizhou (SW), Hunan, Zhejiang, and Fujian (SY) provinces from
2016 to 2019. SW is the oldest tea-growing area in China, where several different varieties have originated. Annual
Scientific Reports | (2020) 10:1745 | https://doi.org/10.1038/s41598-020-57809-x 6www.nature.com/scientificreports/ www.nature.com/scientificreports
Figure 6. Distribution of experimental sites for model construction and validation (n = 21) for tea in four
production regions of China. Points overlapped among the sites (two in Anhui, three in Hubei, three in Fujian)
due to relatively small distance.
Fertiliser application rate (kg ha−1)
Case
Province (n) N P2O5 K2O
Guizhou 6 330 (324–340)b 69 (57–133) 94 (68–139)
Sichuan 1 300 100 100
Yunnan 1 450 90 120
Anhui 2 360 120 120
Hunan 2 281 (273–288) 93 (90–96) 129 (102–156)
Zhejiang 3 359 (340–383) 92 (69–120) 104 (79–137)
Hubei 3 309 (263–339) 84 (68–100) 76 (72–80)
145
Fujian 3 338 (324–351) 115 (103–127)
(136–154)
Table 1. Rates of fertiliser application for optimum practice treatment (OPT). aData in parentheses indicates
the range of fertiliser application.
precipitation in SW, which ranges from 900 to 1400 mm, is relatively ample49. The soil type in SW is mainly haplic
acrisol. The soil types in SC and SY are mainly rhodic ferralsol and haplic acrisol. SY is dominated by a subtropical
monsoon climate and is the most prolific of the tea-growing areas, accounting for 2/3 of the total tea production
in China. We conducted three field experiments in Zhejiang province. Tea yield and output in Zhejiang province
are highest in SY30. SC is the most arable area for tea, with rich hydrothermal resources. NY, the most northerly
area, has mainly haplic luvisol soil and experiences large circadian temperature fluctuations, yielding a high-qual-
ity green tea50. A large number of soil types and climate conditions characterise these plots that represent a variety
of soil chemical profiles (Supplementary Tables S4 and S5).
Data sources. Data on different nutrient management practices including FP, OPT, and omission plots for
N (OPT-N), P (OPT-P), and K (OPT-K) were gathered and collated. OPT fertilisation was as recommended by
local tea experts (Table 1). The plot sizes of each experiment ranged from 30 to 54 m2 with a randomised block
design. Local popular varieties of tea were planted in each field, and weeds, pests, and diseases were controlled.
The tea plants were cultivated with optimised management practices including irrigation, trimming, and other
established approaches. Tea plants were harvested as one bud with two young expanding leaves. The deactivation
of tea enzymes was carried out in a microwave oven after harvest, and the tea was then oven-dried at 70 °C for
Scientific Reports | (2020) 10:1745 | https://doi.org/10.1038/s41598-020-57809-x 7www.nature.com/scientificreports/ www.nature.com/scientificreports
36 h. Then, the dry samples that were sieved through a 250 µm screen were digested with H2SO4-H2O2, and the
Kjeldahl method, vanadium molybdate yellow colorimetry, and flame photometry were used to estimate N, P,
and K concentrations, respectively50. We collected data on nutrient uptake and yield from tea field experiments
in order to build the QUEFTS model.
Model development. The QUEFTS model was first proposed by Janssen et al.25 to estimate maize yield in
tropical areas without fertilisation. Smaling and Janssen51 improved the model to evaluate balanced N, P, and
K uptake for a certain targeted yield after analysing substantial experimental data. In our study, we used the
QUEFTS model to calculate the N, P, and K requirement for spring, summer, and autumn tea for a target yield.
The core parameters of the QUEFTS model are the maximum accumulation (a) and maximum dilution (d) for tea
plants. The values of (a) and (d) were calculated by excluding the upper and lower 2.5th, 5.0th, or 7.5th percentile
of all measured IE data. Model-building followed four steps:
(1). Identifying the relationship between soil chemical characteristics and soil nutrient supplements based on
abundant data collected from field experiments. The main indexes of soil chemical characteristics are N, P,
K, and organic matter.
(2). Establishing a relationship between soil nutrient supply and plant nutrient uptake. The relationship
between the potential supply of nutrients and actual absorption is based on the following considerations:
First, the nutrients are paired for comparison. Therefore, the relationship between the actual uptake and
the potential supply of N was calculated twice, resulting in two estimates of the actual uptake of each of the
three nutrients. According to the law of the minimum, the lower of the two estimates is considered to be
more realistic.
(3). Determining the relationship between the actual absorption of N, P, and K and the range of yield based on
data collected from fertilised and unfertilised crops.
(4). Combining the production ranges into one production estimate. The process of combining the production
ranges calculated in step 3 consists of two parts. The yield ranges are first combined in pairs (N and P, N
and K, and P and K), and secondly, the average yield of nutrients is calculated. This average is an estimate
of the final prediction of the actual yield51.
Field validation. The field validation experiments performed in 2019 were conducted at the same sites as
the field experiments performed to construct the QUEFTS model during 2016–2018 (n = 21; Fig. 6). The rates of
fertiliser application were the same as those shown in Table 1. Urea was used as N fertiliser, with 30% applied one
month before spring tea harvest, 20% applied between spring harvest and summer harvest, 20% applied between
summer and autumn harvest, and 30% applied after autumn harvest. P and K fertiliser were applied as superphos-
phate and potassium sulfate, respectively, in a single treatment after autumn harvest. All fertilisers were applied
in ditches between two rows of tea plants at a depth of 15 cm, then covered with soil12. The value of the RMSE and
n-RMSE were used to evaluate the QUEFTS model and the deviation between the measured and simulated data.
RMSE and n-RMSE were calculated using the following formula:
2
∑ ni =1(si − mi)
RMSE =
n
RMSE
Normalised RMSE =
m
where si and mi represent simulated and measured values, respectively; n represents the number of measures; and
represents the mean data measurement52.
Statistical analysis. One-way analysis of variance (ANOVA) was performed using Statistical Package for
Social Sciences (SPSS) version 20.0. Probability values (P) less than 0.05 were considered significant.
Data availability
All data generated or analysed during this study are included in the manuscript file and its Supplementary
Information files.
Received: 31 July 2019; Accepted: 31 December 2019;
Published: xx xx xxxx
References
1. Kamau, D. M., Spiertz, J. H. J. & Oenema, O. Carbon and nutrient stocks of tea plantations differing in age, genotype and plant
population density. Plant Soil 307, 29–39 (2008).
2. Qiao, C. et al. Synthetic nitrogen fertilizers alter the soil chemistry, production and quality of tea. A meta-analysis. Agron. Sustain.
Dev. 38, 1–10 (2018).
3. Ruan, J., Haerdter, R. & Gerendas, J. Impact of nitrogen supply on carbon/nitrogen allocation: a case study on amino acids and
catechins in green tea [Camellia sinensis (L.) O. Kuntze] plants. Plant Biol (Stuttg). 12, 724–734 (2010).
4. Mudau, F. N., Soundy, P. & du Toit, E. S. Nitrogen, Phosphorus, and Potassium Nutrition Increases Growth and Total Polyphenol
Concentrations of Bush Tea in a Shaded Nursery Environment. Horttechnology 17, 107–110 (2007).
5. Ding, Z., Jia, S., Wang, Y., Xiao, J. & Zhang, Y. Phosphate stresses affect ionome and metabolome in tea plants. Plant Physiol. Biochem.
120, 30–39 (2017).
Scientific Reports | (2020) 10:1745 | https://doi.org/10.1038/s41598-020-57809-x 8www.nature.com/scientificreports/ www.nature.com/scientificreports
6. Sharma, D. K. & Sharma, K. L. Effect of nitrogen and potash application on yield and quality of china hybrid tea (Camellia sinensis)
grown in Kangra valley of Himachal Pradesh. Indian J. Agric. Sci. 68, 307–309 (1998).
7. Ruan, J., Ma, L. & Shi, Y. Potassium management in tea plantations: Its uptake by field plants, status in soils, and efficacy on yields
and quality of teas in China. J. Plant Nutr. Soil Sc. 176, 450–459 (2013).
8. Tokuda, S.-i & Hayatsu, M. Nitrous oxide emission potential of 21 acidic tea field soils in Japan. Soil Sci. Plant Nutr. 47, 637–642 (2001).
9. Marotte, H. et al. Nitrous oxide flux from a tea field amended with a large amount of nitrogen fertilizer and soil environmental
factors controlling the flux. Soil Sci. Plant Nutr. 50, 365–374 (2004).
10. Li, S. et al. Rates of soil acidification in tea plantations and possible causes. Agr. Ecosyst. Environ. 233, 60–66 (2016).
11. Ni, K. et al. Fertilization status and reduction potential in tea gardens of China. J. Plant Nutr. Soil Sc. 25, 421–432 (2019).
12. Yang, X. et al. Effects of long-term nitrogen application on soil acidification and solution chemistry of a tea plantation in China.
Agric., Ecosyst. Environ. 252, 74–82 (2018).
13. Zhu, T. et al. Tea plantation destroys soil retention of NO3− and increases N2O emissions in subtropical China. Soil Biol. Biochem.
73, 106–114 (2014).
14. Ma, L. et al. Status and Suggestions of Tea Garden Fertilization on Main Green Tea-Producing Counties in Zhejiang Province. J. Tea
Sci. 33, 74–84 (2013).
15. Xu, X. et al. Estimating nutrient uptake requirements for rice in China. Field Crops Res. 180, 37–45 (2015).
16. Chuan, L. et al. Establishing a scientific basis for fertilizer recommendations for wheat in China: Yield response and agronomic
efficiency. Field Crops Res. 140, 1–8 (2013).
17. Xu, X. et al. Fertilizer recommendation for maize in China based on yield response and agronomic efficiency. Field Crops Res. 157,
27–34 (2014).
18. Setiyono, T. D., Walters, D. T., Cassman, K. G., Witt, C. & Dobermann, A. Estimating maize nutrient uptake requirements. Field
Crops Res. 118, 158–168 (2010).
19. Xu, X. et al. Nutrient requirements for maize in China based on QUEFTS analysis. Field Crops Res. 150, 115–125 (2013).
20. Liu, M., Yu, Z., Liu, Y. & Konijn, N. T. Fertilizer requirements for wheat and maize in China: the QUEFTS approach. Nutr. Cycl.
Agroecosys. 74, 245–258 (2006).
21. Das, D. K., Maiti, D. & Pathak, H. Site-specific nutrient management in rice in Eastern India using a modeling approach. Nutr. Cycl.
Agroecosys. 83, 85–94 (2009).
22. Buresh, R. J., Pampolino, M. F. & Witt, C. Field-specific potassium and phosphorus balances and fertilizer requirements for irrigated
rice-based cropping systems. Plant Soil 335, 35–64 (2010).
23. Chuan, L. et al. Estimating nutrient uptake requirements for wheat in China. Field Crops Res. 146, 96–104 (2013).
24. Zhang, J. et al. Estimating nutrient uptake requirements for radish in China based on QUEFTS model. Sci Rep. 9, https://doi.
org/10.1038/s41598-019-48149-6 (2019).
25. Janssen, B. H. et al. A system for quantitative evaluation of the fertility of tropical soils (QUEFTS). Geoderma 46, 299–318 (1990).
26. Khurana, H. S., Phillips, S. B., Dobermann, A., Sidhu, A. S. & Peng, S. Performance of Site-Specific Nutrient Management for
Irrigated, Transplanted Rice in Northwest India. Agron. J. 99, 1436–1447 (2007).
27. Xu, W., Song, Q., Li, D. & Wan, X. Discrimination of the production season of Chinese green tea by chemical analysis in combination
with supervised pattern recognition. J. Agric. Food Chem. 60, 7064–7070 (2012).
28. Dai, W. et al. Nontargeted Analysis Using Ultraperformance Liquid Chromatography-Quadrupole Time-of-Flight Mass
Spectrometry Uncovers the Effects of Harvest Season on the Metabolites and Taste Quality of Tea (Camellia sinensis L.). J. Agric.
Food Chem. 63, 9869–9878 (2015).
29. Chen, Y. et al. Variation in catechin contents in relation to quality of ‘Huang Zhi Xiang’ Oolong tea (Camellia sinensis) at various
growing altitudes and seasons. Food Chem. 119, 648–652 (2010).
30. Yang, J., Guan, X. & Li, J. China Tea Industry Development Report. (Social Sciences Archive Publishing House, 2015).
31. Pan, W., Zhao, J., Chen, Q. & Yuan, L. In situ monitoring of total polyphenols content during tea extract oxidation using a portable
spectroscopy system with variables selection algorithms. RSC Adv. 5, 60876–60883 (2015).
32. Pan, G. Technical guidelines for the production of famous green tea in summer and autumn. Tea 29, 63–65 (2003).
33. Liu, X. Y. et al. Yield Gaps, Indigenous Nutrient Supply, and Nutrient Use Efficiency of Wheat in China. Agron. J. 103, 1452–1463 (2011).
34. Sun, L., Liu, Y., Wu, L. & Liao, H. Comprehensive Analysis Revealed the Close Relationship between N/P/K Status and Secondary
Metabolites in Tea Leaves. ACS Omega 4, 176–184 (2019).
35. Maghanga, J. K., Kituyi, J. L., Kisinyo, P. O. & Ng’etich, W. K. Impact of Nitrogen Fertilizer Applications on Surface Water Nitrate
Levels within a Kenyan Tea Plantation. J. Chem-Ny. 2013, 1–4 (2013).
36. Watanabe, I. Effect of Nitrogen Fertilizer Application at Different Stages on the Quality of Green Tea. Soil Sci. Plant Nutr. 41,
763–768 (1995).
37. Owuor, P. O. & Odhiambo, H. O. Response of some black tea quality parameters to nitrogen fertiliser rates and plucking frequencies.
J. Sci. Food Agr. 66, 555–561 (1994).
38. Cloughley, J. B. Effects of harvesting policy and nitrogen application rates on the production of tea in Central Africa.II.Quality and
total value of the crop. Exp. Agric. 19, 47–54 (1983).
39. Zhang, Z., Shi, Y., Ma, L., Yi, X. & Ruan, J. Effect of Different Plucking Standards and Nitrogen Application Levels on the Spring
Shoot Yield, Quality-related Chemical Compounds and N Utilization Efficiency of Tea Plants. J. Tea Sci. 5, 506–514 (2014).
40. Su, Y., Liao, W., Ding, Y., Wang, H. & Xia, X. Effects of nitrogen fertilization on yield and quality of tea. J. Plant Nutr. Soil Sc. 17,
1430–1436 (2011).
41. Han, W. & Li, Q. Present situation on the fertilization in tea gardens and the technique of high-efficient fertilization in no-pollution
tea gardens. China Tea 24, 29–31 (2002).
42. Gulati, A. & Ravindranath, S. D. Seasonal Variations in Quality of Kangra Tea ( Camellia sinensis(L) O Kuntze) in Himachal
Pradesh. J. Sci. Food Agr. 71, 231–236 (1996).
43. Wang, L. Y. et al. Seasonal climate effects on flavanols and purine alkaloids of tea (Camellia sinensis L.). Eur. Food Res. Technol. 233,
1049–1055 (2011).
44. Hilton, P. J., Palmer-Jones, R. & Ellis, R. T. Effects of season and nitrogen fertiliser upon the flavanol composition and tea making
quality of fresh shoots of tea (Camellia sinensis L.) in Central Africa. J. Sci. Food Agr. 24, 819–826 (1973).
45. Li, X. et al. Brassinosteroids Improve Quality of Summer Tea (Camellia sinensis L.) by Balancing Biosynthesis of Polyphenols and
Amino Acids. Front. Plant Sci. 7, 1–9 (2016).
46. Liang, Y., Lu, J. & Shang, S. Effect of Gibberellins on Chemical Composition and Quality of Tea (Camellia sinensisL). J. Sci. Food Agr.
72, 411–414 (1996).
47. Jin, Z. F. et al. Assessment on climatic potential productivity of tea in Zhejiang Province. Chinese J. Ecol. 35, 1791–1798 (2016).
48. Jin, Z. F. et al. Evaluation of tea climate quality grade in Zhejiang. Chinese J. Ecol. 34, 1456–1463 (2015).
49. Wan, x. c. Chinese Tea Spectrum. (China Forestry Press, 2007).
50. Bao, S. Soil and Agricultural Chemistry Analysis (China Agricultural Press, 2000).
51. Smaling, E. M. A. & Janssen, B. H. Calibrating of QUEFTS, a model predicting nutrient uptake and yields from chemical soil fertilty
indices. Geoderma 59, 21–44 (1993).
52. Liu, H. L. et al. Using the DSSAT-CERES-Maize model to simulate crop yield and nitrogen cycling in fields under long-term
continuous maize production. Nutr. Cycl. Agroecosys. 89, 313–328 (2010).
Scientific Reports | (2020) 10:1745 | https://doi.org/10.1038/s41598-020-57809-x 9www.nature.com/scientificreports/ www.nature.com/scientificreports
Acknowledgements
This research was financed by the National Key Research and Development Program of China (No.
2016YFD0200102) and National Natural Science Foundation of China (Nos 31572194 and 31872180).
Author contributions
Sheng Tang, Lianghuan Wu, Ping He and Xinpeng Xu conceived and designed the study, analysed data, and
drafted the manuscript; Yanling Liu, Yu Li, Han Xiao, Nan Zheng and Taiming Jiang collected the data; Qingxu
Ma and Xuan Zhou revised the manuscript.
Competing interests
The authors declare no competing interests.
Additional information
Supplementary information is available for this paper at https://doi.org/10.1038/s41598-020-57809-x.
Correspondence and requests for materials should be addressed to L.W.
Reprints and permissions information is available at www.nature.com/reprints.
Publisher’s note Springer Nature remains neutral with regard to jurisdictional claims in published maps and
institutional affiliations.
Open Access This article is licensed under a Creative Commons Attribution 4.0 International
License, which permits use, sharing, adaptation, distribution and reproduction in any medium or
format, as long as you give appropriate credit to the original author(s) and the source, provide a link to the Cre-
ative Commons license, and indicate if changes were made. The images or other third party material in this
article are included in the article’s Creative Commons license, unless indicated otherwise in a credit line to the
material. If material is not included in the article’s Creative Commons license and your intended use is not per-
mitted by statutory regulation or exceeds the permitted use, you will need to obtain permission directly from the
copyright holder. To view a copy of this license, visit http://creativecommons.org/licenses/by/4.0/.
© The Author(s) 2020
Scientific Reports | (2020) 10:1745 | https://doi.org/10.1038/s41598-020-57809-x 10You can also read


