Evaluation of japonica rice (Oryza sativa L.) varieties and their improvement in terms of stability, yield and cooking quality by pure-line ...
←
→
Page content transcription
If your browser does not render page correctly, please read the page content below
R ESEARCH      ARTICLE                                                             ScienceAsia 46 (2020): 157–168
doi: 10.2306/scienceasia1513-1874.2020.029

Evaluation of japonica rice (Oryza sativa L.) varieties
and their improvement in terms of stability, yield and
cooking quality by pure-line selection in Thailand
Pawat Nakwilaia , Sulaiman Cheabuc , Possawat Narumona , Chatree Saensukb , Siwaret Arikita,b ,
Chanate Malumponga,b,∗
a
     Department of Agronomy, Faculty of Agriculture at Kamphaeng Saen, Kasetsart University,
     Nakhon Pathom 73140 Thailand
b
     Rice Science Center & Rice Gene Discovery Unit, Kasetsart University, Nakhon Pathom 73140 Thailand
c
     Faculty of Agriculture, Princess of Naradhiwas University, Narathiwat 96000 Thailand
∗
    Corresponding author, e-mail: agrcnm@ku.ac.th
                                                                                                 Received 3 Aug 2019
                                                                                                 Accepted 3 Apr 2020

ABSTRACT: Many companies in Thailand have encouraged farmers, especially those in the northern regions, to
cultivate DOA1 and DOA2 japonica rice varieties. Recently, the agronomic traits of DOA1 and DOA2 were altered,
affecting yield and cooking quality. Thus, the objectives of this study were to evaluate the agronomic traits and cooking
quality of DOA1 and DOA2 and those of exotic japonica varieties in different locations, including the Kamphaeng Saen
and Phan districts (WS16). DOA2 was improved by pure-line selection. The results showed that the Phan district was
better suited to grow japonica varieties than the Kamphaeng Saen district and that DOA2 produced high grain yields in
both locations. Furthermore, DOA2 was selected by the pure-line method in four generations, after which five candidate
lines, Tana1 to Tana5, were selected for yield trials. The results of yield trials in three seasons (WS17, DS17/18, WS18)
confirmed that Tana1 showed high performance in terms of its agronomic traits and grain yield. Moreover, the cooking
quality of Tana1 was the same as that of DOA2. When the genotypes of the five candidate lines were compared with
those of DOA1, DOA2, Akitakomachi, Sasanishiki and Koshihikari, it was found that Tana1 slightly differed from DOA2.
In addition, the japonica varieties introduced from Japan were also different from DOA1 and DOA2. These results
suggest that the genotype of DOA2 changed greatly from that of the original variety, Akitakomachi. Thus, pure-line
selection can slightly alter the genetics of DOA2, improve agronomic traits and increase grain yields.

KEYWORDS: japonica rice, pure-line selection, agronomic traits, cooking quality

INTRODUCTION                                                  was approximately 60 000 tons, with a 750 kg/rai
                                                              average yield [2]. Chiang Rai, the northern province
The market demand for Japanese rice is relatively             in Thailand, has become a major production base
high in Thailand because chains and branches of               for japonica rice because of its climate and locally
Japanese restaurants have expanded throughout the             developed strains of japonica varieties that have
country as a whole. In fact, restaurant chains from           qualities similar to those grown in Japan [3].
Japan have increasingly invested in Thailand to                    Japanese people prefer cooked japonica rice for
open Japanese restaurants at a growth rate of 10–             its sticky and chewy texture and dislike rice with a
15% per year. As a result, Thailand is the fifth in the       dry and crisp texture. In fact, strong stickiness is
world in terms of the number of Japanese restau-              one of the most important features [4–6]. Thus,
rants [1]. In 2014, thirteen private entrepreneurs in         high eating quality is one of the major reasons
Thailand encouraged farmers to cultivate japonica             why Koshihikari (KH) japonica rice is preferred by
rice via contract farming systems. Ten of these               Japanese consumers [7]. KH, a premium short-grain
entrepreneurs were members of the Association of              rice cultivar, was first bred in Japan in 1956. It
Japanese Rice Producers in Thailand. The total area           became the cultivar with the largest cultivation area
of cultivated paddy fields under the association was          in 1979 [7]. The eating quality of KH is superior to
approximately 80 000 rais (12 800 ha), which in-              that of Nipponbare, a standard rice, and the appear-
volved 6000 contract farmers. The total paddy yield           ance, scent, flavor, stickiness and overall evaluation

                                                                                                        www.scienceasia.org
158                                                                                        ScienceAsia 46 (2020)

of the former are better. Moreover, cooked KH             in Thailand. Moreover, at present, the DOA1 and
rice is much softer than Nipponbare rice [5]. In          DOA2 plants growing on farmland in Chiang Rai
addition, the three top-ranked cultivars after KH are     were off-type approximately 13% and 4%, respec-
Hitomebore, Hinohikari and Akitakomachi (AK).             tively [18]. Moreover, comparisons of genetic back-
Among the other cultivars, Sasanishiki (SN), which        grounds by ddRAD sequencing analysis of these cul-
is soft but not as sticky, is preferred for box lunches   tivars showed that they had already changed from
and sushi and is in demand by the food industry and       their original cultivars (SN and AK). Thus, after
consumers [8].                                            25 years, the DOA1 and DOA2 varieties were not
     Experiments with japonica rice in Thailand have      completely SN and AK, respectively. Pure-line selec-
been conducted for more than 50 years by re-              tion involves three steps through which a variety can
searchers at the Chiang Rai Rice Research Center          evolve: the selection of individual plants from a crop
(CRC), Department of Rice. In 1964, the CRC               comprising a local variety or mixed populations, the
introduced japonica rice germplasm from Japan for         visual evaluation of individual plant progeny and
experiments involving different rice varieties. There     the establishment of yield trials [19].
are many varieties such as AK, KH, Norin and SN [9].           This study had two objectives. The first was
The CRC has continuously experimented to cultivate        to evaluate the yield and cooking quality of DOA1
Japanese rice at research stations and in farmlands,      and DOA2 and compare them with those of the
especially in northern provinces such as Chiang           other four japonica varieties derived from Japan
Rai, Chiang Mai and Lamphun [10]. In 1995,                at two locations: the Phan district in Chiang Rai
the Department of Agriculture (DOA) confirmed             (the main area of japonica rice production) and the
that two japonica rice varieties, SN and AK, could        Kamphaeng Saen (KPS) district in Nakhon Pathom
produce high yields and good cooking quality in           (central part of Thailand). The second was to
northern Thailand. Afterward, these varieties, in-        improve the uniformity, yield and cooking quality
cluding DOA1 (SN) and DOA2 (AK), were registered          of DOA2 by pure-line selection and to analyze the
as certified varieties and were recommended for           genetic relationship by the genotype-by-sequencing
expansion and cultivation [9]. The DOA1 and DOA2          (GBS) method to compare the newly selected lines
varieties have a quality similar to that of KH and        with the original DOA2.
were the first varieties sold as consumer grade in
Japanese markets [10]. Moreover, they are suitable        MATERIALS AND METHODS
for growth in areas where the average temperature         Experiment 1: Evaluation of japonica varieties
is approximately 18–25 °C, and their resistance to
hot weather is stronger than that of other japonica       Plant materials and growth conditions
rice varieties [3]. These two varieties can grow          This experiment was conducted in the wet season
during both wet season (Jul–Oct) and dry season           from Jun–Oct 2016 at two locations: Tana Grain
(Jan–May) in northern provinces in Thailand. The          Polish, Ltd., Phan district, Chiang Rai province
yields of DOA2 and DOA1 from the CRI experiment           (19°350 09.400 N, 99°440 42.700 E, 413 m above sea
were 5168 kg/ha and 4637 kg/ha, respectively [3].         level) and the rice research field at Kasetsart Uni-
     Global warming increased the average mini-           versity, Kamphaeng Saen district, Nakhon Pathom
mum temperature by approximately 1.1 °C from              province (14°020 13.500 N, 99°570 45.000 E, 10 m above
1966 to 2001 [11], and the temperature during             sea). The four japonica varieties introduced from
the ripening period has also increased by 1.1 °C          Japan included Koshihikari (KH), Akitakomachi
above that in previous years [12]. Therefore,             (AK), Sasanishiki (SN) and Saino Kagayaki (SK).
a heat-induced decline in the quality of japon-           DOA1 and DOA2 were derived from foundation
ica rice has been observed in many prefectures            seed of the CRC; these varieties were seeded in
in Japan [12, 13]. Thus, conditions such as high          the field nursery. After 30 days, the rice seedlings
temperature and low humidity tend to prevent this         were transplanted to a research paddy field set up
rice from achieving the same quality as it does in        in a randomized complete block design (RCBD)
Japan [14, 15]. In Thailand, the annual mean tem-         with three replications. The plot size in each treat-
perature is projected to rise by 4.8 °C by 2100 [16].     ment was as 1 × 4 m (4 rows) with a spacing of
Thailand experiences an average daytime temper-           25 × 25 cm. The soil nutrients and other properties
ature of up to 40 °C, especially during the month         were analyzed by the Department of Soil Science,
of Apr [17]. These temperatures may severely              Faculty of Agriculture at Kamphaeng Saen, Kaset-
affect the yield and grain quality of japonica rice       sart University (Table S1). Additionally, 18-22-0

www.scienceasia.org
ScienceAsia 46 (2020)                                                                                      159

fertilizer was applied at a rate of 87.5 g/subplot      (dry season; Dec 2017–Apr 2018), the remaining
at 15 days after planting, and 46-0-0 fertilizer was    progeny were planted for preliminary yield trials,
applied at 25 g/subplot at the booting stage (65        and inferior progeny and those with low yield were
days). Other management practices were in ac-           rejected. Finally, in the sixth season (wet season;
cordance with conventional high-yield cultivation       Jul–Oct 2018), the five candidate lines derived from
approaches [3]. Weather data, including air tem-        previous selections were grown for yield trials with
perature, relative humidity and the amount of rain      DOA1, DOA2, AK, SN and KH at the research field
in the field, were measured every 10 min from           of Tana Grain Co. Ltd., Chiang Rai province. The
planting until harvest by a data logger (WatchDog       experiment for the yield trial was conducted as a
2700 Series Micro Stations, Spectrum Technologies,      RCBD with three replications. The plot size for
Inc., USA).                                             each treatment was 2.5 × 2.5 m (6.25 m2 ) with a
     Plants in the two middle rows of each subplot      spacing of 25 × 25 cm. The agronomic trait, cooking
from each replicate at both locations were harvested    quality trait (only in the sixth season) and sensory
to determine their agronomic traits including days      test (only in the sixth season) data were collected.
until flowering (DF), plant height (PH), tillers/-      The weather data, including the air temperature,
plant (T/P), panicles/plant (P/P), panicle length       relative humidity and amount of rain in the field,
(PL), seed set (SS), 100-grain weight (GW) and          were measured every 10 min in each season from
grain yield/plant (Gy/Pl). Furthermore, the cook-       planting until harvest by a data logger (WatchDog
ing quality traits included grain size (GS), grain      2000 Series Micro Stations, Spectrum Technologies,
elongation (GE), an alkaline test (AT) and amylose      Inc., USA).
content (AC). These traits were evaluated only at
the Phan district location.                             Agronomic traits
                                                        Grain yield/plot (Gy/Po) was determined by per
Experiment 2: Pure-line selection of DOA2               harvested area of 6.25 m2 . The grain yield moisture
Plant materials and growth conditions                   was adjusted to 14%. The agronomic traits (i.e.,
                                                        DF, PH, PL and T/P) and the components of grain
The DOA2 seed germplasm was collected from three        yield (i.e., P/P, SS and GW) were measured in plants
sources: the CRC; Department of Rice, Tana Grain        within 4 m2 (excluding guard rows). Fifty percent
Co. Ltd. and the Rice Science Center; Kasetsart         of representative plants were randomly selected to
University. AK, SN and KH were used as control          calculate the T/P and P/P. After threshing, the grains
varieties in each generation of the pure-line proce-    were weighed to obtain the 100-grain weight, and
dure. The rice management practices were the same       this step was repeated three times. SS was defined
as those in Experiment 1.                               as the number of filled grains per total number of
                                                        spikelets.
Pure-line selection scheme
The pure-line selection scheme is shown in Fig. S1.     Cooking quality traits
In the first season, sixty DOA2 seeds from each         Grain size (GS): The grain width and grain length of
source (total of one hundred and eighty seeds)          both paddy rice and milled rice in the validation ex-
were grown at the rice research field of Tana Grain     periment were measured using ten seeds with three
Co. Ltd., Phan district, Chiang Rai province from       replications. A two-decimal-point digital Vernier
Mar–Jun 2016. The seeds were grown in a nursery         caliper was used.
field. After 30 days, the seedlings were transplanted       Alkaline test (AT): The alkalinity was deter-
at a spacing of 30 × 30 cm. The rice plants that        mined using an alkali digestion test [20]. Three
had agronomic traits closest to those of DOA2 or        replicates in each treatment of ten whole-milled
AK and that yielded greater than 85% seed set on        grains without cracks were selected and placed in
the panicles were selected and harvested separately     a Petri dish. Ten milliliters of 1.7% (0.3035 M)
for growth in the next season. In the second to         KOH solution was then added. The samples were
third season (Jul 2016–May 2017), the selected          arranged to provide enough space between kernels
panicles were grown as panicles/rows at a spacing       to allow for spreading. The Petri dishes were sub-
of 25 × 25 cm. The off-type plants in each row          sequently covered and incubated for 24 h at room
were removed, and selected plants were harvested        temperature (approximately 32 °C). The starchy en-
individually. Additionally, in the fourth season        dosperm was rated visually based on a seven-point
(wet season; May–Sep 2017) and the fifth season         numerical spreading scale in accordance with the

                                                                                              www.scienceasia.org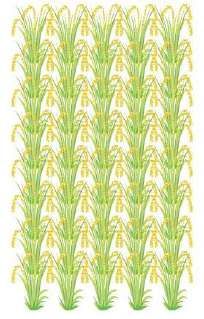
160                                                                                      ScienceAsia 46 (2020)

standard evaluation system for rice [21]. Ac-           was evaluated by sniffing the aroma of cooked rice
cording to the AT score, the GT of rice grains          before putting it into the mouth. The appearance
could be classified into four groups: high (1–2),       (color, glossiness and integrity) was evaluated by
high-intermediate (3), intermediate (4–5) and low       the surface characteristics of the cooked rice, and
(6–7) [22].                                             the stickiness was evaluated during the chewing
     Amylose content (AC): One hundred milligrams       stage as the degree to which the sample adhered
of each milled rice was added to 1 ml of ethanol        to the molar teeth. The softness was assessed by
(95%) and 9 ml of 1 N NaOH. Each sample was             compressing the sample between molars and evalu-
heated for 10 min in a boiling water bath to gela-      ating the force required to bite through the sample
tinize the starch. The samples were then cooled         during the first few bites. The stickiness, elasticity
and transferred to a 100 ml volumetric flask. Five      and hardness could be evaluated at the same time.
milliliters of starch solution and 1 ml of 1 N acetic   Taste was a comprehensive evaluation of sweetness
acid were then added. Two milliliters of iodine         and fragrance and included the purity and durability
solution (0.2% resublimed iodine in 2% potassium        of taste. A comprehensive assessment was scored
iodide) was added, and the volume was brought to        based on the above factors. Using a relative scale,
100 ml. The flask was subsequently shaken and           the panelists gave a score for each attribute com-
allowed to stand for 20 min. The absorbance at          pared with the reference sample attributes, and the
620 nm was measured against the blank using ultra-      overall quality was the sum of the scores for all the
spectrophotometer (Spectramax model Plus 384            attributes. The total scores were then analyzed via
components, USA); and a calibration standard amy-       F -tests as part of a CRD experiment.
lose curve by plotting absorbance was prepared.
The total amylose content of each sample was deter-
mined via a previously calibrated standard amylose      Phylogenetic analysis based on GBS
curve [23].                                             Genomic DNA was prepared from a single plant of
     Grain elongation ratio (GE): Ten whole-milled      each candidate line and controlled varieties. DNA
grains and ten cooked grains were sampled with          from leaves was isolated according to the DNeasy
three replications. The grains were measured by a       Plant Mini Kit (Qiagen) protocol. The DNA quantity
digital Vernier caliper. The grain elongation ratio     was tested by a NanoDrop 8000, and the concen-
was subsequently calculated by means of ten whole-      tration exceeded 50 ng/µl. The DNA was then
milled grain lengths divided by the mean of ten         sequenced on an Illumina HiSeq X by Novogene AIT,
cooked grain lengths.                                   Singapore. The Bowtie 2 program was subsequently
                                                        used to align the nucleotides [24], and the GATK
Evaluation of sensory qualities of cooked rice          program was used to analyze single-nucleotide poly-
The rice cooking procedure was in accordance with       morphisms (SNPs) in each sample [25]. Finally, the
the standard method for the sensory evaluation          nucleotide sequences from the candidate lines and
of rice cooking and eating qualities at Tana Grain      controlled varieties were used to construct a phylo-
Co. Ltd. Whole-milled rice samples (500 g, 14%          genetic tree using the MEGA X program (Molecular
moisture content) were washed three times with          Evolutionary Genetics Analysis version 10.0, www.
distilled water. The distilled water was added to       megasoftware.net).
the rice samples to give an optimum rice:water
weight ratio (1.0:1.4). The rice was cooked using
the preset cooking setting of a rice cooker (Sharp      Statistical Analysis
model KS-ZT18, Thailand). Before cooking, the           All the data were analyzed using the R program
rice samples were soaked at room temperature for        version 3.6.1 [26] to test the significance of the
30 min and then boiled for 35 min; this was followed    results in terms of agronomic traits and cooking
by a 15 min holding period at the warming setting.      quality. The means were separated using Tukey’s
Seven panelists (two women and five men) who had        Least Significant Difference test at p < 0.05. If
been well trained in the principles and concepts of     there was no significant difference among the ex-
descriptive sensory analysis for at least three years   periments for a given parameter, then the values
participated in the evaluation of sensory qualities.    from all of the experiments for that parameter were
The sensory items included the smell (score 1–5),       used to obtain the mean and standard error. In
appearance (score 1–5), stickiness (score 1–5), soft-   addition, the AMMI model was used to analyze the
ness (score 1–5) and taste (score 1–5). The smell       G × E interactions [27].

www.scienceasia.org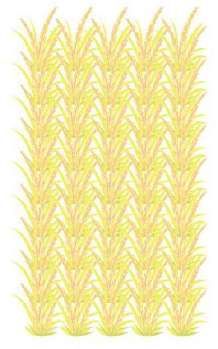
ScienceAsia 46 (2020)                                                                                        161

RESULTS                                                   Grain quality
Experiment 1                                              The grain quality of the six japonica varieties was
                                                          evaluated only in Phan. The GS of paddy grain
Weather data: The daytime temperatures (6.00–
                                                          (2.6–3.1 mm in width and 7.1–7.5 mm in length),
18.00 h) from Jun–Oct 2016 in KPS and Phan were
                                                          milled grain (2.5–3.0 mm in width and 4.7–5.0 mm
33.1 °C and 31.0 °C, respectively, and the nighttime
                                                          in length) and the AC (17.8–22.3%) among the six
temperatures (18.00–6.00 h) in KPS and Phan were
                                                          varieties were significant (Table 2). On the other
27.6 °C and 25.5 °C, respectively. Thus, the air
                                                          hand, the AC of KH was the lowest (17.8%) while
temperature in KPS was higher than that in Phan
                                                          that of the other varieties was not significant (21.1–
during both day and night by approximately 2.0 °C
                                                          22.3%). In addition, the GE (1.8–2.0 mm) and
(Table S2). The daytime relative humidity levels
                                                          AT (score 5–6) were not significant among the six
in KPS were slightly different from those in Phan
                                                          varieties (Table 2).
(57.9% RH in KPS and 56.2% RH in Phan). How-
                                                               Thus, in Experiment 1, the agronomic traits
ever, the nighttime relative humidity in Phan was
                                                          and yield in Phan, Chiang Rai province, which is
higher than that in KPS (89.7% RH in KPS and
                                                          the main japonica rice growing area in Thailand,
93.1% RH in Phan) (Table S2). The average rainfall
                                                          were good compared with those in KPS. In addition,
during five months in this experiment in KPS was
                                                          when the grain quality of the six varieties in Phan
lower than that in Phan (141.64 mm in KPS and
                                                          were compared, the results showed that there was
304.06 mm in Phan) (Table S2).
                                                          no significant difference across all varieties, and
                                                          these were compared with the standards of japonica
Yield and agronomic traits                                rice [28]. Moreover, DOA2 produced the highest
                                                          yields both in the Phan and KPS locations, especially
Table 1 summarizes the computed F -values for the         in Phan. Thus, DOA2 was used for the pure-line
differences in yield and agronomic traits. The yield      selection in Experiment 2 to increase the uniformity
and agronomic traits were significantly different         and yield.
between the two locations except tillers/plant and
panicles/plant. In addition, the F -values of the yield   Experiment 2
and agronomic traits were also different among
varieties in each location.                               Sixty seeds from each germplasm source (total of
     The yield and agronomics traits of all varieties     one hundred and eighty seeds) were grown at the
in Phan were higher than those in KPS, especially         rice research field of Tana Grain Co. Ltd., Phan,
the Gy/Pl, DF, PH and SS. DOA2 in Phan and KPS            Chiang Rai province, from Mar–Jun 2016. Five
presented the highest Gy/Pl (64.6 g and 41.5 g, re-       candidate lines were ultimately derived after 4th-
spectively) and SS (95.4% and 82.4%, respectively)        generation pure-line selection; plants from these
(Table 1). On the other hand, the lowest yield in         lines were subsequently grown as part of yield trials
Phan occurred for AK while the lowest yield in KPS        together with DOA1, DOA2, AK, SN and KH in the
occurred for SK, which produced yields of 24.2 g          fourth season (WS17; May–Sept 2017), fifth season
and 22.7 g, respectively (Table 1).                       (DS17/18; Dec 2017–Apr 2018) and sixth season
     The mean DF of the six japonica varieties in         (WS18; Jul–Nov 2018).
Phan was 78 days while it was 69 days in KPS
(Table 1). Thus, the DF of all varieties except SN        Weather data
and DOA2 in Phan was greater than that in KPS.            The weather data during the three seasons of the
The greatest difference in DF between Phan and KPS        yield trials are shown in Table S3. The mean
occurred for SK (difference of 19 days) while the DF      daytime and nighttime temperatures during the
for SN was not different between the two locations.       growing season in WS17 (28.70/25.07 °C) and
     The PH showed the same result as the days until      WS18 (28.06/24.17 °C) were higher than those
flowering. The plant heights of the six japonica          in DS17/18 (25.80/20.45 °C). The mean relative
varieties in Phan (86.6 cm) were higher than those        humidity in the daytime of WS17, DS17/18 and
in KPS (73.7 cm). The shortest variety was SK             WS18 was 79.43, 73.74 and 81.68% RH, respec-
in both Phan (71.9 cm) and KPS (54.9 cm) while            tively while the relative humidity at night was
the tallest varieties in both locations were DOA1         91.31, 90.47 and 93.55% RH, respectively. In ad-
(97.3 cm in Phan and 89.2 cm in KPS) and DOA2             dition, the average rainfall was highest in WS17
(90.6 cm in Phan and 88.4 cm in KPS) (Table 1).           (304.9 mm), followed by WS18 (198.2 mm) and

                                                                                                www.scienceasia.org
162 ScienceAsia 46 (2020)
Table 1 The agronomic traits of 6 japonica varieties between KPS and Phan district in the WS16.
DF (day) PH (cm) T/P P/P
Variety
KPS Phan KPS Phan KPS Phan KPS Phan
SK 66eB 85aA 54.9dB 71.9dA 18bcA 18bA 18abA 17bA
KH 68cB 85aA 65.2cB 81.4bcdA 18bcA 18bA 19aA 17bB
SN 72bA 70bA 76.5bB 80.8bcdA 17cA 18bA 18abA 16cB
AK 67cdB 85aB 67.9cB 74.6cdA 15dA 15cA 18abA 14dB
DOA1 66deB 70bA 89.2aB 97.3aA 17cA 17bcA 15cB 17bA
DOA2 76aA 70bB 88.4aB 90.6abA 20aA 20aA 13dB 19aA
Mean 69 78 73.7 86.6 18 18 18 17
F -test ** ** ** ** ** ** * **
% CV 1.07 0.85 4.04 7.74 1.57 2.64 13.4 3.00
PL (cm) SS (%) GW (g) Gy/Pl (g)
Variety
KPS Phan KPS Phan KPS Phan KPS Phan
SK 14.57dB 34.3aA 60.5dB 94.7abA 2.57bcB 2.69cA 22.7eB 26.4dA
KH 14.82dB 21.0dA 66.3bB 94.3abA 2.52cB 2.78bA 25.6dB 33.7dA
SN 17.00cB 25.2bA 65.0bcB 89.2cA 2.43dB 2.61dA 35.9bcA 33.8cB
AK 16.05cB 20.2dA 64.6cdB 93.7abA 2.62bB 2.73bcA 33.9cA 24.2dB
DOA1 20.33bB 23.6cA 82.0aB 91.2bA 2.22eB 3.05aA 33.1cB 56.5bA
DOA2 19.94bB 26.5bA 82.4aB 95.4aA 2.97aA 2.98aA 41.5aB 64.6aA
Mean 18.60 25.3 70.1 93.1 2.55 2.80 32.1 45.5
F -test ** ** ** ** ** ** ** **
% CV 3.72 2.87 4.21 2.26 1.57 1.51 3.54 4.10
Different small letters in the column (agronomic traits) are significantly different at p < 0.05. Different capital
letters in each row (genotype) between locations are significantly different at p < 0.05.
Table 2 Grain and cooking quality of 6 japonica varieties in Phan, Chiang Rai province in the WS16.
Paddy GS (mm) Milled GS (mm) GE AT AC
Variety
Width Length Width Length (mm) (score 1–6) (%)
SK 2.9b 7.3c 2.5c 4.8c 1.9 5 21.5a
KH 2.8c 7.1d 2.5c 4.7d 1.9 5 17.8b
SN 2.6c 7.1d 2.5c 4.8c 2.0 6 22.3a
AK 2.9b 7.5a 2.6b 5.0a 1.8 5 21.1a
DOA1 2.9b 7.4b 3.0a 4.9b 1.8 5 22.2a
DOA2 3.1a 7.5a 3.0a 4.9b 1.8 5 21.9a
Mean 2.9 7.3 2.7 4.8 1.9 5.2 21.1
F -test ** ** ** ** ns ns **
% CV 1.02 2.09 1.04 3.05 1.05 1.11 2.69
Different small letters in the column (grain and cooking quality) are significantly different at p < 0.05.
DS17/18 (62.9 mm). (Table S3). These results suggest that rice plants
in the WS accumulated heat units faster than they
Yield and agronomic traits did in the DS and that the rice plants changed
from the vegetative to reproductive stage earlier in
The yield and agronomic traits of the five candidate
the WS than in the DS. In addition, with respect
lines as well as the controlled varieties in the three
to the DF among the five candidate lines, the DF
seasons are shown in Table 3. In addition, the
values for DOA1 and DOA2 were not significant
plant type, paddy grains and milled grains of these
in WS17 (73–74 days), but there were significant
line/varieties are shown in Fig. 1. The yield and
differences in WS18 (74–79 days). However, the DF
agronomic traits were significantly different among
of AK, SN and KH, which are derived from Japan,
the seasons (p < 0.05). In addition, except for
was shorter (66–67 days in WS17, 75–83 days in
those of T/P and P/P, the F -values of the yield
DS17/18 and 66–67 days in WS18) than that of the
and agronomic traits were also different among the
other lines/varieties (Table 3).
lines/varieties in each season. The mean DF in
With respect to the PH of the five candidate
DS17/18 (90 days) was longer than that of WS17
lines, the values for DOA1 and DOA2 in the three
(72 days) and WS18 (73 days) (Table 3). This
seasons (89–118 cm in WS17, 101–111 cm in
finding showed that the air temperature in the DS
DS17/18 and 104–108 cm in WS18) were greater
(winter season) was lower than that in the WS
www.scienceasia.orgScienceAsia 46 (2020) 163
Table 3 The agronomic traits of 5 candidate lines compared with control varieties in Phan, Chiang Rai province in the
WS17, DS17/18 and WS18.
Trait Season Tana1 Tana2 Tana3 Tana4 Tana5 DOA1 DOA2 AK SS KH Mean F -test % CV
DF WS17 74abB 75aB 75aB 74abB 75aB 75aB 73bB 67cB 67cB 66cB 72 ** 1.57
(day) DS17/18 97aA 96aA 95aA 96aA 95aA 97aA 95aA 77cA 83bA 75cA 90 ** 2.46
bcB abB abB abcB abcB abcB cB dB dB dB
WS18 74 77 77 76 79 76 72 66 67 67 73 ** 3.56
Mean 81.7 81.7 82.3 82.0 83.0 82.7 80.0 70.0 72.3 69.3 78.7
PH WS17 108.5aB 109.5aA 117.7aA 102.9bB 101.4bB 89.3dB 107.3aA 74.6eB 94.5cA 66.2fC 97.2 ** 2.66
(cm) DS17/18 111.4aA 106.4bB 104.3bcC 102.8bcB 102.7bcB 103.3bcA 101.2cdB 97.2dA 92.5eA 91.5eA 101.3 ** 2.44
WS18 107.0aB 107.8aB 109.4aB 108.9aA 104.1aA 104.9aA 106.9aA 72.4cB 94.5bA 79.6cB 99.5 ** 5.17
Mean 108.9 107.9 110.5 104.9 102.7 99.2 105.1 81.8 93.8 79.1 99.4
T/P WS17 23 22 20 24 22 23 23 24 24 23 23 ns 10.36
DS17/18 25 22 23 23 22 22 19 21 20 21 22 ns 8.76
WS18 22 21 21 23 23 22 28 17 19 25 22 ns 21.99
Mean 23.4 21.8 21.4 23.1 22.4 22.4 23.4 20.8 20.8 23.0 22.2
P/P WS17 14 12 12 14 12 13 12 14 14 13 13 ns 19.18
DS17/18 14 12 11 13 12 13 12 14 14 13 13 ns 17.52
WS18 14 12 12 13 13 13 13 14 14 13 13 ns 7.34
Mean 14.0 12.0 11.7 13.3 12.3 13.0 12.3 14.0 14.0 13.0 13.0
PL WS17 22.8aA 21.9abA 22.1aA 21.7abA 21.1bA 21.6bA 21.8abB 17.4cA 16.9cB 17.2cA 20.5 ** 3.26
(cm) DS17/18 20.3bB 22.9abA 22.7aA 20.9abA 20.6abB 20.9abA 21.6abB 17.8cA 19.8bA 15.0cB 20.2 ** 6.87
WS18 20.6bcB 21.5abA 21.2abcA 21.4abcA 22.2abA 21.5abcA 24.6aA 18.0cA 19.8bcA 18.8bcA 20.9 * 10.62
Mean 21.2 22.1 22.0 21.3 21.3 21.3 22.7 17.7 18.8 17.0 20.7
SS WS17 98.0aA 94.2cB 96.0bA 94.0cA 94.3cA 95.8bA 93.6cdA 96.9abA 88.7eB 92.3dA 94.4 ** 0.89
(%) DS17/18 94.3abcB 96.0aA 95.6abA 95.9aA 95.3abcA 96.1aA 93.2cA 93.9abcB 93.4bcA 67.2dC 92.1 ** 1.46
WS18 84.6abC 82.3abC 84.9abB 91.0aB 89.8abB 85.6abB 87.8abB 85.0abC 86.7abB 78.9bB 85.7 ** 8.04
Mean 92.3 90.8 92.1 93.6 93.1 92.5 91.5 91.9 89.6 79.5 90.7
GW WS17 3.20aA 2.97abcA 3.23aA 2.80abcA 3.10aA 3.03abA 3.23aA 2.53cA 2.63bcA 2.90abcB 2.96 * 8.99
(g) DS17/18 3.18aA 3.04abA 3.20aA 2.72bcB 2.96abA 3.01abA 3.25aA 2.57cA 2.58cB 3.21aA 2.97 ** 6.96
WS18 2.95aB 2.88aB 2.89aB 2.96aA 2.89aB 3.00aA 2.96aB 2.57bA 2.53bB 2.51bC 2.81 ** 2.81
Mean 3.11 2.96 3.11 2.83 2.98 3.01 3.15 2.56 2.58 2.87 2.92
Gy/Po WS17 7.28aA 5.30bB 5.20bA 4.31cB 5.15bB 5.19bA 5.15bB 3.81cA 3.69cB 4.00cB 4.91 ** 9.46
(kg) DS17/18 7.54aA 6.06bcA 5.34cdA 5.67cdA 7.20abA 5.45cdA 5.40cdA 3.73eA 4.47deA 5.27cdA 5.61 ** 13.80
WS18 5.00aB 5.30aB 5.27aA 4.66aB 5.35aB 4.73aB 5.40aA 3.09bB 3.04bC 3.13bC 4.50 ** 10.01
Mean 6.61 5.55 5.27 4.88 5.90 5.12 5.32 3.54 3.73 4.13 5.01
Different small letters in each row (agronomic traits) are significantly different at p < 0.05. Different capital letters
in the column (genotype) between seasons are significantly different at p < 0.05.
Fig. 1 Plant type, paddy grains, milled grains and alkaline test results of five candidate lines as well as DOA1, DOA2,
AK, SN and KH in DS17/18.
www.scienceasia.org164 ScienceAsia 46 (2020)
than those of AK, SN and KH (66–94 cm in WS17, explains why the five candidate lines were specific to
91–97 cm in DS17/18 and 72–94 cm in WS18). the season. Tana1 showed good adaptation in WS17
These results may be affected by the relatively low while Tana5 and Tana2 showed good adaptation in
DF values for AK, SN and KH. In addition, when DS17/18 and WS18, respectively.
Tana1 was compared with DOA2, there were no
significant differences in DF or PH. Sensory qualities of cooked rice
The average PL among lines/varieties in each Sensory tests were used to provide a score for the
season were significantly different (p < 0.05) overall eating quality according to the Tana Grain
whereas the average PL among seasons in each Co. Ltd. protocol. As shown in Table 4, DOA2 had
line/variety were significantly different (p < 0.05) the highest scores of characteristics (4.0), flavor
in Tana1, Tana5, DOA2, SS and KH, except for (4.0), aroma (4.0) and average score (3.9). How-
Tana2, Tana3, Tana4, DOA1 and AK. However, the ever, the scores of every characteristic of Tana1 were
PL of the five candidate lines in all three seasons not significantly different from those of DOA2, and
was slightly different from that of DOA2 while the Tana1 had a mean score of 3.85. On the other hand,
PL of AK, SN and KH in all three seasons was shorter product sample 2 (a control) had the lowest average
than that of the other lines/varieties (Table 3). The score (2.15). When the japonica varieties derived
SS of all lines/cultivars in WS17 and DS17/18 were from Japan were considered, including AK, SN and
higher than that in WS18 except for SN and KH. KH, it was found that the average scores were lower
Moreover, KH presented the lowest SS in DS17/18 (2.25–2.75) than those of DOA1, DOA2 and Tana1.
(67.18%). Lastly, the Gy/Po of Tana1 in WS17 For Tana5, which had a high yield, as did Tana1, the
(7.28 kg) and DS17/18 (7.54 kg) was higher com- average score was only 2.7, which was significantly
pared with that of the other lines/varieties and lower than that of both DOA2 and Tana1.
was higher than that of the original variety, DOA2
(5.15 kg in WS17 and 5.40 kg in DS17/18) and Grain quality
higher than that of AK (3.81 kg in WS17 and 3.73 kg The F -values of grain quality were also different
in DS17/18). On the other hand, the Gy/Po of among the lines/varieties except for AT, whose grain
Tana1 in WS18 was lower than that in WS17 and quality was not significantly different from that
DS17/18. However, the Gy/Po of Tana1–Tana5 in of the other lines/varieties (Table 4, Fig. 1). The
WS18 were not significantly different from the value paddy grain width/length of Tana1 (3.73/7.92 mm)
of DOA2 (Table 3). In addition, the Gy/Po of almost and Tana 3 (3.76/7.98 mm) was the highest com-
every line/variety in DS17/18 was higher than that pared with that of the other lines/varieties while
in WS17 and WS18. Thus, Tana1 selected via the paddy grain width/length of AK, SN and KH was
the pure-line method should produce higher grain 3.26/7.32 mm, 3.06/7.13 mm and 3.36/6.91 mm,
yields than DOA2. respectively (Table 4). In addition, the milled grain
width of Tana1 (3.22 mm) was not significantly
The stability of grain yield different from that of DOA1 and DOA2 (3.14 and
The results of the GGE biplot analysis of grain 3.16 mm, respectively) while the milled grain length
yield stability are shown in Fig. 2. The relationship of Tana1 (5.36 mm) was significantly different from
between the mean Gy/Po and PCA1 indicated that that of DOA1 and DOA2 (3.14 and 3.16 mm, re-
the lines/cultivars whose mean Gy/Po in the three spectively) (Table 4). However, both the paddy and
seasons was higher than the mean Gy/Po (5.01 kg) milled grain size of Tana1 and the other candidate
were Tana1 (6.61 kg), Tana5 (5.90 kg), Tana2 lines were in accordance with the standard size of
(5.55 kg), DOA2 (5.32 kg) and Tana3 (5.27 kg) those of japonica rice [28].
(Table 3). However, the difference in seasons af- The GE of the five candidate lines (2.01–
fected the Gy/Po of every line/variety. DS17/18 2.19 mm) was more elongated than that of AK,
had the highest mean Gy/Po (5.61 kg), followed by SN and KH (1.78–1.97 mm), but there were no
WS17 (4.91 kg) and WS (4.50 kg). In addition, significant differences with that of DOA1 or DOA2
SN had the lowest PCA1 (0.16) (Fig. 2a). These (2.06 and 2.04 mm, respectively) (Table 4). The
findings mean that SN had a highly stable Gy/Po, AT results among the lines/varieties were not sig-
but this cultivar had low yield. When stability nificant, as shown in Table 4 and Fig. 1. Lastly, the
among the five candidate lines was considered, it amylose content was the lowest (17.83%) in KH,
was found that Tana5 was highly stable. The biplot and the GE of the other lines/varieties varied from
graph between PCA1 and PCA2 of Gy/Po in Fig. 2b 21.12–22.96 mm (Table 4).
www.scienceasia.orgScienceAsia 46 (2020) 165
b
a 1.5
WS17
1
Tana1
DS17
Koshihikari 0.5 Tana1
Akitakomachi
0.5 WS17
Sasanishiki Tana5 Tana3
PCA1
0
Tana4 DOA1
Akitakomachi PC2 (36.8%) 0.0 Sasanishiki
Tana2
Tana2
-0.5 Tana3 WS18
DOA2 Koshihikari
-1 Tana4
WS18 -0.5
-1.5 DS17
3 3.5 4 4.5 5 5.5 6 6.5 7 Tana5
Yield per plot -1.0 -0.5 0.0 0.5 1.0
PC1 (63.2%)
Fig. 2 (a) Biplot graph of the PC1 score versus the mean grain yield per plant of 10 lines/varieties in different seasons
and (b) biplot graph of the PC1 score versus the PC2 score for the grain yield of 10 lines/varieties.
Table 4 The means of the sensory tests and cooking quality of 5 candidate lines compared with control varieties from
Phan, Chiang Rai province, in DS17/18.
Sensory item Paddy GS (mm) Milled GS (mm) GE AT AC
Variety
Appearance Flavor Aroma Softness Adhesiveness Mean Width Length Width Length (mm) (%)
Tana1 4.00a 3.75ab 3.75ab 4.00a 3.75a 3.85a 3.73a 7.92a 3.22a 5.36b 2.01abc 6 21.62bcd
Tana2 3.00b 2.75bc 3.00abc 3.00abcd 3.00ab 2.95b 3.57b 7.67b 3.17ab 5.44a 2.13ab 6 22.96a
Tana3 2.25bc 2.25c 2.50c 2.25cd 2.75abc 2.40cde 3.76a 7.98a 3.13bc 5.23d 2.06abc 6 21.54bcd
Tana4 2.50bc 2.50c 2.75bc 1.75d 2.50bcd 2.40cde 3.22d 7.37de 3.10bc 5.27c 2.19a 6 21.34bcd
Tana5 2.50bc 2.75bc 2.75bc 2.25cd 3.25ab 2.70bc 3.61b 7.67b 3.07c 5.19e 2.04abc 6 22.03bc
DOA1 3.00b 2.75bc 2.75bc 3.35abc 3.00ab 3.00b 3.53b 7.55bc 3.14abc 5.42a 2.06abc 6 22.17ab
DOA2 4.00a 4.00a 4.00a 3.75ab 3.75a 3.90a 3.57b 7.52bcd 3.16abc 5.46a 2.04abc 6 21.91bcd
AK 2.00c 2.50c 2.75bc 1.75d 2.25bcd 2.25de 3.26cd 7.32de 2.80e 5.18e 1.92cd 5 21.12d
SN 2.50bc 2.50c 2.75bc 2.50bcd 2.75abc 2.60bcd 3.06e 7.13e 2.86de 5.06g 1.97bcd 5 22.31ab
KH 3.00b 2.75bc 2.75bc 2.50bcd 2.75abc 2.75bc 3.36c 6.91f 2.95d 5.15ef 1.78d 5 17.83e
PS 1 2.25bc 3.00abc 3.25abc 2.25cd 1.75cd 2.50cde – – – – – – –
PS 2 2.00c 2.75bc 2.75bc 1.75d 1.50d 2.15e – – – – – – –
Mean 2.70 2.85 2.98 2.59 2.75 2.79 3.46 7.50 3.06 5.27 2.02 5.7 21.47
F -test ** * * ** ** ** ** ** ** ** * ns **
% CV 21.62 30.3 27.21 33.43 28.43 11.62 1.76 1.54 1.78 0.45 7.88 0.02 2.17
Different letters in the column (sensory tests and cooking quality) are significantly different at p < 0.05.
PS is Product sample.
Phylogenetic relationships among five contained three varieties that were introduced from
candidate lines and control varieties Japan, including KH, SN and AK, which showed
According to the GBS results of the five candidate SNP differences ranging from 4035–5490 positions
lines and control varieties, a phylogenetic tree show- throughout the whole genome. Thus, DOA2 and
ing the relationships among the ten lines/cultivars AK currently exhibit a difference in their genetic
was constructed (Fig. 3). The phylogenetic tree background (7560 SNP positions). Moreover, DOA1
was divided into two groups. Group I contained and SN also exhibit a difference in their genetic
five candidate lines together with DOA1 and DOA2, background (5283 SNP positions), and DOA1 and
which had slightly different bases in their genome. DOA2, which farmers used to grow in the northern
In addition, the genetic background of Tana5 in part of Thailand, were found to be closely related
group I was closely related to that of DOA2, which (28 SNP positions).
showed the base difference of only 27 bp in the
whole genome; however, Tana3 was closely related DISCUSSION
to DOA1 (21 SNP positions). In addition, Tana1, Genotype and environmental effects on
which performed well in the yield trials, was sepa- agronomic traits and yield
rate from group I but was not much different from
The six japonica rice varieties exhibited variation
the others in this group. On the other hand, group II
in each agronomic trait and yield when they were
www.scienceasia.org166 ScienceAsia 46 (2020)
Tana3
56
DOA1
67
DOA2
41
Tana5
43 Tana4
68 Tana2
Tana1
Sasanishiki
100
Akitakomachi
96 Koshihikari
0.05
Fig. 3 A phylogenetic tree of 5 candidate lines and controlled varieties based on genotype by sequencing. The
phylogenetic tree was classified into 2 groups. Group I comprises Tana1–5, DOA1 and DOA2 while group II comprises
the japonica varieties introduced from Japan, including AK, SN and KH. The numbers at the node indicate the
percentage obtained with 1000 bootstraps.
grown in different locations. In general, japonica Therefore, the agronomic traits and yield of all the
rice originated in a temperate climate. Thus, japon- varieties in KPS were lower than those in Phan.
ica rice should be sensitive to high temperatures Thus, the northern part of Thailand rather than the
such as those that occur in Thailand. However, the central part is suitable for growing japonica rice [3].
DOA1 and DOA2 varieties are suitable for growth In this experiment, compared with other varieties,
in areas where the average temperature is approxi- DOA2 produced the highest yield in both KPS and
mately 18–25 °C and their resistance to hot weather Phan. However, the yield of DOA2 in KPS was lower
is stronger than that of other Japanese rice vari- than that in Phan. In previous research on japonica
eties [3]. These two varieties can grow in both rice in Thailand, AK was evaluated in farmers’ fields
wet and dry seasons. In Experiment 1, it could in northern and northeastern Thailand between
be confirmed that DOA1 and DOA2 still produced 1992 and 1995; it was then recommended to plant a
high yields compared with those of other japonica different variety, namely DOA2, in 1995 [3]. Thus,
varieties in the Phan district. However, the day- at present, DOA2 is still a good japonica variety to
time/nighttime temperatures in both KPS and Phan grow in the northern part of Thailand. However, the
in Experiment 1 were higher than the recommended DOA2 was not uniform and produced off-type plants
values, especially in KPS. Thus, the grain yield of in farmers’ fields in Chiang Rai [18]. Thus, this re-
each variety in KPS was lower than that in Phan. search involved the recollection of DOA2 germplasm
These results can be explained by heat units during from three sources and started the selection of good
the crop growth period. The occurrence of various plants via pure-line selection.
phenological events can be estimated by computing
Genetic background of DOA1 and DOA2
accumulated heat units, which provide an estimate
of harvest date [29]. Therefore, with respect to In the history of japonica rice research in Thailand,
japonica rice that is grown under high temperatures, SN and AK showed good performance in terms of
the accumulation of heat units occurs faster than agronomic traits and yield in yield trials with other
that under low temperatures, which reduces growth japonica varieties in northern areas in Thailand.
and development in the vegetative phase and re- Afterward, the Rice Department of the Ministry of
duces the accumulation of biomass. These results Agriculture and Cooperative released the DOA1 and
can decrease the life cycle of rice plants [3]. In DOA2 varieties as recommended ones [2, 3]. How-
this experiment, the average temperature in KPS ever, these varieties produced many off-type plants
was higher than that in Phan by approximately 2 °C. in farmers’ fields in Chiang Rai province [18]. In ad-
Thus, the accumulation of heat units in KPS in the dition, the genetic backgrounds of DOA1 and DOA2
vegetative stage finished earlier than that in Phan. were different from those of SN and AK according
to an analysis with the double-digest restriction-
www.scienceasia.orgScienceAsia 46 (2020) 167
associated DNA (ddRAD) sequencing technique. CONCLUSION
This result confirmed that the genetic background
In this research, japonica varieties were found to
of DOA1 and DOA2 had already changed. Thus,
be suitable to grow in the Phan district rather than
these results were confirmed again by using the GBS
in KPS due to weather factors, especially air tem-
technique and were the same as those of previous re-
perature. Compared with other japonica varieties,
ported [18]. DOA1 and DOA2 have been released to
DOA2 still showed good performance. However,
farmers since 1995 until now (24 years). The paddy
at the present time, the genotype and phenotype
fields that grew DOA1 and DOA2 were also used to
of DOA2 have changed from those of the original
grow other indica varieties such as Khao Dawk Hom
variety (AK). Thus, pure-line selection can improve
Mali 105 (long grain type) or RD6 and Sun Pa Tong1
agronomic traits and increase the yield of DOA2.
(glutinous rice) [30]. This phenomenon may affect
Lastly, Tana1 showed great performance in terms of
outcrossing in the field for many years. Moreover,
grain yield, although the grain quality and cooking
contamination can occur at several stages of rice
quality had not changed compared with those of
production, including unintentional mixing of seed
DOA2. In addition, the genetics of Tana1 changed
with that of other varieties during seed preparation,
slightly from those of DOA2. Thus, DOA2 can be
during harvest and during grain processing [31].
replaced with Tana1 and can be grown in northern
Thailand, especially in Chiang Rai province.
Pure-line selection slightly changed the
Acknowledgements: The authors would like to ac-
genotype but can improve yields while
knowledge the Tana Group International Co. Ltd., Thai-
maintaining good cooking quality
land for financing the study and the provision of this
In the pure-line selection, five candidate lines were research.
selected for yield trials in WS17, DS17/18 and
WS18 and were compared with control varieties. In Appendix A. Supplementary data
addition, the GBS technique was used to identify
Supplementary data associated with this arti-
differences in genotype. The results showed that
cle can be found at http://dx.doi.org/10.2306/
the five candidate lines did not seem to generate
scienceasia1513-1874.2020.029
many different genetic backgrounds compared with
that of DOA2, although there were candidate lines REFERENCES
that were very different from AK. In addition, among
the five candidate lines, there were also slightly 1. Kousei A (2010) Present Situation and Future of
Japanese Restaurants in Thailand, Bangkok.
different genetic backgrounds. In terms of agro-
2. CRC (2014) Research and Development of Japanese
nomic traits and grain yield, Tana1 had the greatest
Rice in Thailand, CRC, Rice Department, Thailand.
yield in WS17 and DS17/18, but its yield was not
[in Thai]
significantly different from that of DOA2 in WS18. 3. Warinrak B (2013) Japonica Rice Production Technol-
Moreover, the other agronomic traits in the three ogy in Thailand, CRC, Rice Department, Thailand. [in
seasons varied among and within the lines/varieties Thai]
because the variation within a pure-line population 4. Tanaka I, Kobayashi A, Tomita K, Takeuchi Y, Ya-
is not heritable due to environmental factors [32]. magishi M, Yano M, Sasaki T, Horiuchi H (2006)
Thus, in this experiment, the methodology factors Detection of quantitative trait loci for stickiness and
including air temperature, relative humidity and appearance based on eating quality test in japonica
amount of rainfall between the wet and dry seasons rice cultivar. Breed Res 8, 39–47. [in Japanese]
were different, which then affected grain yield and 5. Takeuchi Y, Hori K, Suzuki K, Nonoue Y, Takemoto-
agronomic traits. However, the genetics of the five Kuno Y, Maeda H, Sato H, Hirabayashi H, et al
candidate lines were slightly altered. This means (2008) Major QTLs for eating quality of an elite
Japanese rice cultivar, Koshihikari, on the short arm
that selection within the pure-line population can
of chromosome 3. Breed Sci 58, 437–445.
alter the genetic background, albeit not by much.
6. Wada T, Ogata T, Tsubone M, Uchimura Y, Mat-
Moreover, Tana1 had good grain quality and cook- sue Y (2008) Mapping of QTLs for eating quality
ing quality, both of which were similar to those and physicochemical properties of the japonica rice
of DOA2. Thus, the pure-line selection method ’Koshihikari’. Breed Sci 58, 427–435.
can slightly alter genotypes, but it can be used to 7. Kobayashi A, Hori K, Yamamoto T, Yano M (2018)
maintain the purity of an existing variety that has Koshihikari: a premium short-grain rice cultivar – its
become contaminated. expansion and breeding in Japan. Rice 11, ID 15.
www.scienceasia.org168 ScienceAsia 46 (2020)
8. Sugiura K, Honjo H, Hayashi M, Nonoyama T, Ya- comparison in cultivar DOA2 with others japonica
mashita K, Torazawa A, Yamauchi A (2013) Research and indica rice. Khon Kaen J 45S1, 1045–1056. [in
on the factors affecting kernel quality of rice cultivar Thai]
’Koshihikari’ cultivated in Aichi prefecture. Crop Sci 19. Rathore RK, Ram M (2013) Role of selection in
Soc Jpn 82, 262–269. [in Japanese] improving cultivars. Popular Kheti 1, 45–48.
9. Warinrak B (2012) The History of Japanese Rice in 20. Little RR, Hilder GB, Dawson EH (1958) Differential
Thailand: During the Period from Past to Year 2012, effect of dilute alkali on 25 varieties of milled milled
CRC, Rice Department, Thailand. [in Thai] rice. Cereal Chem 35, 111–126.
10. Seemaon K, Yamao M, Hosono K (2015) Production 21. IRRI (2013) Alkali digestion. In: Standard Evaluation
of Japanese rice through contract farming system in System (SES) for Rice, 5th Edn, IRRI, Manila, Philip-
Wiang Pa Pao district, Chiang Rai province, Thailand. pines, pp 46.
Am J Rural Dev 3, 41–51. 22. Julino BO (1985) Criteria and test for rice grain
11. Kawatsu S, Homma K, Horie T, Shiraiwa T (2007) quality. In: Rice chemistry and technology, AACC,
Change of weather condition and its effect on rice Saint Paul, USA, pp443–513.
production during the past 40 years in Japan. Crop 23. Juliano BO (1971) A simplified assay for milled rice
Sci Soc Jpn 76, 423–432. [in Japanese] amylose. Cereal Sci Today 16, 334–340.
12. Suenaga K, Takashima M, Suzuki K (1963) On the 24. Langmead B, Salzberg S (2012) Fast gapped-read
new rice variety “SASANISHIKI”. Bull Miyagi Agric alignment with Bowtie 2. Nat Methods 9, 357–359.
Exp Stn 33, 104–119. 25. McKenna A, Hanna M, Banks E, Sivachenko A, Cibul-
13. Inoue K (2012) A technical attempt to avoid the high skis K, Kernytsky A, Garimella K, Altshuler D, et al
temperature damage during ripening on rice cultivar (2010) The genome analysis toolkit: a MapReduce
Koshihikari in Fukui prefecture – focusing on the framework for analyzing next-generation DNA se-
transplanting time and grain qualities. Hokuriku Crop quencing data. Genome Res 20, 1297–1303.
Sci 47, 137–140. [in Japanese] 26. R Core Team (2014) R: A Language and Environment
14. Iwata T (1992) A report on a japonica rice va- for Statistical Computing, R Foundation for Statistical
riety ’Koshihikari’ cultivated in foreign countries. Computing, Vienna, Austria.
Hokuriku Crop Sci 27, 90–93. [in Japanese] 27. Gauch HG (1988) Model selection and validation for
15. Kawamura S, Natsuga M, Kouno S, Itoh K (1996) yield trials with interaction. Biometrics 44, 705–715.
Taste evaluation of California grown rice of Akitako- 28. Julino BO, Villareak CP (1993) Grain Quality Evalu-
machi, Koshihikari and Sasanishiki. J Jpn Soc Food ation of World Rice, IRRI, Manila, Philippines.
Sci 43, 328–332. [in Japanese] 29. Yoshida S (1981) Fundamental of Rice Crop Science,
16. Asian Development Bank (2009) The Economics of IRRI, Manila, Philippines.
Climate Change in Southeast Asia: a Regional Review, 30. CRC (2018) Rice Production and Marketing in Chiang
Asian Development Bank, Manila, Philippines. Rai, CRC, Thailand. [in Thai]
17. Meteorological Development Bureau (2016) 31. Chamarerk V, Cobelli P, Jairin J, Mekwattanakarn P,
Annual weather summary over Thailand 2015. Leelakud P, Wongnongwa J (2016) Development of
Available at: www.tmd.go.th/programs/uploads/ molecular markers for purity testing in Thai jasmine
yearlySummary/annual2015_e.pdf. rice. Adv Eco Env Res 1, 35–44.
18. Nakwilai P, Narumon P, Cheabu S, Saensuk C, Arikit S, 32. Acquaah G (2012) Principles of Plant Genetics and
Malumpong C (2017) The genotypic and phenotypic Breeding, 2nd edn, Wiley-Blackwell, USA.
www.scienceasia.orgScienceAsia 46 (2020) S1
Appendix A. Supplementary data
Table S1 The soil nutrients compared between KPS and Phan districts.
Soil nutrient KPS Phan
Soil pH 5.80 5.40
Organic matter (%) 3.82 1.56
Total N (mg/kg) 1000 700
Available P (mg/kg) 29.45 26.70
Exchangeable K (mg/kg) 59.30 75.54
Exchangeable Ca (mg/kg) 1120.20 629.00
Exchangeable Mg (mg/kg) 69.73 76.50
Table S2 The weather data in the WS16 from Jun–Oct between KPS and Phan district.
Day Temp ( °C) Night Temp ( °C) Day RH (%) Night RH (%) Rainfall (mm)
Month
KPS Phan KPS Phan KPS Phan KPS Phan KPS Phan
Jun 31.1 31.2 28.3 24.6 54.4 40.1 94.2 83.5 119.4 348.5
Jul 32.1 30.5 29.2 25.4 60.8 58.4 98.3 78.4 112.9 332.9
Aug 34.3 31.2 26.8 26.7 54.5 63.4 97.2 99.5 120.5 396.7
Sep 33.4 31.4 26.4 25.3 52.5 73.2 73.5 97.3 127.6 277.3
Oct 34.5 30.6 27.4 25.5 67.3 45.8 85.2 92.2 227.8 164.9
Mean 33.1 31.0 27.6 25.5 57.9 56.2 89.7 93.1 141.6 304.1
Table S3 The weather data in WS17, DS17/18 and WS18 in the yield trials in Phan, Chiang Rai province.
Temperature ( °C) RH (%)
Month Rainfall
Day Night Day Night (mm)
WS17
May 2017 29.38 25.19 74.32 87.99 297.2
Jun 2017 29.26 25.49 77.19 90.41 207.3
Jul 2017 27.99 24.66 82.64 93.13 390.0
Aug 2017 28.50 25.15 81.51 92.38 349.9
Sep 2017 28.35 24.86 81.50 92.63 280.2
Mean 28.70 25.07 79.43 91.31 304.9
DS17/18
Dec 2017 23.27 17.94 74.39 91.29 79.0
Jan 2018 23.58 18.77 76.97 91.62 5.4
Feb 2018 25.96 19.69 70.56 89.26 20.5
Mar 2018 27.82 22.20 70.51 89.13 14.3
Apr 2018 28.35 23.64 76.27 91.07 195.4
Mean 25.80 20.45 73.74 90.47 62.9
WS18
Jul 2018 28.80 25.67 84.15 93.70 182.0
Aug 2018 28.01 24.97 85.65 94.92 309.6
Sep 2018 29.00 25.12 81.98 92.63 245.9
Oct 2018 27.98 23.95 81.88 94.12 197.3
Nov 2018 26.54 21.16 74.72 92.37 56.2
Mean 28.06 24.17 81.68 93.55 198.2
www.scienceasia.orgS2 ScienceAsia 46 (2020) Fig. S1 Scheme of pure-line selection of DOA2 derived from 3 sources from the 1st–6th seasons in Phan district, Chiang Rai province. www.scienceasia.org
You can also read