Identification of Candidate Genes Involved in Curd Riceyness in Cauliflower - MDPI
←
→
Page content transcription
If your browser does not render page correctly, please read the page content below
International Journal of
            Molecular Sciences

Article
Identification of Candidate Genes Involved in Curd
Riceyness in Cauliflower
Zhenqing Zhao, Xiaoguang Sheng, Huifang Yu, Jiansheng Wang, Yusen Shen and Honghui Gu *,†
 Institute of Vegetables, Zhejiang Academy of Agricultural Sciences, Hangzhou 310021, China;
 zhaozq@zaas.ac.cn (Z.Z.); xguang@zaas.ac.cn (X.S.); hfyu@zaas.ac.cn (H.Y.); wangjs@zaas.ac.cn (J.W.);
 yusen612@163.com (Y.S.)
 * Correspondence: guhh2199@163.com
 † Institute of Vegetables, Zhejiang Academy of Agricultural Sciences, Shiqiao Road 198, Hangzhou,
   310021, China.

 Received: 17 February 2020; Accepted: 13 March 2020; Published: 15 March 2020

 Abstract: “Riceyness” refers to the precocious development of flower bud initials over the curd
 surface of cauliflower, and it is regarded as undesirable for the market. The present study aimed
 to identify the candidate loci and genes responsible for the morphological difference in riceyness
 between a pair of cauliflower sister lines. Genetic analysis revealed that riceyness is controlled by a
 single dominant locus. An F2 population derived from the cross between these sister lines was used
 to construct “riceyness” and “non-riceyness” bulks, and then it was subjected to BSA-seq. On the
 basis of the results of ∆(SNP-index) analysis, a 4.0 Mb candidate region including 22 putative SNPs
 was mapped on chromosome C04. Combining the RNA-seq, gene function annotation, and target
 sequence analysis among two parents and other breeding lines, an orthologous gene of the Arabidopsis
 gene SOC1, Bo4g024850 was presumed as the candidate gene, and an upstream SNP likely resulted in
 riceyness phenotype via influencing the expression levels of Bo4g024850. These results are helpful to
 understand the genetic mechanism regulating riceyness, and to facilitate the molecular improvement
 on cauliflower curds.

 Keywords: cauliflower; curd development; riceyness; genetic mapping; flowering regulation

1. Introduction
      Curd of cauliflower (Brassica oleracea var. botrytis) is constituted by a mass of spirally arranged
floral branches with whorls of inflorescence and floral meristems, the whole held tightly together and
forms a hypertrophied corymb [1,2]. Typical cauliflower bears a semi-spherical curd with fairly smooth
and rounded surface. However, during curd growth and development, initially developmental buds
often appear on the curd surface, which is known as “riceyness” (Figure S1). It is one of the most
serious risks in cauliflower production, because riceyness influences on both quality and yield of curd.
      The initiation and development of curd occurs at the early reproductive stage of cauliflower,
which is regarded as a floral reversion phenomenon [3]. At the curd development stage, the ability
to produce mature floral structures is temporarily inhibited [4,5], while the iterative process of
proliferations of apical meristems of branches induces a rapid increase in curd size [6] Some pedicels
start bolting accompanied with the differentiation of floral meristems only when the curd develops to
the post-maturity stage, and then the plant begins to bloom [3,6]. Therefore, the essence of riceyness
is that the partial or total ability to differentiate floral meristems is restored in advance of the curd
development stage, which is closely related to the regulatory network of plant flowering, especially the
determinacy mechanism of floral meristems.

Int. J. Mol. Sci. 2020, 21, 1999; doi:10.3390/ijms21061999                           www.mdpi.com/journal/ijms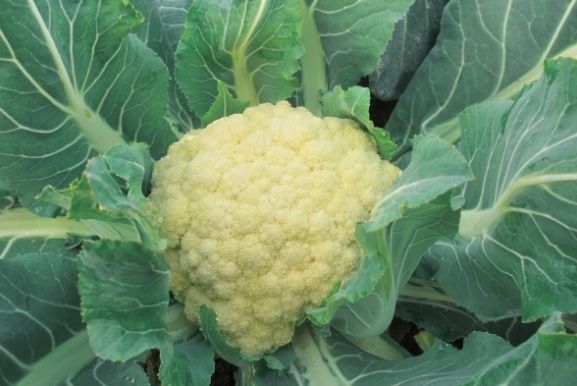
Int. J. Mol. Sci. 2020, 21, 1999 2 of 11
Plant flowering regulation is controlled by an intricate network of genetic regulators and
their interaction with environmental factors [7]. Similarly, riceyness is thought to be influenced,
to some extent, by the environmental conditions. However, it is also worth noting that different
varieties have shown various levels of resistance to riceyness, suggesting that this undesirable trait is
genetically controlled by polygenes or major genes whose effects were modified by environmental
factors [8]. Among the flowering regulatory genes, floral meristem identity genes APETALA1 (AP1)
and CAULIFLOWER (CAL) were intensively studied in cauliflower, as the ap1 cal double mutants
of Arabidopsis form floral meristems similar to cauliflower curds [5]. In Arabidopsis, AP1 and CAL
belong to the MADS-box regulatory gene family and have the function of promoting the flowering
process [9]. Because of the strong similarity of amino acid sequences and a highly redundant biological
function between AP1 and CAL, curd-like organs can only be formed when both of these two genes are
mutated in Arabidopsis [5]. In cauliflower, a terminated mutation in the fifth exon of CAL results in
the functional deficiency of its encoding product, whereas AP1 has normal function [10]. Subsequent
studies have also shown that mutant CAL allele is present in different cauliflower varieties from
different regions, suggesting that CAL is responsible for the cauliflower phenotype in Brassica oleracea
species [11]. Interestingly, there is also evidence that there are two copies of CAL gene, including one
mutant CAL-T and one wild CAL-G, coexisting in the riceyness cauliflower and broccoli, indicating that
riceyness could be related to the sequence or functional variation of the CAL gene in cauliflower [12].
However, when the full-length exogenous CAL gene is introduced into cauliflower, the transgenic
lines give rise to inflorescence composed of green flower buds and lose the ability to form curds [13],
which are morphologically different from riceyness. So far, the molecular mechanisms of riceyness
are not clear. Genes and loci associated with riceyness are not well revealed. In cauliflower breeding,
the traditional methods based on phenotypic selection are still the main way to improve tolerance for
riceyness of the cultivar [14–16].
In this paper, we subject bulked segregant analysis using the sequencing (BSA-seq) method and
RNA-seq analysis in order to perform the gene mapping and candidate gene identification of riceyness
using a pair of sister lines showing morphological differences in riceyness tolerance.
2. Results
2.1. Phenotypic Variation and Genetic Analysis
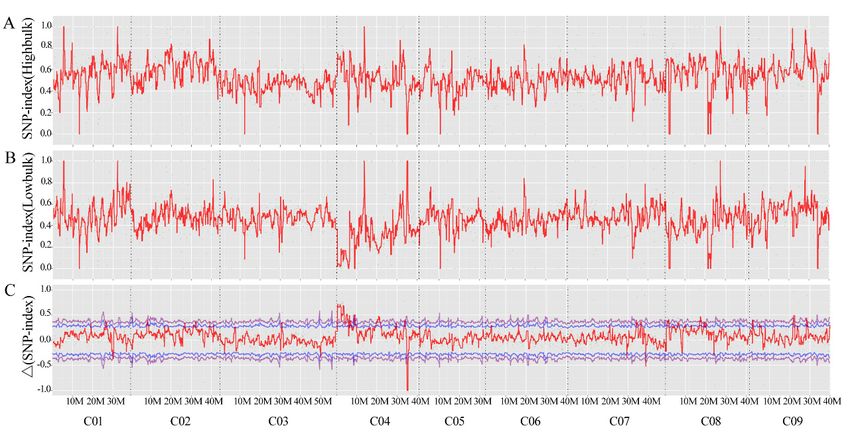
Two parents (QNF11-3 and QNF11-16) showed high similarity in botanical morphology except
curd morphology. There were numerous canary yellow ricey tissues covering on the curd surface
of QNF11-3, whereas the curd of QNF11-16 showed a smooth surface (Figure 1). Scanning electron
microscope observation revealed the ricey tissues were floral meristems including many first-round
floral organs, indicating that QNF11-3 gains the ability to differentiate floral organs at the curd stage
without the elongation of the pedicels. These results suggested that the riceyness phenotype could be
related to the regulation of plant flowering.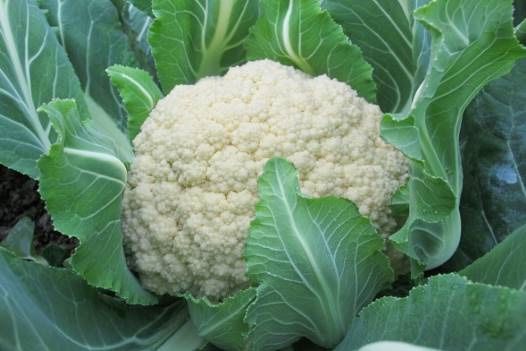
Int. J.J. Mol.
Int.      Mol. Sci.
               Sci. 2020, 21, x1999
                    2020, 21,   FOR PEER REVIEW                                                                33 of
                                                                                                                  of 11
                                                                                                                     11

         A1                                                      B1

         A2                         A3                           B2                  B3

         A4                         A5                           B4                  B5

      Figure 1. Phenotypic differences between” QNF11-3” (A) and ”QNF11-16” (B). A1 and B1, curds
      Figure 1. Phenotypic differences between” QNF11-3” (A) and ”QNF11-16” (B). A1 and B1, curds
      appearance at economical maturity stage; A2 and B2, enlarged view of the meristems on the curd
      appearance at economical maturity stage; A2 and B2, enlarged view of the meristems on the curd
      surface at economical maturity stage; A3 and B3, electron microscope images of the surface
      surface at economical maturity stage; A3 and B3, electron microscope images of the surface meristems
      meristems at economical maturity stage; A4 and B4, appearance of surface meristems when the
      at economical maturity stage; A4 and B4, appearance of surface meristems when the plants start bolting;
      plants start bolting; A5 and B5, electron microscope images of the surface meristems when the curds
      A5 and B5, electron microscope images of the surface meristems when the curds start bolting. The black
      start bolting. The black bars in the lower right in A1, B1, A4, and B4 indicate 1 cm, and those in A3,
      bars in the lower right in A1, B1, A4, and B4 indicate 1 cm, and those in A3, B3, A5, and B5 indicate
      B3, A5, and B5 indicate 1 mm.
      1 mm.

     Phenotypic
     Phenotypic variations
                  variations were     also visible
                               were also   visible among
                                                   among segregation
                                                             segregation populations.
                                                                             populations. Table
                                                                                            Table 11 shows the
                                                                                                     shows the
phenotypic   segregation   data  of all generations.  Two    reciprocal    crossing F 1 and one BC1 generated
phenotypic segregation data of all generations. Two reciprocal crossing F1 and one BC1 generated
from  QNF11-3×F1 displayed
from QNF11-3×F                  non-segregation with uniform riceyness phenotype. The riceyness and
                  1 displayed non-segregation with uniform riceyness phenotype. The riceyness and
non-riceyness
non-riceyness segregation of F2Fpopulation
               segregation    of   2 population and another BC1 population (QNF11-16×F1) accorded
                                               and another BC1 population (QNF11-16×F1 ) accorded with
with  the expecTable 2 3:1  (χ
the expectable 3:1 (χ = 0.18, p > 0.05) and 1:1 (χ2 = 1:1
                              2 = 0.18, p > 0.05) and
                                                       0.75,(χp >
                                                               2 = 0.75, p > 0.05), respectively, indicating a
                                                                   0.05), respectively, indicating a monogenic
monogenic   inheritance.  Riceyness   is dominant  to
inheritance. Riceyness is dominant to non-riceyness.  non-riceyness.

      Table 1.
      Table 1. Phenotypic
               Phenotypic segregation
                            segregation and genetic analysis
                                        and genetic analysis of the riceyness
                                                             of the riceyness trait
                                                                              trait among
                                                                                    among all
                                                                                          all populations
                                                                                              populations
      constructed in the present study.
      constructed in the present study.
                                                                                     Presumptive
                                                                                  Presumptive            2
          Accessions
           Accessions            Total
                                   Total     Riceyness
                                                RiceynessNon-Riceyness
                                                                   Non-RiceynessSegregation
                                                                                      Segregation       χ
                                                                                                        χ2
                                                                                             Ratio
                                                                                         Ratio
        P1 (QNF11-3)               24            24                   0
         P1 (QNF11-3)                24              24                  0
       P2 (QNF11-16)               24            0                   24
        P2 (QNF11-16)                24              0                   24
        F1 -1 (P1×P2)             24             24                   0
            1-1 (P1×P2)
        F1F-2  (P2×P1)            24 24          24 24                0  0
          F 1-2(P1×F
       BC1 -1   (P2×P1)
                      1 -2)       12824         128  24              0   0
        BC   -1  (P1×F1 -2)
       BC1 -2 (P2×F
            1           1-2)        128
                                  162            87 128              75  0             1:1              0.75
        BC   -2  (P2×F
       F2 (F1 -2selfing)
            1           1-2)        162
                                  188           138 87               50 75             3:1 1:1          0.75
                                                                                                        0.18
         F2 (F1-2selfing)           188             138
                                                      χ2 0.05,1 = 3.841. 50                3:1          0.18
                                                      χ2 0.05,1 = 3.841.

2.2. Genetic Mapping of Riceyness

Int. J. Mol. Sci. 2020, 21, x; doi: FOR PEER REVIEW                                       www.mdpi.com/journal/ijms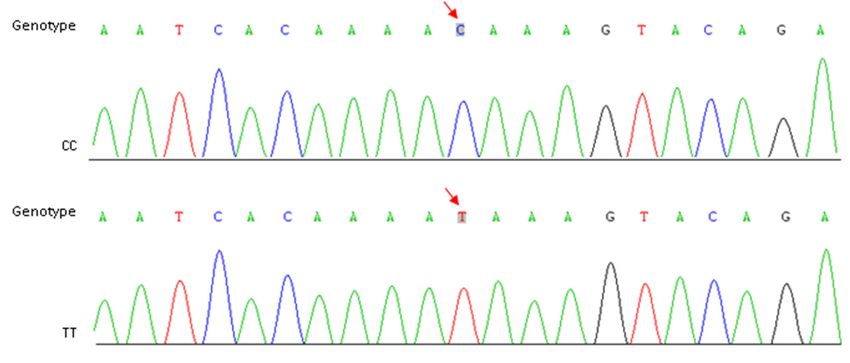
Int. J. Mol. Sci. 2020, 21, 1999 4 of 11
Int. J.Genetic
2.2. Mol. Sci.Mapping
2020, 21, x of
FOR PEER REVIEW
Riceyness 4 of 11
AA total
total of
of 2,24,791,210
2,24,791,210 andand 1,89,137,118
1,89,137,118 clean
clean reads
reads was
was generated
generated fromfrom QNF11-3
QNF11-3 (53.05X
(53.05X mean
mean
depth
depth coverage) and QNF11-16 (44.28X mean depth coverage), respectively, while 206,281,340 and
coverage) and QNF11-16 (44.28X mean depth coverage), respectively, while 206,281,340 and
205,882,398
205,882,398cleancleanreads
readswere generated
were generatedfromfrom
bulk-R (48.77X
bulk-R mean mean
(48.77X depth depth
coverage) and bulk-N
coverage) and (48.94X
bulk-N
mean
(48.94Xdepth
meancoverage), respectively.
depth coverage), After theAfter
respectively. readsthewere compared
reads with the with
were compared reference genome
the reference
sequence, 3,897,753 and 3,887,134 SNPs were identified in QNF11-3 and
genome sequence, 3,897,753 and 3,887,134 SNPs were identified in QNF11-3 and QNF11-16,QNF11-16, respectively, while
3,894,335 andwhile
respectively, 3,893,700 SNPsand
3,894,335 were identified
3,893,700 in bulk-R
SNPs and bulk-N,
were identified respectively.
in bulk-R According
and bulk-N, to the
respectively.
SNP-index and ∆(SNP-index) of these SNPs, only one region that was
According to the SNP-index and Δ(SNP-index) of these SNPs, only one region that was on on chromosome C04 from 3
to 7 Mb exhibited a significant difference between bulk-R and bulk-N (Figure
chromosome C04 from 3 to 7 Mb exhibited a significant difference between bulk-R and bulk-N 2). The peak position
was at 4.01
(Figure 2). Mb
Theonpeak
chromosome
position C04,
was and the corresponding
at 4.01 Mb on chromosome ∆(SNP-index)
C04, andreached
the 0.78 (Figure 2).
corresponding
This finding was consistent with the assumption that the riceyness
Δ(SNP-index) reached 0.78 (Figure 2). This finding was consistent with the assumptionand non-riceyness difference
that the
between
riceynessQNF11-3 and QNF11-16
and non-riceyness was controlled
difference between by a singleand
QNF11-3 locus. SNP ratio
QNF11-16 of controlled
was each SNP among this
by a single
region for each parent and each bulk was calculated in order to speculate the putative
locus. SNP ratio of each SNP among this region for each parent and each bulk was calculated in SNPs associated
with
orderriceyness.
to speculate In total, 22 SNPsSNPs
the putative accorded with the
associated expected
with ratioInoftotal,
riceyness. a monogenic
22 SNPsinheritance model;
accorded with the
of these, three
expected ratio SNPs
of a located
monogenicat gene coding sequences,
inheritance model; of whereas the other
these, three SNPs 19 mutations
located located
at gene codingat
upstream, downstream, or intergenic regions of function genes (Table S1). These
sequences, whereas the other 19 mutations located at upstream, downstream, or intergenic regionsSNPs were associated
with a total of
of function 29 genes
genes (Table(Table S1). SNPs were associated with a total of 29 genes (Table S1).
S1). These
Figure 2. SNP-index graphs of bulk-R (A) and bulk-N (B), and ∆(SNP-index) graph (C) based on
Figure 2.analysis.
BSA-seq SNP-index graphsrepresents
The X-axis of bulk-Rthe
(A)position
and bulk-N (B), and
of genome Δ(SNP-index)
and the graphthe
Y-axis represents (C)SNP-index
based on
BSA-seq analysis. The X-axis represents the position of genome and the Y-axis represents
for A and B, and ∆(SNP-index) for C. A candidate region was identified in chromosome C04 (3 to 7 Mb the
SNP-index for A and B, and Δ(SNP-index)
interval) with the peak position at 4.01 Mb. for C. A candidate region was identified in chromosome
C04 (3 to 7 Mb interval) with the peak position at 4.01 Mb.
2.3. Transcriptome Differences between Ricey and Non-Ricey Parents
2.3. Transcriptome Differences
To acquire insights between
into the Ricey and Non-Ricey
transcriptomic Parents
differences between the ricey and non-ricey parental
lines, To
RNA-seq
acquireanalysis
insightswas
intoperformed between the
the transcriptomic curd tissues
differences of QNF11-3
between andand
the ricey QNF11-16. About
non-ricey 298
parental
million clean reads
lines, RNA-seq were was
analysis obtained from six
performed libraries
between theand were
curd usedoffor
tissues quantitative
QNF11-3 gene expression
and QNF11-16. About
analysis;
298 million90.73%
cleanto reads
91.04%wereof the clean reads
obtained fromcould be mapped
six libraries andtowere
predict
usedgene
for regions, including
quantitative gene
88.48% to 88.88%
expression unique
analysis; mapped
90.73% reads, of
to 91.04% andthe2.12%
cleantoreads
2.43%could
multiple mapped reads.
be mapped The gene
to predict detailed data
regions,
of sequencing
including is shown
88.48% in Table
to 88.88% 2. mapped reads, and 2.12% to 2.43% multiple mapped reads. The
unique
Differential
detailed data of expression
sequencinganalysis
is shown revealed
in Tablea 2.
total of 213 DEGs. In ricey parent QNF11-3, 128 genes
were upregulated expressed and 85 genes were downregulated expressed as compared with the
non-ricey parent QNF11-16 (Figure 3; Table S2).
Int. J. Mol. Sci. 2020, 21, x; doi: FOR PEER REVIEW www.mdpi.com/journal/ijms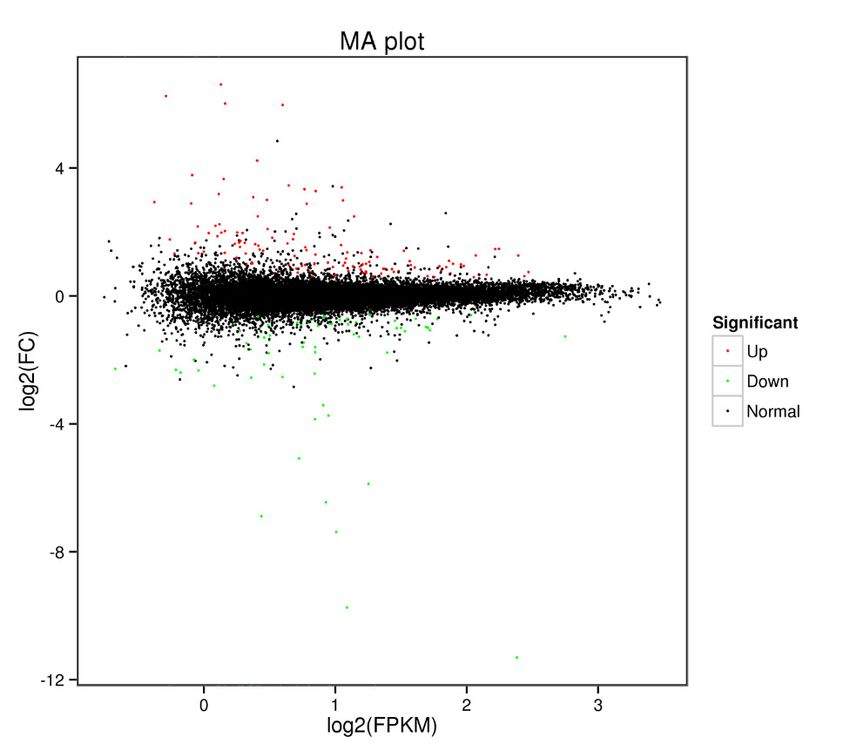
Int. J. Mol. Sci. 2020, 21, x FOR PEER REVIEW 5 of 11
Table 2. Summary of the RNA-seq data for the six samples.
Unique Multiple
Int. J. Mol. Sci. 2020, Clean GC ≥Q30 Mapped
Sample ID21, 1999 Mapped Mapped5 of 11
Reads Content Percent Reads
Reads Reads
49,513,194 48,304,718 1,208,476
QNF11-3a Table 2. Summary
54,571,970 of the RNA-seq
47.97% 93.25% data for the six samples.
(90.73%) (88.52%) (2.21%)
41,623,020 40,510,608
Unique 1,112,412
Multiple
QNF11-3b 45,719,248 48.03% 94.01%
≥Q30 Mapped
Sample ID Clean Reads GC Content (91.04%) (88.61%)
Mapped (2.43%)
Mapped
Percent Reads
49,331,459 48,129,177
Reads 1,202,282
Reads
QNF11-3c 54,239,870 48.00% 93.50%
(90.95%)
49,513,194 (88.73%)
48,304,718 (2.22%)
1,208,476
QNF11-3a 54,571,970 47.97% 93.25% 45,230,328 44,118,409 1,111,919
QNF11-16a 49,792,618 47.99% 93.52% (90.73%) (88.52%) (2.21%)
(90.84%)
41,623,020 (88.60%)
40,510,608 (2.23%)
1,112,412
QNF11-3b 45,719,248 48.03% 94.01%
44,299,094
(91.04%) 43,175,218
(88.61%) 1,123,876
(2.43%)
QNF11-16b 48,798,226 48.00% 93.40%
49,331,459
(90.78%) 48,129,177
(88.48%) 1,202,282
(2.30%)
QNF11-3c 54,239,870 48.00% 93.50%
(90.95%)
882,404 (88.73%)
39,930,744 (2.22%)
951,660
QNF11-16c 44,926,024 47.93% 93.65% 45,230,328 44,118,409 1,111,919
QNF11-16a 49,792,618 47.99% 93.52% (91.00%) (88.88%) (2.12%)
(90.84%) (88.60%) (2.23%)
44,299,094 43,175,218 1,123,876
QNF11-16b
Differential48,798,226 48.00% revealed
expression analysis 93.40%
a total of 213 DEGs. In ricey parent QNF11-3,
(90.78%) (88.48%) (2.30%) 128
genes were upregulated expressed and 85 genes were downregulated 882,404 expressed
39,930,744 as compared
951,660 with
QNF11-16c 44,926,024 47.93% 93.65%
the non-ricey parent QNF11-16 (Figure 3; Table S2). (91.00%) (88.88%) (2.12%)
Figure 3. Scatter diagram of the differentially expressed genes. The green dots represent downregulated
Figurethe3.red
genes, Scatter diagram upregulated
dots represent of the differentially
genes, andexpressed
the blackgenes. The green
dots represent dots represent
non-differentially
downregulated
expressed genes. genes, the red dots represent upregulated genes, and the black dots represent
non-differentially expressed genes.
2.4. Identification of Candidate Genes
2.4. Identification of Candidate Genes
Out of the 29 genes identified by genetic mapping, only Bo4g024850 encoding an MADS-box
proteinOut SOC1 of the 29 genesofidentified
(suppressor by genetic
overexpression mapping,
of CO1), showed only Bo4g024850
significantly encoding
different an MADS-box
expression levels
proteintwo
between SOC1 (suppressor
parents. of overexpression
The corresponding of CO1),
SNP (coded showed
as SNP-5) significantly
located different
at the upstream expression
of Bo4g024850,
levels
and betweenposition
its physical two parents. Thebp
(4,029,234 corresponding SNPclose
on C04) was very to ∆(SNP-index)
(coded as SNP-5) located
peakedatfor
thethe
upstream
riceynessof
Bo4g024850,
trait (Figure 2).and its also
It has physical
beenposition
reported(4,029,234 bp on C04)ofwas
that overexpression SOC1 very close
(also to Δ(SNP-index)
known as AGL20) notpeaked
only
for the riceyness
suppressed the latetrait (Figure of
flowering 2).plants
It has that
also had
beenfunctional
reported that
FRI overexpression
and FLC allelesofbut SOC1
also(also known
promoted
as AGL20)
flowering andnotinflorescence
only suppressed the late
meristem flowering
identity of plants
in A. thaliana that had
[17,18]. functional
Thus, FRI was
Bo4g024850 and presumed
FLC alleles
to be the most likely candidate gene responsible for the riceyness phenotype, and the morphological
Int. J. Mol. Sci. 2020, 21, x; doi: FOR PEER REVIEW www.mdpi.com/journal/ijms
difference of curd between two parents possibly resulted from the upstream SNP-5, which could have
functions of regulating the expression levels of Bo4g024850.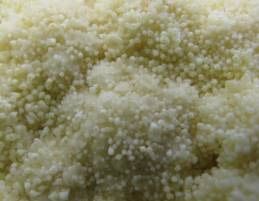
phenotype (Table 4). Furthermore, we further validated the expression levels of Bo4g024850 using
qRT-PCR in curd tissues of different curd developmental stages (1, 15, 30, and 45 days post curding,
respectively) of QNF11-3 and QNF11-16. The expression levels of Bo4g024850 in QNF11-3 and
QNF11-16 were increasing continuously along with the curd development (Figure 5). For samples
from     oneSci.
Int. J. Mol.  day  and
                 2020, 21,15  days post curding, the expression level of Bo4g024850 in QNF11-3 was higher
                           1999                                                                                       6 of 11
than that in QNF11-16, which were consistent with results of RNA-seq analysis. However, opposite
results were gained during the other two sampling periods (Figure 5).
        In order to reconfirm our assumption, a specific primer pair (Table 3) was designed to amplify the
target fragment      including
                   Table          SNP-5ofinthe
                           3. Sequences      two  parents
                                                primers    and
                                                         used to the otherthe
                                                                  amplify   10fragment
                                                                               cauliflower    inbred
                                                                                         flanking     lines. The purified
                                                                                                   SNP-5.
PCR products were sequenced using the Sanger method. Sequencing results showed that this C-to-T
                            Primer Sequences                      Products         Initial          Terminal
transversion existed widely within the plant materials we detected, and the genotypes were perfectly
               Forward (5′-3′)            Reverse (5′-3′)          Length         Position           Position
matchedCTGATGTTGAGA
             to the riceyness phenotype        (Figure
                                      AGGGAGTAGTAA
                                                        4 and  Table  4). Similarly,  another   SNP   (SNP-3) located at
gene coding       sequences of a functionally                      266 bp       4,029,130  bp      4,029,395
                                                   uncharacterized gene (Bo4g023880) was also detected       bp among
             AACGTCTAATGC              GTTTTGATGTTTC
these materials, but it did not show a clear correlation between genotype and phenotype (Table 4).
Furthermore,       we further
         Table 4. Allelic        validated
                           variation of SNP-5theamong
                                                 expression
                                                       cauliflower    of Bo4g024850
                                                              levelsbreeding           usingin
                                                                              lines detected   qRT-PCR     in curd
                                                                                                 the present  study.tissues
of different curd developmental stages (1, 15, 30, and 45 days post curding, respectively) of QNF11-3
                                                                              Genotype of         Genotype of
and QNF11-16.Accessions The expression     levels of Bo4g024850
                               Material Type           Phenotype in QNF11-3 and QNF11-16 were increasing
                                                                                  SNP-3               SNP-5
continuously along with the curd development (Figure 5). For samples from one day and 15 days post
              QNF11-3            Inbred line            Riceyness                  C/C                  T/T
curding, the     expression level
              QNF11-16               of Bo4g024850
                                 Inbred line          in QNF11-3 was higher than
                                                     Non-riceyness                 G/G that in QNF11-16,
                                                                                                       C/C which were
consistent ZA3005
               with results of RNA-seq
                                   DH line analysis.    However, opposite results
                                                     Non-riceyness                 C/C were gainedC/C    during the other
two sampling        periods (Figure
              ZA4279-1           Inbred5).
                                        line            Riceyness                  G/G                  T/T
          ZA18601         Inbred line           Non-riceyness             G/G            C/C
               Table 3. Sequences
          ZA221-6                 of the primers
                          Inbred line             used to amplify the fragment
                                                Non-riceyness             G/G flanking SNP-5.
                                                                                         C/C
           ZA4260         Inbred line            Riceyness                C/C             T/T
                Primer Sequences
           ZA4257         Inbred line           Non-riceyness             C/GInitial       Terminal
                                                                                         C/C
                                                   Products Length
               (50 -30 )                                                    Position       Position
       Forward
           ZA4101         Inbred line (50 -30 ) Non-riceyness
                             Reverse                                      C/G            C/C
          ZA3201-1
      CTGATGTTGAGA          DH line
                          AGGGAGTAGTAA          Non-riceyness             G/G            C/C
         ZA3203-61          DH line                     266 bp
                                                 Riceyness                4,029,130
                                                                          C/C        bp  4,029,395
                                                                                          T/T      bp
      AACGTCTAATGC GTTTTGATGTTTC
          ZA4715-1        Inbred line           Non-riceyness             G/G            C/C

       Figure 4. Identification of CC and TT genotype in parents and other breeding lines. Red arrows indicate
      Figure  4. Identification
       the position of SNP-5. of CC and TT genotype in parents and other breeding lines. Red arrows
      indicate the position of SNP-5.
        Table 4. Allelic variation of SNP-5 among cauliflower breeding lines detected in the present study.
Int. J. Mol. Sci. 2020, 21, x; doi: FOR PEER REVIEW                                            www.mdpi.com/journal/ijms
                                                                              Genotype of           Genotype of
        Accessions          Material Type              Phenotype
                                                                                SNP-3                 SNP-5
         QNF11-3              Inbred line              Riceyness                  C/C                    T/T
        QNF11-16              Inbred line             Non-riceyness               G/G                    C/C
         ZA3005                 DH line               Non-riceyness               C/C                    C/C
        ZA4279-1              Inbred line              Riceyness                  G/G                    T/T
         ZA18601              Inbred line             Non-riceyness               G/G                    C/C
         ZA221-6              Inbred line             Non-riceyness               G/G                    C/C
         ZA4260               Inbred line              Riceyness                  C/C                    T/T
         ZA4257               Inbred line             Non-riceyness               C/G                    C/C
         ZA4101               Inbred line             Non-riceyness               C/G                    C/C
        ZA3201-1                DH line               Non-riceyness               G/G                    C/C
        ZA3203-61               DH line                Riceyness                  C/C                    T/T
        ZA4715-1              Inbred line             Non-riceyness               G/G                    C/C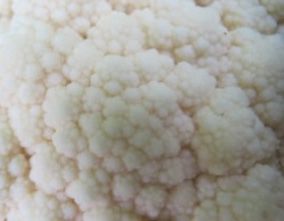
Int. J. Mol. Sci. 2020, 21, 1999 7 of 11
Int. J. Mol. Sci. 2020, 21, x FOR PEER REVIEW 7 of 11
* *
*
*
Figure 5. Expression levels of Bo4g024850 between QNF11-3 and QNF11-16 at different curd
Figure 5. Expression levels of Bo4g024850 between QNF11-3 and QNF11-16 at different curd
developmental stages. The X-axis represents the sampling period (days post curding, DPC). Error bars
developmental stages. The X-axis represents the sampling period (days post curding, DPC). Error
represent standard errors derived from three replications and asterisks represent significant differences
bars represent standard errors derived from three replications and asterisks represent significant
(* p < 0.05).
differences (* p < 0.05).
3. Discussion
3. Discussion
Riceyness is one of the major quality defects of cauliflower curds. Biologists and breeders have
Riceyness
been trying to find is one of theways
effective major toquality
geneticallydefects of cauliflower
improve curds. Biologists
this undesirable trait. Herein, andwe breeders
used a havepair
been trying to find effective ways to genetically improve this undesirable
of ricey and non-ricey sister lines to identify the genomic regions and candidate genes responsible trait. Herein, we used a
pair
for theofriceyness
ricey and non-ricey
trait. The resultssister lines should
gained to identify the genomic
be helpful to understand regions theand candidate
genetic mechanism genes
responsible for the riceyness trait. The results gained should
regulating riceyness, and to facilitate the molecular improvement on cauliflower curds. be helpful to understand the genetic
mechanism
BSA-seqregulating riceyness,
analysis revealed and to
a total of facilitate the molecular
22 SNPs related improvement
to riceyness, which gave on cauliflower curds.
a clear indication
BSA-seq analysis revealed a total of 22 SNPs related to riceyness,
for candidate genes identification. Similarly, only 213 DEGs between two parents were identified via which gave a clear indication
for candidate genes
transcriptome identification.
sequencing. Similarly,
This number is faronly
less213 DEGs
than that between
gained intwo parents
several were
recent identified via
transcriptome
transcriptome
studies on Brassica sequencing. This number
oleracea species [19,20],isbut farsimilar
less than that306
to the gained
DEGsinuncovered
several recent betweentranscriptome
a pair of
studies on Brassica oleracea species [19,20], but similar to the 306 DEGs
near-isogenic lines of cotton [21]. Such a limited number of candidate SNPs and DEGs were attributed uncovered between a pair of
near-isogenic lines of cotton [21]. Such a limited number of candidate
to the highly uniform genetic background between two parents, which could have filtered out a lot SNPs and DEGs were
of
attributed to the highly uniform genetic background between two parents,
false positives, and therefore significantly enhanced the efficiency of BSA-seq and RNA-seq analysis. which could have filtered
out By
a lot of false
using BSA-seq positives,
analysis, and19 therefore
SNPs located significantly
at upstream, enhanced
downstream,the efficiency of BSA-seq
or intergenic regionsand of
RNA-seq
function analysis.
genes and three SNPs located at gene coding sequences were identified. The three SNPs located
at geneBycoding
using BSA-seq
sequences analysis,
resulted19inSNPs located
missense at upstream,
variants downstream,
in Bo4g023880, or intergenic
Bo4g026630, regions of
and Bo4g026830,
function genes and three SNPs located at gene coding sequences
respectively. We could not exclude these three genes as candidates, although there were no obvious were identified. The three SNPs
located at level
expression gene differences
coding sequences
of them resulted
between in themissense
two parents. variants
However,in Bo4g023880,
gene annotation Bo4g026630,indicatedand
Bo4g026830, respectively. We could not exclude these three genes
that Bo4g026630 and Bo4g026830 encoded a myosin-11 protein and inorganic phosphate transporter as candidates, although there were
no obvious
1–4-like expression
proteins, level differences
respectively, which seemed of themhardbetween the two
to associate withparents.
riceyness. However, geneBo4g023880
In contrast, annotation
indicated
was that Bo4g026630
a functionally and Bo4g026830
uncharacterized gene, and encoded
then was a myosin-11
regarded asproteina candidateand inorganic
gene together phosphate
with
transporter 1–4-like proteins, respectively, which seemed hard
Bo4g024850. Nevertheless, the SNP existing in Bo4g023880 (SNP-3) did not show a correlation with to associate with riceyness. In
contrast, phenotype
riceyness Bo4g023880among was a the
functionally
other breedinguncharacterized
lines (Tablegene, and then
4). Jointly, as thewas regarded as
orthologous genea candidate
of SOC1
gene together with Bo4g024850. Nevertheless, the SNP existing in Bo4g023880
in Brassica oleracea, Bo4g024850 was presumed as the candidate gene responsible for the riceyness. (SNP-3) did not show In
a correlation
any with riceyness
case, this assumption needs phenotype
to be verifiedamong the other
via further finebreeding
mappinglines (Table 4). analysis.
and transgenic Jointly, as the
orthologous
As one ofgene of SOC1
the floral in Brassica
integrator genes,oleracea,
SOC1 plays Bo4g024850 was presumed
an important role during asthetheprocess
candidate gene
of phase
responsible for the riceyness. In any case, this assumption needs
transition in plants from vegetative to the reproductive stage [22]. The overexpression of SOC1 to be verified via further fine
mapping and transgenic analysis.
resulted in early flowering, whereas soc1 mutant plants showed later flowering than the wild type
As onethaliana
Arabidopsis of the floral
[18]. A integrator
series of genes,
studiesSOC1 haveplays an important
also revealed role during
that SOC1 the process of phase
is a multifunctional gene
transition in plants from vegetative to the reproductive stage [22].
which not only triggers the floral transition but also regulates floral patterning and floral meristem The overexpression of SOC1
resulted in early
determinancy flowering,
[23–25]. SOC1 whereas
is knownsoc1 mutant
to induce plants
floral showedidentity
meristem later flowering
gene LFYthan the wild
expression at type
the
Arabidopsis thaliana [18]. A series of studies have also revealed that
shoot apex, thus promoting the establishment and maintenance of floral identity in emerging floral SOC1 is a multifunctional gene
which not[22,26].
meristems only triggersHowever, the SOC1
floral does
transition but alsohigh
not maintain regulates floralthroughout
expression patterning the andwhole
floralflowering
meristem
determinancy
process. In contrast[23–25].to SOC1 is known to
the maintained induce
strong SOC1floral meristem
signals identity
within gene LFY expression
the inflorescence meristem, at its
the
shoot apex, thus promoting the establishment and maintenance of floral
expression in developing young floral meristems and stage one and two flowers is turned off [27,28]. identity in emerging floral
meristems [22,26]. However, SOC1 does not maintain high expression throughout the whole
flowering process. In contrast to the maintained strong SOC1 signals within the inflorescence
Int. J. Mol. Sci. 2020, 21, x; doi: FOR PEER REVIEW www.mdpi.com/journal/ijmsInt. J. Mol. Sci. 2020, 21, 1999 8 of 11
It is suggested that SOC1 is repressed by multiple factors including AP1 [23] and SEP3 [29], when the
floral meristem identity has been established and maintained. In the present study, it is interesting to
note that the expression signal of Bo4g024850 in QNF11-3 was stronger than that in QNF11-16 during
early curd development (1DPC and 15 DPC), but weaker during late curd development (30 DPC and 40
DPC). This trend is consistent with previous research results, because there has already been a mass of
floral meristems and flower buds on the curd surface in QNF11-3 but only inflorescence meristems in
QNF11-16 (Figure 2), indicating that floral identity in QNF11-16 has not been established. Furthermore,
the candidate SNP-5 located at about 4000 bp upstream of Bo4g024850 transcription start site. The
mechanism of SNP-5 long distance regulating Bo4g024850 expression in cauliflower curd riceyness is
also an interesting issue to be explored.
Curd riceyness is not only an economical factor in cauliflower production, but also a special form
of plant flowering regulation. The candidate loci and genes uncovered in the present study provide
powerful tools for cauliflower molecular breeding and enrich people0 s understanding of the regulatory
network controlling plant flowering.
4. Materials and Methods
4.1. Plant Materials and Phenotype Determination
”Qingnong65” is a cauliflower commercial cultivar widely cultivated in China. When the
temperature during the curd development period is below 12 ◦ C, its curd shows different degrees of
riceyness. QNF11-3 and QNF11-16 are a pair of sister lines generated from an individual of an F7
inbred line originated from “Qingnong65” (Figure S2). This pair of sister lines show high uniformity
in agronomic traits and genetic background but significantly morphological differences in riceyness
tolerance, especially at low temperatures. In a multiple years and sites phenotype survey, QNF11-3
showed riceyness curd, whereas QNF11-16 showed smooth curd (Figure 1). F1 plants were generated by
reciprocal cross between QNF11-3 (female/male) and QNF11-16 (male/female). A single F1 individual
from the cross of QNF11-16 (female) and QNF11-3 (male) was, then, used to produce F2 and BC1
populations. All the entries were seeded in growing matrix on 10 October, 2018. Then, 25-day seedlings
were planted into a greenhouse in Haining County (HN, 30◦ 320 N, 120◦ 410 E) with 50 cm row spacing
and 65 cm line spacing. When the curd diameter reached 10 cm, the phenotype of each individual was
identified by visual observation and classified as “riceyness” and “non-riceyness”.
4.2. Genomic DNA Isolation and Bulking
On the basis of the phenotype determination, 38 individuals showing remarkable riceyness and 50
individuals with unambiguous non-riceyness curd from the F2 population were selected to construct
the extreme phenotype bulks for BSA-seq. Genomic DNA of these F2 individuals and parents was
isolated from fresh leaves using a DNA Secure Plant Kit (Tiangen, Beijing, China). DNA concentration
and quality were measured by an ND-1000 spectrophotometer (NanoDrop, Wilmington, DE, USA)
and electrophoresis on 1.0% agarose gel with a standard lambda DNA. Riceyness bulk (bulk-R) and
non-riceyness bulk (bulk-N) were then constructed by pooling equal quantity of DNA from 38 riceyness
individuals and 50 non-riceyness individuals.
4.3. Genome Sequencing and Analysis
The BSA-seq was performed on the Illumina HiSeq X10 platform (Oebiotech, China) following
the detailed procedure as described by Wang et al. (2018). After filtering the low-quality raw data
using NGSQC toolkit software, the clean reads of bulk-R and bulk-N were aligned to the Brassica
oleracea reference genome sequence (https://www.ncbi.nlm.nih.gov/ assembly/GCF_000695525) using
BWA software. SAM tools were used to perform single-nucleotide polymorphism (SNP) calling.
The SNP-index and ∆(SNP-index) were calculated to identify candidate regions associated with the
riceyness trait [30].Int. J. Mol. Sci. 2020, 21, 1999 9 of 11
The SNP ratio (the ratio of reads number different from the reference base to the total reads
number at this locus) of each SNP detected within the candidate region were calculated for bulk-R,
bulk-N, and two parents, respectively. On the basis of the genetic analysis of riceyness in F2 and BC1
population, a monogenic inheritance model was used to identify the putative SNPs associated with
riceyness. The criterion is that SNP ratio should be higher than 0.9 for QNF11-3, higher than 0.5 for
bulk-R, lower than 0.1 for QNF11-16, and lower than 0.2 for bulk-N [31].
4.4. RNA-Seq Analysis
The curd tissue of parental line QNF11-3 and QNF11-16 was respectively collected at the early
curding stage (1 day post curding), to isolate total RNA using a Plant RNA Mini Kit (Tiangen, Inc.,
China). Three biological replicates were performed for each sample (T01, T02, and T03 for QNF11-3;
T04, T05, and T06 for QNF11-16). A total amount of 1 µg purified RNA per sample was subjected to
construct the cDNA libraries using a NEBNext UltraTM RNA Library Prep Kit for Illumina (NEB, Inc.,
USA). The library quality was assessed on the Agilent Bioanalyzer 2100 system (Agilent Technologies,
Inc., Santa Clara, CA, USA).
The six library preparations were subsequently sequenced on an Illumina HiSeq2500 platform and
paired-end reads were generated. Data analysis was performed following the procedures described
by Jian et al. (2019) [32]. Generally, then, the high-quality reads were mapped to the Brassica oleracea
reference genome sequence using HISAT2; only reads with a perfect match or one mismatch were
further analyzed and annotated based on the reference genome. Gene expression levels were estimated
by fragments per kilobase of transcript per million fragments mapped (FPKM). Differential expression
analysis between two parental lines was performed using the DEseq. The resulting p values were
adjusted using the Benjamini and Hochberg’s approach for controlling the false discovery rate. Genes
with an adjusted p-value < 0.05 found by DEseq were assigned as differentially expressed [33].
Significant differentially expressed genes (DEGs) were determined based on a threshold of 1.2-fold
expression change.
For qRT-PCR, specific primers (50 -acaaactgagcagcccaagca-30 and 50 -ctcgtcgtcgcctcttccac-30 ) were
designed based on the cDNA sequence of SOC1. qRT-PCR was conducted in an ABI StepOne-Plus
machine using SYBR®Premix Ex Taq™ (TaKaRa, Shiga, Japan). The detailed reaction system and PCR
procedure was performed as that described by our previous paper [34]. The 2−∆Ct value was used to
measure the relative expression levels for putative SNPs validation.
In order to further validate if the putative SNPs were associated with riceyness phenomenon,
putative SNPs were detected in two parents and other 10 cauliflower inbred lines (saved in Zhejiang
academy of agricultural sciences) using the Sanger sequencing method. The 250 bp sequences flanking
each candidate SNP on either side were used to design the PCR primers. The purified PCR products
were sequenced following the chain termination protocol at Sangon Biotech (Shanghai) Co., Ltd.
Availability of Supporting Data: All the sequence data generated in this research was deposited in the Sequence
Read Archive database (www.ncbi.nlm.nih.gov/sra) at the NCBI (National Center for Biotechnology Information)
under accession numbers: SRR9663134, SRR9663135, SRR9663136, SRR9663137, SRR9663138, SRR9663139 for
BSA-seq and SRR9703244, SRR9703245, SRR9703246, SRR9703247 for RNA-seq.
Supplementary Materials: Supplementary materials can be found at http://www.mdpi.com/1422-0067/21/6/1999/
s1. Figure S1: Normal cauliflower curd (A) and typical ricey curd (B), Figure S2: A pedigree diagram of QNF11-33
and QNF11-16, Table S1: Detailed informations of the cadidate SNPs and corresponding genes, Table S2: All the
differentially expressed genes and their expresion levels in six samples.
Author Contributions: Conceptualization, Z.Z. and H.G.; Methodology, Z.Z.; Validation, Z.Z., H.G., and
X.S.; Formal analysis, X.S.; Data investigation and analysis, Z.Z., Y.S., J.W., and H.Y.; Resources, Z.Z., X.S.;
Writing—original draft preparation, Z.Z.; Writing—review and editing, Z.Z., H.G. All authors have read and
agreed to the published version of the manuscript.
Funding: This work is supported by the Ministry of Science and Technology of the People’s Republic of China for
key research and development plan (2017YFD0101805), key projects of international scientific and technological
innovation cooperation between governments (2017YFE0114500), the National Natural Science Foundation ofInt. J. Mol. Sci. 2020, 21, 1999 10 of 11
China (31501768), the Science and Technology Department of Zhejiang Province for Key Agriculture Development
Project (2016C02051-5) and Zhejiang Academy of Agricultural Sciences for subject construction (A1).
Conflicts of Interest: The authors have no conflicts of interest to declare.
References
1. Watts, L.E. Conformation of cauliflower curds. Euphytica 1966, 15, 111–115.
2. Carr, S.M.; Irish, V.F. Floral homeotic gene expression defines developmental arrest stages in Brassica oleracea
vars. botrytis and italica. Planta 1997, 201, 179–188. [PubMed]
3. Ridge, S.; Brown, P.; Hecht, V.; Driessen, R.; Weller, J. The role of boflc2 in cauliflower (Brassica oleracea var.
botrytis L.) reproductive development. J. Exp. Bot. 2015, 66, 125–135. [PubMed]
4. Ferrandiz, C. Redundant regulation of meristem identity and plant architecture by FRUITFULL, APETALA1
and CAULIFLOWER. Development 2000, 127, 725–734. [CrossRef] [PubMed]
5. Kempin, S.; Savidge, B.; Yanofsky, M. Molecular basis of the cauliflower phenotype in Arabidopsis. Science
1995, 267, 522–525. [CrossRef] [PubMed]
6. Kieffer, M.; Fuller, M.P.; Jellings, A.J. Explaining curd and spear geometry in broccoli, cauliflower and
romanesco: Quantitative variation in activity of primary meristems. Planta 1998, 206, 34–43. [CrossRef]
7. Blümel, M.; Dally, N.; Jung, C. Flowering time regulation in crops-what did we learn from Arabidopsis? Curr.
Opin. Biotech. 2015, 32, 121–129. [CrossRef]
8. Watts, L.E. Investigations on the inheritance and responses to selection of riceyness in early summer
cauliflower. Euphytica 1966, 15, 90–98.
9. Bowman, J.L.; Alvarez, J.; Weigel, D.; Meyerowitz, E.M.; Smyth, D.R. Control of flower development in
Arabidopsis thaliana by APETALA1 and interacting genes. Development 1991, 119, 721–743.
10. Smith, L.B.; King, G.J. The distribution of BoCAL-a alleles in Brassica oleracea is consistent with a genetic
model for curd development and domestication of the cauliflower. Mol. Breed. 2000, 6, 603–613. [CrossRef]
11. Duclos, D.V.; Björkman, T. Meristem identity gene expression during curd proliferation and flower initiation
in Brassica oleracea. J. Exp. Bot. 2008, 59, 421–433. [CrossRef] [PubMed]
12. Purugganan, M.D.; Boyles, A.L.; Suddith, J.I. Variation and selection at the CAULIFLOWER floral homeotic
gene accompanying the evolution of domesticated Brassica oleracea. Genetics 2000, 155, 855–862. [PubMed]
13. Cao, W.J. Study of Mechanism on Regulation of Curd Development. Ph.D. Thesis, Shanghai Institutes for
Biological Sciences, Chinese Academy of Sciences, Shanghai, China, 2005.
14. Chittora, A.; Singh, D.K. Genetic variability studies in early cauliflower (Brassica oleracea var. botrytis L.).
Electron. J. Plant Breed. 2015, 6, 842–847.
15. Dey, S.S.; Bhatia, R.; Sharma, S.R.; Parkash, C.; Sureja, A.K. Effects of chloroplast substituted Ogura male
sterile cytoplasm on the performance of cauliflower (Brassica oleracea var. botrytis L.) F1 hybrids. Sci. Hortic.
2013, 157, 45–51. [CrossRef]
16. Kumar, S.; Sharma, J.P.; Rattan, P.; Chopra, S.; Kumar, S. Evaluation of exotic introductions of cauliflower
(Brassica oleracea var. botrytis L.) for yield and quality traits. J. Environ. Prot. Ecol. 2009, 27, 433–435.
17. Lee, H. The agamous-like 20 mads domain protein integrates floral inductive pathways in Arabidopsis. Genes
Dev. 2000, 14, 2366–2376. [CrossRef]
18. Yu, H.; Ito, T.; Wellmer, F.; Meyerowitz, E.M. Repression of agamous-like 24 is a crucial step in promoting
flower development. Nat. Genet. 2004, 36, 157–161. [CrossRef]
19. Kim, Y.W.; Jung, H.J.; Park, J.I.; Hur, Y.; Nou, I.S. Response of NBS encoding resistance genes linked to both
heat and fungal stress in Brassica oleracea. Plant Physiol. Biochem. 2015, 86, 130–136. [CrossRef]
20. Yan, C.; An, G.H.; Zhu, T.; Zhang, W.; Peng, L.; Chen, J.; Kuang, H. Independent activation of the BOMYB2
gene leading to purple traits in Brassica oleracea. Theor. Appl. Genet. 2019, 132, 895–906. [CrossRef]
21. Jiang, P.; Lu, C.; Zou, C.; Cheng, H.; Yang, W.; Feng, X.; Zhang, Y.; Wang, Q.; Song, G. Analysis of differentially
expressed genes from glandless near-isogenic lines of cotton. Cotton Sci. 2015, 27, 506–514.
22. Lee, J.; Lee, I. Regulation and function of SOC1, a flowering pathway integrator. J. Exp. Bot. 2010, 61,
2247–2254. [CrossRef] [PubMed]
23. Liu, C.; Zhou, J.; Bracha-Drori, K.; Yalovsky, S.; Ito, T.; Yu, H. Specification of Arabidopsis floral meristem
identity by repression of flowering time genes. Development 2007, 134, 1901–1910. [CrossRef] [PubMed]Int. J. Mol. Sci. 2020, 21, 1999 11 of 11
24. Liu, C.; Xi, W.; Shen, L.; Tan, C.; Yu, H. Regulation of floral patterning by flowering time genes. Dev. Cell
2009, 16, 711–722. [CrossRef] [PubMed]
25. Melzer, S.; Lens, F.; Gennen, J.; Vanneste, S.; Rohde, A.; Beeckman, T. Flowering-time genes modulate
meristem determinacy and growth form in Arabidopsis thaliana. Nat. Genet. 2008, 40, 1489–1492. [CrossRef]
[PubMed]
26. Parcy, F.; Bomblies, K.; Weigel, D. Interaction of leafy, agamous and terminal flower1 in maintaining floral
meristem identity in Arabidopsis. Development 2002, 129, 2519–2527. [PubMed]
27. Borner, R.; Kampmann, G.; Chandler, J.; Gleissner, R.; Wisman, E.; Apel, K.; Melzer, S. A MADS domain gene
involved in the transition to flowering in Arabidopsis. Plant J. 2000, 24, 591–599. [CrossRef]
28. Samach, A. Distinct roles of CONSTANS target genes in reproductive development of Arabidopsis. Science
2000, 288, 1613–1616. [CrossRef]
29. Richard, G.H.; David, P.; Silvia, F.; Felix, O.; Kerstin, K.; Felipe, L. Characterization of SOC1’s central role in
flowering by the identification of its upstream and downstream regulators. Plant Physiol. 2013, 162, 2151.
30. Wang, N.; Liu, Z.; Zhang, Y.; Li, C.; Feng, H. Identification and fine mapping of a stay-green gene (Brnye1) in
pakchoi (Brassica campestris L. ssp. chinensis). Theor. Appl. Genet. 2018, 131, 673–684. [CrossRef]
31. Abe, A.; Kosugi, S.; Yoshida, K.; Natsume, S.; Takagi, H.; Kanzaki, H. Genome sequencing reveals
agronomically important loci in rice using MutMap. Nat. Biotechnol. 2012, 30, 174–178. [CrossRef]
32. Jian, H.; Zhang, A.; Ma, J.; Wang, T.; Liu, L. Joint QTL mapping and transcriptome sequencing analysis reveal
candidate flowering time genes in Brassica napus L. BMC Genom. 2019, 20, 21. [CrossRef] [PubMed]
33. Love, M.I.; Huber, W.; Anders, S. Moderated estimation of fold change and dispersion for RNA-seq data
with deseq2. Genome Biol. 2014, 15, 550. [CrossRef] [PubMed]
34. Sheng, X.G.; Zhao, Z.Q.; Wang, J.S.; Yu, H.F.; Shen, Y.S.; Zeng, X.Y.; Gu, H.H. Genome wide analysis
of mads-box gene family in Brassica oleracea reveals conservation and variation in flower development.
BMC Plant Biol. 2019, 19, 106. [CrossRef] [PubMed]
© 2020 by the authors. Licensee MDPI, Basel, Switzerland. This article is an open access
article distributed under the terms and conditions of the Creative Commons Attribution
(CC BY) license (http://creativecommons.org/licenses/by/4.0/).You can also read