Comparative Evaluation of the EEG Performance Metrics and Player Ratings on the Virtual Reality Games
←
→
Page content transcription
If your browser does not render page correctly, please read the page content below
Comparative Evaluation of the EEG Performance
   Metrics and Player Ratings on the Virtual Reality
                       Games
               Pratheep Kumar Paranthaman∗ , Nikesh Bajaj† , Nicholas Solovey∗ , and David Jennings∗
                                 ∗ Departmentof Computer Science, Elon University, Elon, USA
                                   Email: {pparanthaman, nsolovey, djennings4}@elon.edu
          † School of Electronic Engineering and Computer Science, Queen Mary University of London, London, UK

                                                 Email: n.bajaj@qmul.ac.uk

   Abstract—The low-cost electroencephalogram (EEG) devices           [3]. Through the recorded brain activity from an EEG device,
are widely used by researchers in human-computer interaction,         several aspects of mental activities can be recorded such as
video games, and software systems to evaluate the impact of           activities on brain areas (frontal, parietal, occipital), muscle
interaction design on user emotions. However, the performance
metrics of emotion states provided by a low-cost EEG device           movements (eye blink, jaw clench), and frequency bands [3].
suffer several reliability and accuracy issues, which can mislead     The rise of low-cost portable EEG makers like Muse, Emotiv,
the design decisions of the developers. In this research, we          and Neurosky [4] has opened up potential research space
combined the EEG device with three virtual reality games to           for investigating user experience (based on cognitive states)
investigate the reliability of performance metrics extracted from     in several domains. However, the accuracy of low-cost EEG
the EEG data. We conducted the experiment with 14 players
using virtual reality games with ranging levels of in-game actions.   devices vary upon several aspects such as headset connectivity,
Our analysis shows that there is a significant difference between     sensor hydration, and device specifications. One study has
performance metrics provided by the EEG device and the actual         reported the maximum accuracy in the low-cost EEG device
players’ experience. Finally, we used ad-hoc linear models to         as 60.57% [5]. Another research study conducted by [6] com-
estimate the level of players’ emotion states directly from the       pared the accuracy in drowsiness detection from available low-
raw EEG. We also show the different brain activity maps for
individual emotions, which reveal the commonly known relation         cost EEG devices like Emotiv Epoc, the Neurosky MindWave,
between brain activity and specific emotions.                         the OpenBCI, and the InteraXon Muse and this study reported
   Index Terms—virtual reality, EEG, player emotions, brain           79.4% accuracy from OpenBCI [6].
activity map
                                                                      B. Research Aim
                       I. I NTRODUCTION                                  In this research work: 1) we combined VR and EEG to
   Virtual Reality (VR) games offer higher levels of immersion        evaluate the players’ emotion states during the gameplay
by combining audiovisual elements, haptic feedback, and               activity, and 2) we investigated the reliability of the perfor-
interactive gameplay mechanics. Extra care needs to be taken          mance metrics offered by Emotiv EPOC X EEG headset.
when it comes to designing games for VR, as some in-game              The performance metrics (PM) refers to the level of the
activities (frequent body movements and hand actions) in VR           six emotion states (engagement, excitement, stress, relaxation,
can lead to exertion and poor user experience. Specifically,          focus, and interest) provided by the Emotiv EPOC X head-
the action and first-person VR games can cause discomfort in          set as a score between 0 to 1. The process involved in
users [1]. So it is crucial to understand the players’ experience     computing these six PM is unknown to the developers due
in VR games, as it could be an informative aspect for designing       to the internal abstraction involved in Emotiv’s performance
user-centered VR games that are comfortable, engaging and             metrics algorithm. Since, there is an increased use of EEG-
safe for VR consumers. Therefore, in this paper, we decided           based analysis in number of studies in games research [7],
to examine the players’ emotion states in virtual reality games.      [8], it is crucial to check the reliability of these performance
                                                                      metrics (PM) values generated by the Emotiv ’s EEG device.
A. Low-Cost EEG Devices                                               Further it is also important to explore the algorithmic approach
   Our next step was to identify an objective method to capture       to compute these emotion states with increased reliability
players’ emotion states from VR games. One standard ap-               and transparency. We believe, that this study of reliability
proach to measure the objective experience of users is through        check and exploration of algorithmic approach can benefit the
understanding the brain activity using an Electroencephalo-           research community involving brain research and VR games.
gram (EEG) device. Low-cost portable EEG devices are non-                To achieve this goal of the PM reliability check, we plan to
invasive and can capture the electrical activity in the brain         track the players’ six emotion states in three VR game types
through the sensors that can be attached to the user’s head [2],      with ranging in-game activities from high-action to low-action.

   978-1-6654-3886-5/21/$31.00 ©2021 IEEE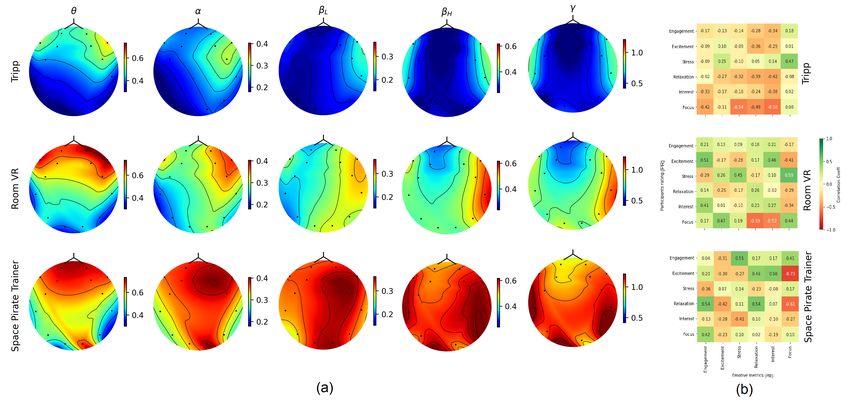
For this we selected adventure - exploration/puzzle-solving,     system was able to adapt accordingly towards the players’
action shooter, and relaxation/meditation game types in VR.      status. Similarly, in [13], DDA triggering algorithm was cre-
                                                                 ated in 3D person shooter game by incorporating an EEG
C. Research Question                                             device and in this system, the player excitement level was
   For determining the reliability of the EEG PM, we planned     monitored using the Emotiv Epoc headset and based on the
to compare the PM values computed by Emotiv with the player      excitement level the DDA was triggered. In [14] , the authors
ratings (PR) on gameplay experience. The player ratings (PR)     used OpenBCI low-cost EEG device to evaluate the players’
refer to the experience questionnaire, which we designed for     relaxation states based on presence and absence of sound in
the players to complete at the end of each VR game. The          Candy Crush and Geometry Dash.
PR questionnaire corresponds to the six emotional experience
questions related to the PM values in the three VR games.
To investigate this association between the EEG performance      B. Virtual Reality Applications and EEG Data Analysis
metrics (PM) and player ratings (PR), we framed the following
research question (RQ):                                             EEG devices are also being used along with the virtual real-
   RQ: Are there any differences between player ratings (PR)     ity applications to evaluate the cognitive load, player emotions,
and the EEG performance metrics (PM) scores provided by          and physical discomforts. However, combining VR and low-
the Emotiv EPOC X?                                               cost EEG devices can be challenging as the VR headset can
                                                                 affect the EEG sensor arrangement and can disturb the signal
D. Analysis and Evaluation                                       quality of EEG devices [15]. Specifically, the experiment
   We conducted a research study with 14 participants. Each      conducted by [15] found that EEG signals beyond 50Hz were
participant played the three VR games and during the game-       mainly affected by the intrusion of Head Mounted Displays
play we recorded their raw EEG, performance metrics (PM)         (HMDs).
scores, and frequency bands using the Emotiv EPOC X                 One study examined the ability to detect excitement in VR
headset. Later, we compared the player ratings (PR) and          applications through an EEG headset. Participants used both
performance metrics (PM). From the comparative analysis of       VR goggles and an EEG headset while being exposed to a VR
PM and PR, we found that PM and PR were different. This          roller-coaster application intended to induce excitement. The
gave us a scope to build an Ad-hoc Linear Model to explore the   researchers found that the deep learning approach with the
relationship between the brain activity, emotions, and PR. The   EEG provided a 96% accuracy rate of detecting excitement
Ad-hoc Linear model was developed based on associating the       [16]. Another study investigated possible differences between
PR values with the raw EEG data from the device and then         learning with VR and learning with a 2D display. The EEG
estimating the PM values (emotion states) from it. Through       data showed that learning in the VR environment resulted in a
our Ad-hoc Linear Model Algorithm, we can estimate the PM        higher cognitive workload. The higher workload is believed to
values directly from the raw EEG data.                           have had an influence over the test scores, which were lower
                                                                 for the VR users than the 2D display learners [17].
                    II. R ELATED W ORK
                                                                    The study conducted by [18] compared data results from
A. Gameplay Experience Evaluation and Game Design                an EEG headset and a self-reporting questionnaire in a study
through EEG                                                      regarding the effect of perspective in VR games on a player’s
   Ranging from practical applications in medicine and therapy   level of engagement.The study found that there were conflict-
to acting as a method of bolstering the entertainment value of   ing results between the data reported by the EEG and data
games, Brain-Computer Interfaces (BCI) technology exists in      reported by the questionnaire. The researchers suggested fur-
a multitude of fields to provide information on brain activity   ther study into comparing EEG and subjective data collection
[9], [10]. For analyzing gameplay experiences, low-cost non-     in VR games. In [19], the authors analyzed the correlations
invasive electroencephalogram (EEG) is a current focus in        between questionnaire and EEG data on physical discom-
research. EEG devices are widely used to evaluate the in-game    forts induced by VR gaming. The researchers found strong
experiences, comfort levels and emotions in video games [11],    correlations between the occurrence of physical discomforts
[12].                                                            and beta and theta waves, suggesting that EEG technology
   In the research activity carried out by [12], the authors     can accurately detect physical discomfort. The researchers
investigated the psychological aspects such as cognition, emo-   recommended possible uses of these correlations, such as
tion and player experience on three level design conditions      establishing an EEG warning system that can recommend
and the research findings highlight the fact on how gameplay     when players should take breaks.
experiences can be assessed using EEG. EEG systems can also         The related work highlights on the challenges in combining
be used in the dimension to incorporate Dynamic Difficulty       VR and EEG devices in experiments and the need for further
Adjustment in games. Notably in the research activity [11],      analysis in comparing EEG outcomes and subjective data
Dynamic Difficulty Adjustment (DDA) and Rhythm-Group             collection. These two points were of prime importance to our
theory aspects were implemented by combining the player’s        research study and we designed our research question and
performance and EEG data in a 2D platformer game and the         experiment to reflect on these aspects.
III. E XPERIMENT S ETUP C. Demographics Information
For this research study, we recruited 14 participants and Before the start of the experiment, we asked the participants
all the participants were graduate/undergraduate students. For to complete the research consent form and then to fill up a pre-
each participant, the research study lasted approximately be- test survey. In this pre-test survey, we collected data on age
tween 60 - 100 minutes. (M ean = 21.57; SD = 2.17), gender (male = 9 and female
= 5), favorite video game genre, expertise level in using a VR
A. Device Description device, VR games played from the given list, and whether
they are right/left handed. Out of 14 participants, 5 of them
In this experiment, we used the Emotiv EPOC X - 14
have never used a VR device, 2 of them have moderately used
channel wireless EEG Headset for recording the brain activity
VR devices and 7 of them have rarely used VR devices. In the
and Oculus Quest VR headset (All-in-one VR gaming). We
three games used in this experiment, 2 participants had already
used the Emotiv Pro Suite to access the raw EEG, low
played the Space Pirate Trainer before, and 1 participant had
resolution performance metrics data (six emotion states: ex-
played The Room VR: Dark Matter and Tripp before. The
citement, engagement, stress, interest, focus, and relaxation),
remaining 11 users were completely new to all the three games
and frequency bands from the EEG headset. Emotiv Pro was
used in the experiment.
installed on Dell Alienware M15 R3 and the Emotiv EPOC X
headset was paired to the Emotiv Pro via Bluetooth and the D. Process
realtime EEG data was monitored and recorded using Emotiv After the pre-test survey the participants were asked to wear
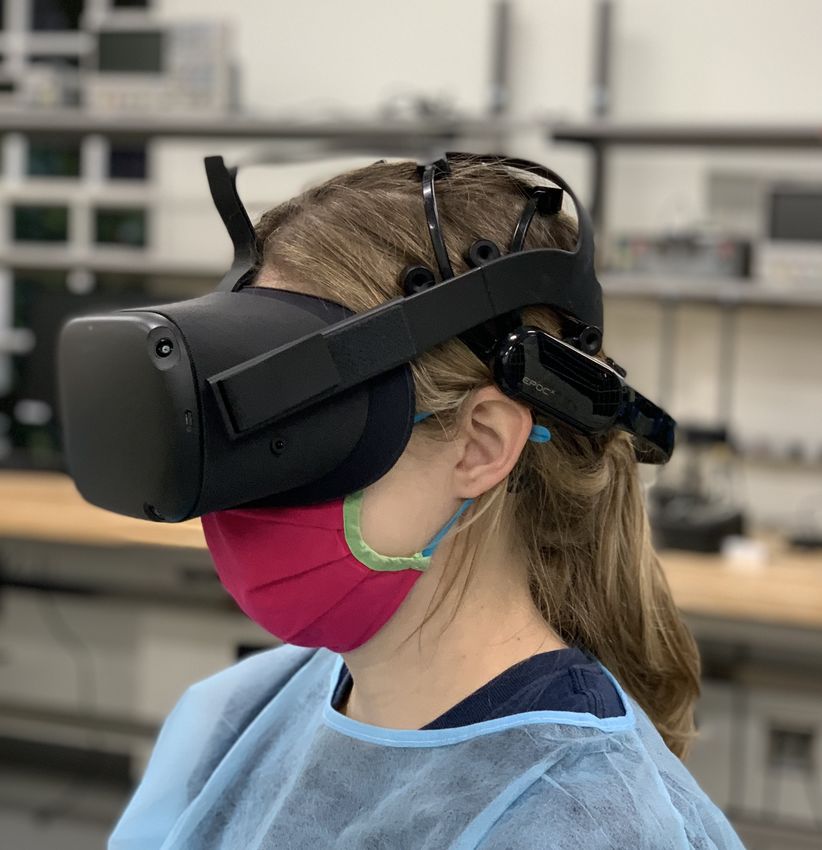
pro. the Emotiv EPOC X EEG headset. The research coordinator
helped the participants to adjust sensors of the EEG device to
B. VR Games Used in the experiment ensure better connectivity. We monitored the sensor connec-
We chose three VR games that would facilitate in triggering tion quality on the Emotiv Pro application. Once the better
the six PM values and the VR games used in this experiment connectivity (above 98% of sensor connection quality) of the
can be categorized into three types based on the in-game EEG device was established then the participants were given
actions involved and they are as follows: the Oculus Quest VR headset and this needs to be worn on
Space Pirate Trainer: Space Pirate Trainer is an arcade top of the EEG device (see Fig 1.(a)).
action shooter game, where the game mechanics involve The participants were given three VR games to play. Each
shooting, defending, and dodging. In the game, the player VR game was played approximately for 5 minutes with a 10
takes up a role of space shooter and each VR hand controller minute break in between the games. During the 10 minute
is equipped with a sci-fi gun and the player needs to fire at break, the participants removed the VR headset and relaxed
the enemies and dodge the enemy bullets either by blocking for a while. Also, in this 10 minute break, the participants
them by a shield or by tilting the body left or right. The game were asked to complete the player ratings (PR) questionnaire.
involves high action with more scope for continuous hand and In total, the participants filled one pre-test survey and three
body actions (such as aiming, shooting, and tilting the body PR questionnaires (one for each VR game that they played).
left or right). In addition to the surveys related to the experiment, we also
The Room VR: A Dark Matter: This is an adventure game followed the COVID safety screening procedure and in which,
involving the exploration and puzzle solving aspects. The the participants filled pre-screening (approximately 24 hours
player is thrown into a series of quests like solving puzzles before the experiment), on-site screening (before the start of
and interacting with game elements to uncover a mystery. the experiment) and a follow-up screening (approximately 24
The game mechanics involve grabbing, teleporting, reading - 48 hours after the experiment) surveys. Each participant
clues/texts, interacting with lockers, opening drawers, and was given a compensation of $10 Amazon gift card for
using keys. This game involves moderate actions, where there participating in this research study.
is only medium scope for continuous hand actions.
Tripp: Tripp is a relaxation and meditation game targeted
for providing emotional well-being through immersive VR
experience. The game involves simple breathing exercises
and gaze-based game mechanics (like selecting, moving, and
controlling the flight of the figures in game). Primary interac-
tion mechanics do not involve any hand interactions or body
movements compared to the other two games. So the in-game
actions in this game falls under low action category.
The three VR games used in this experiment were rated
to be as “comfortable” on the Oculus Store Comfort ratings (a) (b)
and these comfort ratings are measured based on camera Fig. 1. (a) A participant wearing VR and EEG headsets during the experiment
movements, player motions, disorienting contents and effects (b) Raw EEG plot (14-channel data) displayed on Emotiv Pro application
[20].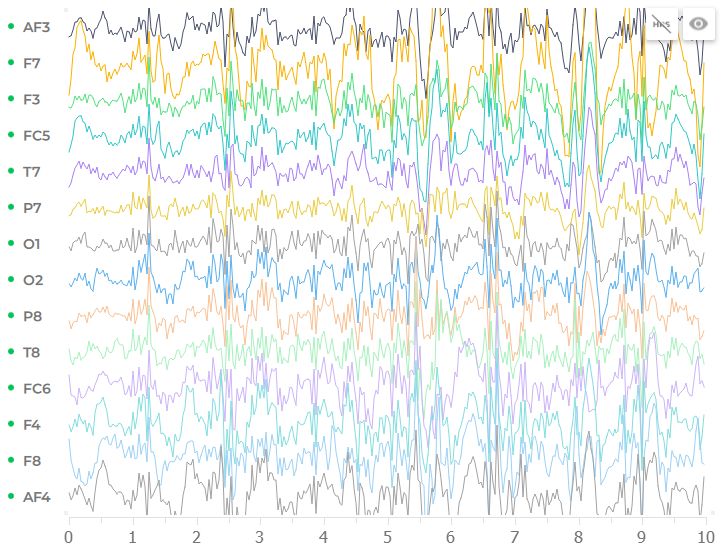
E. Data Collection                                                   for better contact quality, and 3) motion/muscle artifacts. In
   For each player, we randomized the sequence in which they         our case, for the 5 participants, the EEG signal quality dropped
played the three VR games and for this we used a randomizer          less than 100% during the experiment. In the cases where the
program. The EEG data in each game was recorded for 5                signal connectivity dropped , the PM values were also missed.
minutes and the recorded data was stored in the Emotiv Pro
                                                                     G. Data Processing
Suite and later it was exported to a csv file for additional
data processing. We recorded the following EEG data points              The scaled PM values from Emotiv range from 0 to 1 and
using the Emotiv EPOC X [21], [22]:                                  this is produced every 10 seconds (0.1 Hz). The PR values
                                                                     were scaled to match the range of PM (i.e) from 0 to 1.
Raw EEG: Raw EEG was captured at the rate of 128Hz                      For comparative analysis, first we computed the average
from the 14 channels (AF3, F7, F3, FC5, T7, P7, O1, 02,              of PM values for the entire game duration and considered
P8, T8, FC6, F4, F8, AF4) by the EEG headset (See Fig 1.(b)).        as final PM value for the game for a given emotional state.
                                                                     Secondly, we we mapped the PR to numerical values from
Performance Metrics (PM): The performance metrics (PM)               0 (Strongly Disagree) to 1 (Strongly Agree). Finally, we had
in the Emotiv EPOC X provides access to six emotion                  six PM and six PR values for each player for a game. While
states (engagement, excitement, stress, relaxation, focus and        computing statistics (Mean, SD, Correlation), the PR values
interest) of users. Based on the Emotiv’s documentation [21],        corresponding to PM values that were not available from the
all these six parameters are computed based on the mental            Emotiv were ignored. On some instances, the PM values were
activity acquired by the Emotiv headset in real time, but the        not available from Emotiv due to the internal mechanisms and
details/process of deriving the PM values from the mental            motion/muscle artifacts.
activity was not disclosed. The PM data was captured at the             Although the Emotiv provides the power of five frequency
rate of 0.1Hz.                                                       bands namely; Theta, θ (4 - 8 Hz), Alpha, α (8 - 12 Hz), Low-
   Each performance metric aspect holds a specific description       beta βL (12 - 16 Hz), High-beta βH (16 - 25 Hz) and Gamma
from the Emotiv’s documentation [21]. The aspect of stress           γ (25 - 45 Hz), for each sensor, the pre-processing techniques
is defined as overwhelming feeling and the fear of failure           applied on the EEG data are unknown to users/developers.
to satisfy the task needs. Engagement refers to immersion            Further, it is unknown if any effective artifact removal algo-
and the mixture of attention and concentration and the               rithm is applied to avoid misleading computations. Therefore,
excitement is the sense of awareness and is characterized as         to use the power of frequency bands for further analysis, we
positive physiological arousal. Interest is associated with the      used the raw EEG data recorded from Emotiv. The EEG data
level of attraction/aversion within a task and it is referred        was first, processed with an IIR high-pass filter of order 5 and
as valence. Low interest corresponds to aversion and high            cut-off frequency of 0.5 Hz, followed by an artifact removal
interest corresponds to affinity. Whereas the mid-ranged score       algorithm (ATAR) [23]. The power of each frequency band
in interest denotes a neutral state. Focus is defined as the fixed   was computed using Welch method.
attention on the given task and higher level of task switching
                                                                                    IV. R ESULTS AND D ISCUSSION
induces distraction. Relaxation is referred to as being in the
state of recovery from intense concentration [21].                      In this section, we firstly analyzed the EEG data between
                                                                     three VR games to understand whether the brain activity
Player Ratings (PR): The PR values were extracted through            produced by the games used in this experiment are stimulating
a questionnaire from the players after each VR game. The             different emotions. Secondly, we conducted an independent
questionnaire contained six questions and each question was          analysis on PM and PR to analyze the trends and variations
related to a particular emotion from PM. For example, one            of emotion states between the games. Thirdly, we performed
of the questions in the questionnaire was - “I felt excitement       a comparative analysis of PM and PR, to investigate the
when playing this game” and the players were asked to mark           reliability of the PM extracted by the EEG device. Finally,
their answer on a 5-point Likert scale. Likewise we had a            we used an Ad-hoc Linear Model to map the PR values with
question for each emotion state mentioned in PM (excitement,         raw EEG data.
engagement, stress, interest, focus, and relaxation).
                                                                     A. The VR Game types and their associated brain activity
F. Problems Encountered during the Data Recording Phase                We analyzed if the three VR games had produced different
   During the data recording process, our primary goal was           brain activities based on the recorded EEG data from the 14
to make sure that the EEG signal connectivity is 100% for            participants. So we compared the power of five frequency
all participants. There are several reasons in which the EEG         bands (namely: θ, α , βL , βH and γ) of each sensor and the
headset’s connectivity might drop less than 100% and in our          computation was performed as described in Section III-G. To
case we noticed three reasons for poor EEG signal quality: 1)        analyze aggregated brain activity in three games, the power
hair density - more hair could disturb/ break the connectivity       of each frequency band was averaged across participants. For
of sensor felts on the scalp, 2) hydration level of the sensor       each frequency band, the spatial density of power is obtained
felts - the sensor felts need to have good hydration at all times    by interpolating and extrapolating the values computed from
Fig. 2. (a) Topographic brain activity heatmap of average power band values of EEG data, across 14 participants, in five frequency bands (θ, α , βL , βH
and γ). For comparison, the heatmap is scaled across the frequency bands. (b) Correlation matrix(Spearman’s Rank Correlation) of six emotion states between
PM and PR
the sensors using a Bicubic method adapted from the MNE in Room VR were low compared to the Space Pirate Trainer.
library [24]. For the three game types, the spatial density of So our initial analysis on understanding the differences
power is plotted as a topographical map reflecting the average between the brain activity and VR game types showed that
brain activity in five frequency bands as shown in Fig 2 (a). these three VR games stimulate different brain regions with
varying level of brain activity. Therefore, the VR game types
Discussion: From Fig. 2 (a), it can be observed the three games used in this experiment have ranging in-game actions that
have different brain activities across the participants. In Fig. 2 correlate with our assumption on using the different game
(a), the higher brain activity is shown by red color and lower types in this experiment.
activity is shown by blue. Specifically, the game - Tripp, in-
volves less brain activity in all five frequency bands (θ, α , βL , B. Independent Analysis of PM and PR
βH and γ) and this indicates that Tripp game consists of low The EEG Performance Metrics (PM) Analysis: Table I
in-game activities compared to the Space Pirate Trainer and the shows the Mean and SD for the PM values extracted from
Room VR. Also, this low in-game activity in Tripp relates to the three VR games. It can be observed that there is no
the use of gaze-based interaction with slight head movement major difference in mean values of engagement, excitement
and without VR hand controllers/interactions. Looking into and focus across all the games. On the other hand, there is
the game Space Pirate Trainer, the frequency band θ shows a minor increment in stress, relaxation, and interest from
higher activity in pre-frontal cortex (the front part on the brain Tripp to Room VR, followed by Space Pirate Trainer. To
activity heatmap) compared to the Tripp and Room VR. This compare the emotion states between games, we conducted
indicates the fact that Space Pirate Trainer game comprises t-test and the results are shown in Table II. Firstly, as
higher executive brain functions (logical/reasoning) compared expected, there is no statistical significant difference observed
to others. This higher brain activity can be associated with the between the games in three performance metrics features
fast paced in-game hand actions involved in the Space Pirate - engagement, excitement, and focus. There is a statistical
Trainer and in addition to this the players were also required to significant difference between Tripp and Space Pirate Trainer
tilt their body frequently in the game. In the game Room VR, in the stress (p < 0.05). The relaxation shows a statistical
the frequency band θ shows activity in pre-frontal cortex and significant difference between all the three games. In the
this activity is higher compared to the Tripp. This indicates the interest, a statistical significant difference is noted between
fact that Room VR comprises moderate actions out of the three Room VR and Space Pirate Trainer (p < 0.05), and Tripp
games. This moderate pre-frontal cortex activity in the Room and Space Pirate Trainer (p < 0.01).
VR can be related with low to medium paced hand movements
such as grabbing items, opening lockers, and interacting with The Player Ratings (PR) Analysis: Table III displays the
scene objects. The frequency and the pace of hand movements Mean and SD for the PR values on six emotion states for theTABLE I ment, excitement, interest, and stress) reflect the differences in
M EAN ± SD OF THE EEG PM DATA FOR THE THREE VR GAMES the gameplay involved in three games. One important aspect
Engagement Excitement Stress that we noticed was the stress and relaxation hold an inverse
Tripp 0.67±0.1 0.4±0.18 0.3±0.12 relationship, which is a known aspect and correctly reflects in
Room VR 0.65±0.1 0.38±0.13 0.39±0.18 the PR analysis.
Space Pirate Trainer 0.67±0.1 0.4±0.2 0.49±0.2
Relaxation Interest Focus In this independent analysis of PM and PR, we found that
Tripp 0.25±0.1 0.53±0.07 0.42±0.09 PM values are not reflective of the activities involved within
Room VR 0.34±0.11 0.6±0.08 0.36±0.19 the game types. The PR values reflect the expected differences
Space Pirate Trainer 0.44±0.11 0.67±0.09 0.36±0.08
in game types and this highlights the association of players’
subjective emotions experienced within the game types are
TABLE II different.
P- VALUES OF T- TEST ( INDEPENDENT SAMPLES ) BETWEEN GAMES FOR
EACH CATEGORY OF SCORE FOR THE EEG PM DATA . *p < 0.05,
**p < 0.01, † p < 0.001. TABLE III
M EAN ± SD OF PR FOR THE THREE VR GAMES ( NORMALIZED )
Engagement Excitement Stress
Tripp - Room VR 0.7011 0.7241 0.211 Engagement Excitement Stress
Room VR - Space Pirate Trainer 0.8079 0.7003 0.2495 Tripp 0.75±0.23 0.46±0.21 0.18±0.17
Tripp - Space Pirate Trainer 0.8893 0.9573 0.0198* Room VR 0.86±0.16 0.61±0.21 0.46±0.23
Relaxation Interest Focus Space Pirate Trainer 0.98±0.06 0.91±0.12 0.52±0.29
Tripp - Room VR 0.0264* 0.0632 0.3655 Relaxation Interest Focus
Room VR - Space Pirate Trainer 0.0374* 0.045* 0.9226 Tripp 0.79±0.19 0.71±0.19 0.73±0.22
Tripp - Space Pirate Trainer 0.0001† 0.0004† 0.2158 Room VR 0.41±0.18 0.82±0.2 0.73±0.15
Space Pirate Trainer 0.3±0.22 0.96±0.09 0.95±0.1
three VR games. There is a noticeable difference in mean
TABLE IV
values of all the emotion states across three games. stress, is P- VALUES OF T- TEST ( INDEPENDENT SAMPLES ) BETWEEN GAMES FOR
lower for Tripp and higher for Space Pirate Trainer game, EACH CATEGORY OF SCORE FOR THE PR DATA . *p < 0.05, **p < 0.01, †
on the other hand, relaxation is higher for Tripp and lower p < 0.001.
for Space Pirate Trainer game. Another noticeable aspect is Engagement Excitement Stress
that the mean scores between the Tripp and Space Pirate Tripp - Room VR 0.1778 0.0898 0.0014**
Trainer are of major difference on the six emotional states. Room VR -Space Pirate Trainer 0.0127* 0.0001† 0.6059
The levels of engagement, excitement, interest, and stress Tripp - Space Pirate Trainer 0.0018** 0.0† 0.0013**
Relaxation Interest Focus
were incremental from Tripp to Room VR to the Space Pirate
Tripp - Room VR 0.0† 0.1674 1.0
Trainer. Similar to the PM analysis, we conducted t-test for Room VR -Space Pirate Trainer 0.1796 0.0254* 0.0002†
the three games for the player ratings. A statistical significant Tripp - Space Pirate Trainer 0.0† 0.0002† 0.0039**
difference (p < 0.05) is noted in all the six emotion states
between Tripp and Space Pirate Trainer. Similarly, there is a
statistical significant difference in the majority of the emotion C. Comparative Analysis between PM and PR
states (engagement, excitement, interest, and focus), when The goal of this analysis is to address the research question
comparing the Room VR and Space Pirate Trainer. Also, (RQ) by comparing the PM and PR. In this analysis, we had
a statistical significant difference was noted for the stress six PM and six PR values for each player for each game.
(p < 0.01) and relaxation (p < 0.001) emotions between First, we performed the t-test between PM and PR for
Tripp and Room VR. respective emotion state (for example, we compared PM-
excitement with PR excitement). The results of t-test showed a
Discussion: The PM analysis shows that three emotions (en- statistically significant difference (p < 0.05) between 4 out of
gagement, excitement, and focus) do not change across three 6 PM values of the EEG headset with the respective PR values
games, which is counter intuitive, because from the perspective for each game. In Tripp, stress, relaxation, interest, and focus
of in-game activities involved in the three games, the levels of showed statistical significant difference (p < 0.05), while for
focus, engagement and excitement should vary. In Tripp, there other two games, engagement, excitement, interest, and focus
is no scope for fast paced actions, but Space Pirate Trainer showed statistical significant difference (p < 0.05).
involves continuous hands and body movements. So this was For further analysis, we conducted the Spearman’s Rank
indicated in the significant difference between the PM values correlation test between PM and PR (see Fig 2 (b)). In the
in stress between Tripp and Space Pirate Trainer. Only the correlation analysis, the six emotion states from PM and PR
relaxation shows difference in all three games and again this were compared against each other for the three VR games.
highlights the ranging hand and body movements involved in For Tripp, a negative correlation between PM and PR values
the three games. was found for engagement, stress, relaxation and interest,
The PR analysis shows that all the emotions vary across and a low positive correlation between focus and excitement.
games and the increment in level of four emotions (engage- However, for Room VR, a positive correlation was observedwith all the emotion states between PM and PR, except for
excitement. Lastly, the comparison between PM and PR could
be observed from the trends found in independent analysis
of PM and PR in previous section. We noticed that Mean
values of PM and PR (see Table I and III) are different from
each other for respective emotions for each game. Based
on the t-test analysis from Table II and IV, we observed
that compared to PM values, the PR values for most of the
emotion states significantly differ between the games. Fig. 3. MSE of linear models fit with different frequency bands.
Discussion: The comparative analysis using t-test reflects
that the PM and PR are different from each other and this bands is minimum for each emotion state, which indicates
answers our research question (RQ). The correlation analysis that combining all the frequency bands leads to a better
also shows that PM values does not capture the players’ approximation of the level of emotion state LE with PR.
emotion states accurately. The reason for such major difference Another point to note is that the MSE for engagement and
could be associated with the fixed internal configurations interest is lower, while MSE for stress and relaxation is
of Emotiv for PM computations. This indicates that players higher, indicating that engagement and interest can be better
experienced difference in gameplay between the three game approximated when compared to stress and relaxation.
types. However, the PM values from the EEG device did not
capture this difference.
D. Ad-hoc Linear Model for Emotion State Estimation
From comparative analysis, it can be seen the that estimation
of PM values from Emotiv is not consistent with the PR
(players’ real experience), hence they are misleading. We used
ad-hoc linear models to investigate the reliable computation of
PM values, which reflects the actual players’ experience. We
show that a level of an emotion state (for example, excitement)
can be reliably computed from the raw EEG data itself. To
develop a linear model for an emotion state, we used respective
PR values as a ground truth, reflecting the level of emotion
state and power of each sensor for a given frequency band.
Let us denote, the level of an emotion state E as LE , and
the power of kth sensor as Pkσ in a given frequency band
σ ∈ [θ, α, βL , βH , γ, All], where All is full frequency band by Fig. 4. Topographic brain activity heatmap: Linear relation between PR for
computing the average power for each sensor in θ, α, βL , βH , each emotion state and overall power of different sensors, computed through
and γ. Then a linear model for an emotion state E can be Linear Model. Sensors with significant (p < 0.05) relations are highlighted
as white circle.
defined as:
14
X Finally, the coefficients of the linear model with All
LE = w0 + wk Pkσ (1) frequency band were used to demonstrate the relation
k=1 between the emotion states (in reference to PR) and different
For each emotion state (E), a linear model was fit on the regions of the brain (sensors), as shown in Fig 4. Also, Fig.
average power of each sensor in a frequency band, using linear 4 can be seen as an average brain activity map for each
regression by minimizing the Mean Square Error (MSE). The emotion state.
coefficient wk reflects the relation of the level of emotion state
LE with kth sensor. In total, we developed six linear models Discussion: In Fig. 4, the stress and relaxation (which are
for an emotion state with respect to five frequency bands and quite opposite experiences) values show an inverse relation-
All frequency band. ship. Specifically, the prefrontal lobe is positively associated
To compare the linear models of six frequency bands and with stress and negatively associated with relaxation. This
to show the closeness of linear approximation of the level of means, high activity in prefrontal cortex shows the higher
emotion states LE , the MSE of all the linear models across θ, stress level, whereas, low activity shows the higher level of
α, βL , βH , and γ are shown in Fig. 3. relaxation. This observation is aligned with the literature of
The MSE for all linear models is below 0.07, where the Neuroscience, where prefrontal cortex has been associated
PR values range from 0 to 1. This indicates that the linear with executive decisions, including logical and reasoning
approximation is quite close to the actual PR. It can further be skills [25]. It is also aligned with our earlier observations of
observed that the MSE of linear model using All frequency independent analysis of PR. Fig. 4 also shows the sensors thathave significant (p < 0.05) relation with the emotion state, [7] J. Kosiński, K. Szklanny, A. Wieczorkowska, and M. Wichrowski,
highlighted by white circles. “An analysis of game-related emotions using emotiv epoc,” in 2018
Federated Conference on Computer Science and Information Systems
Thus, using this ad-hoc linear model we can estimate the (FedCSIS), 2018, pp. 913–917.
level of six emotion states reliably compared to the in-built [8] T. N. Malete, K. Moruti, T. S. Thapelo, and R. S. Jamisola, “Eeg-
PM algorithm within the EEG device. based control of a 3d game using 14-channel emotiv epoc+,” in 2019
IEEE International Conference on Cybernetics and Intelligent Systems
(CIS) and IEEE Conference on Robotics, Automation and Mechatronics
V. C ONCLUSION (RAM), 2019, pp. 463–468.
[9] G. Schalk, D. Mcfarland, T. Hinterberger, N. Birbaumer, and J. Wolpaw,
In this paper, we combined VR games and an EEG device to “Bci2000: a general-purpose brain-computer interface (bci) system,”
evaluate the players’ emotion states in three VR games. From IEEE Trans. Biomed. Eng., vol. 51, pp. 1034–, 07 2004.
[10] H. R. Khairuddin, A. S. Malik, W. Mumtaz, N. Kamel, and L. Xia,
the results, we found that the players’ subjective emotions “Analysis of EEG signals regularity in adults during video game play
recorded from the questionnaire was different from the emo- in 2d and 3d,” in 2013 35th Annual International Conference of the
tion states determined by the EEG device. So we conducted IEEE Engineering in Medicine and Biology Society (EMBC), 2013, pp.
2064–2067.
a further analysis using ad-hoc linear models to map the [11] H. B., K. Mikami, and K. Kondo, “Adaptable game experience based
relationship between emotion and raw EEG with the players’ on player’s performance and EEG,” 06 2017, pp. 1–8.
subjective experience data as a ground truth. [12] L. E. Nacke, S. Stellmach, and C. A. Lindley, “Electroencephalographic
assessment of player experience: A pilot study in affective ludology,”
In addition to this, the emotions mapped using the ad-hoc Simulation & Gaming, vol. 42, no. 5, pp. 632–655, 2011. [Online].
linear models show better association with players’ subjective Available: https://doi.org/10.1177/1046878110378140
experience data, specifically for the two emotions (stress and [13] A. Stein, Y. Yotam, R. Puzis, G. Shani, and M. Taieb-Maimon,
“EEG-triggered dynamic difficulty adjustment for multiplayer games,”
relaxation). The future work could expand on our foundational Entertainment Computing, vol. 25, pp. 14–25, 2018. [Online]. Available:
ad-hoc linear model analysis by improving the core of the https://www.sciencedirect.com/science/article/pii/S1875952117301325
linear model by combining multiple EEG parameters (such [14] S. Cano, N. Araujo, C. Guzman, C. Rusu, and S. Albiol-Pérez, “Low-
cost assessment of user experience through EEG signals,” IEEE Access,
as facial expressions, in-game reactions and responses, body vol. 8, pp. 158 475–158 487, 2020.
and head motions data) along with ground truth (i.e.) players’ [15] S. Hertweck, D. Weber, H. Alwanni, F. Unruh, M. Fischbach, M. E.
subjective responses to determine the emotions data from raw Latoschik, and T. Ball, “Brain activity in virtual reality: Assessing signal
quality of high-resolution EEG while using head-mounted displays,” in
EEG. 2019 IEEE Conference on Virtual Reality and 3D User Interfaces (VR),
In this research, combining EEG and VR together was 2019, pp. 970–971.
challenging due to the fact that the sensors in the EEG device [16] J. Teo and J. Chia, “EEG-based excitement detection in immersive
environments: An improved deep learning approach,” vol. 2016, 09
can induce issues in data capture even if there is a slight 2018, p. 020145.
disturbance like moving the sensors to adjust the VR headset [17] G. Makransky, T. S. Terkildsen, and R. E. Mayer,
straps. So for the future research in combining these two “Adding immersive virtual reality to a science lab simulation
causes more presence but less learning,” Learning and
devices, a custom headset arrangement/model can be created Instruction, vol. 60, pp. 225–236, 2019. [Online]. Available:
to reduce any discrepancies in the data collection process. https://www.sciencedirect.com/science/article/pii/S0959475217303274
In conclusion, one of the crucial lessons learned from this [18] D. Monteiro, H. Liang, A. Abel, N. Bahaei, and R. d. C. Monteiro,
“Evaluating engagement of virtual reality games based on first and third
experiment is to verify the essential parameters extracted from person perspective using eeg and subjective metrics,” in 2018 IEEE
the EEG device as it can greatly affect the design decisions International Conference on Artificial Intelligence and Virtual Reality
and user experience evaluation. Thus, in this research activity, (AIVR), 2018, pp. 53–60.
[19] J. Heo and G. Yoon, “EEG studies on physical discomforts induced by
we investigated the discrepancy between players’ experience virtual reality gaming,” Journal of Electrical Engineering & Technology,
and data captured using the EEG device and we have provided vol. 15, 02 2020.
an ad-hoc model to extract the player emotions data from the [20] Oculus Quest, “Oculus homepage,” https://support.oculus.com/comfort/,
2021.
raw EEG signals. [21] EMOTIV, “Performance metrics,” https://www.emotiv.com/knowledge-
base/performance-metrics/, 2021.
R EFERENCES [22] EMOTIV-Frequency Bands, “What are they and how do i access
them?” https://www.emotiv.com/knowledge-base/frequency-bands-what-
[1] Dramamine, “Is vr gaming making you sick? use these 5 tips are-they-and-how-do-i-access-them/, 2021.
to keep playing,” https://www.dramamine.com/blog/vr-gaming-making- [23] N. Bajaj, J. R. Carrión, F. Bellotti, R. Berta, and A. De Gloria,
you-sick-use-these-5-tips-to-keep-playing, 2021. “Automatic and tunable algorithm for eeg artifact removal using wavelet
[2] R. Chang, C. Wu, K. He, and B. Lin, “A flexible and wearable decomposition with applications in predictive modeling during auditory
EEG device,” in 2016 Third International Conference on Computing tasks,” Biomedical Signal Processing and Control, vol. 55, p. 101624,
Measurement Control and Sensor Network (CMCSN), 2016, pp. 48–51. 2020.
[3] EMOTIV, “What is an EEG machine? definition & faqs,” [24] A. Gramfort, M. Luessi, E. Larson, D. A. Engemann, D. Strohmeier,
https://www.emotiv.com/glossary/eeg-machine/, 2021. C. Brodbeck, R. Goj, M. Jas, T. Brooks, L. Parkkonen et al., “Meg and
[4] Imotions Publish, “EEG headset prices – an overview of 15+ eeg devices eeg data analysis with mne-python,” Frontiers in neuroscience, vol. 7,
- imotions,” https://imotions.com/blog/eeg-headset-prices/, 2021. p. 267, 2013.
[5] S. Pathirana, D. Asirvatham, and G. Johar, “A critical evaluation on [25] S. Sanei and J. A. Chambers, EEG signal processing. John Wiley &
low-cost consumer-grade electroencephalographic devices,” in 2018 2nd Sons, 2013.
International Conference on BioSignal Analysis, Processing and Systems
(ICBAPS), 2018, pp. 160–165.
[6] J. Larocco, M. Le, and D.-G. Paeng, “A systemic review of available
low-cost EEG headsets used for drowsiness detection,” Frontiers in
Neuroinformatics, vol. 14, 10 2020.You can also read