Waiting for Recovery: The Canadian Labour Market in June 2020 - IZA DP No. 13466 JULY 2020 - Institute of ...
←
→
Page content transcription
If your browser does not render page correctly, please read the page content below
DISCUSSION PAPER SERIES

IZA DP No. 13466

Waiting for Recovery:
The Canadian Labour Market in June 2020

Stephen R.G. Jones
Fabian Lange
W. Craig Riddell
Casey Warman

JULY 2020
DISCUSSION PAPER SERIES

IZA DP No. 13466

Waiting for Recovery:
The Canadian Labour Market in June 2020

Stephen R.G. Jones
McMaster University
Fabian Lange
McGill University, NBER and IZA
W. Craig Riddell
University of British Columbia and IZA
Casey Warman
Dalhousie University and NBER

JULY 2020

Any opinions expressed in this paper are those of the author(s) and not those of IZA. Research published in this series may
include views on policy, but IZA takes no institutional policy positions. The IZA research network is committed to the IZA
Guiding Principles of Research Integrity.
The IZA Institute of Labor Economics is an independent economic research institute that conducts research in labor economics
and offers evidence-based policy advice on labor market issues. Supported by the Deutsche Post Foundation, IZA runs the
world’s largest network of economists, whose research aims to provide answers to the global labor market challenges of our
time. Our key objective is to build bridges between academic research, policymakers and society.
IZA Discussion Papers often represent preliminary work and are circulated to encourage discussion. Citation of such a paper
should account for its provisional character. A revised version may be available directly from the author.

                                                     ISSN: 2365-9793

                                           IZA – Institute of Labor Economics
Schaumburg-Lippe-Straße 5–9                      Phone: +49-228-3894-0
53113 Bonn, Germany                             Email: publications@iza.org                                    www.iza.org
IZA DP No. 13466                                                                                                               JULY 2020

            ABSTRACT
            Waiting for Recovery:
            The Canadian Labour Market in June 2020*
            The Canadian labour market is currently emerging from a holding pattern with unusually
            high numbers in temporary (or “recall”) unemployment, those “employed but absent from
            work” for unspecified reasons, or not in the labour force while waiting to be recalled.
            Two encouraging signs are evident. New postings of vacancies have recovered from 50
            percent to about 80 percent of their pre-crisis level. Also, data suggest that the increase
            in employment in May 2020 is due to some of those waiting to be recalled re-entering
            employment. These patterns suggest that the labour market might rebound quickly.
            Warning signs are that the shares of the unemployed without job attachment as well as
            those on recall engaged in job search are beginning to increase.

            JEL Classification:             J21, J22, J23, J63
            Keywords:                       COVID-19, vacancies, unemployment, employment

            Corresponding author:
            W. Craig Riddell
            Vancouver School of Economics
            Faculty of Arts
            University of British Columbia
            6000 Iona Drive
            Vancouver, BC, V6T 1L4
            Canada
            E-mail: craig.riddell@ubc.ca

            * We would like to thank ESDC for sharing the Job Bank data and Brendon Bernard at Indeed Canada (see https://
            www.hiringlab.org/en-ca/) for sharing the Indeed vacancy index. We also would like to thank the Guest Editor and
            the Editor Michael Veall for useful comments and Ronit Mukherji for excellent research assistance.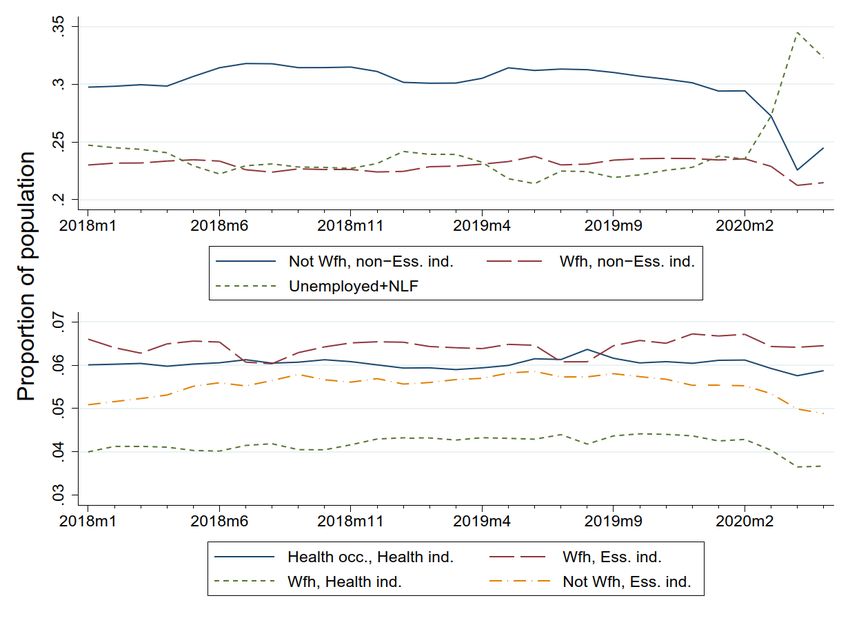
1   Introduction

     The epidemic spread of the Coronavirus in Spring 2020 and the ensuing shutdown of the economy have
     plunged Canada’s labour market into crisis. Within weeks, employment dropped by 15 percent and
     hours worked by 32 percent (Lemieux et al., 2020).1 As noted elsewhere and as we document
     below, much of the employment decline resulted in a rapid increase in temporary layoff
     unemployment. At the same time, job matching in the open market – the forming of new employment
     relationships between previously unconnected job seekers and employers – contracted sharply.

          The length and the depth of the ensuing recession will to a large degree depend on both whether
     those laid off in March and April remain attached to the labour market and on how quickly hiring
     in the open market recovers. Should either fail, the increases in non-employment could potentially
     take years to unwind.

          This paper examines the state of the labour market in early summer 2020 with an eye towards
     two broad, interrelated questions. First, are hiring intentions on the open labour market recovering?
     For example, do we observe firms beginning to be active in hiring beyond simply recalling workers
     previously put on furlough or temporary layoffs? Second, do those separated in March and April
     maintain their links to the labour market? Do they remain closely connected to their prior employers,
     maybe awaiting recall? How is search activity affected among the non-employed?

        We aim to answer these questions three months into the COVID-19 crisis using data from the
     Canadian Labour Force Survey (LFS) and from a set of online Job Boards.2
        Traditionally, the process of hiring is conceived as one where individuals search for jobs and
     employers search for workers. The dynamics of the labour market in June 2020 have largely
     become disconnected from this process. Large parts of the workforce are waiting to rejoin their
     employers and how quickly they are recalled will determine the dynamics of employment and
     unemployment in the next few months. In the background however, the traditional matching process is

1
 Lemieux et al. (2020) estimate the impact of the pandemic on employment and hours of work relative to a no-COVID-19 counterfactual.
2
 The vacancy data spans 5 January 2020 to 10 June 2020. We measure weeks from Wednesday - Tuesday, following the
convention employed by Stata. The LFS data includes the May data released in early June 2020.
+
                                                                 2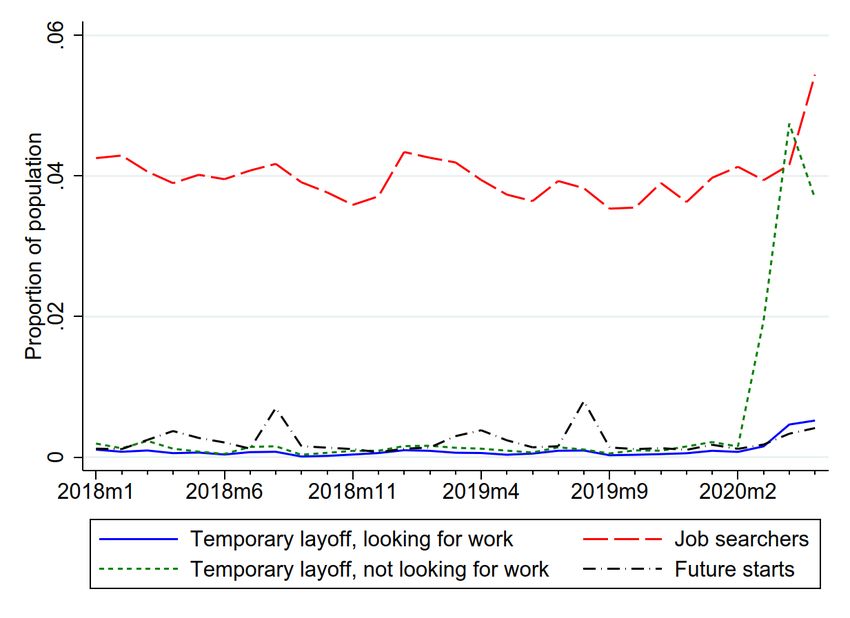
still taking place. We show evidence that the rate of posting new vacancies in Canada recovered to
about 80 percent of the pre-crisis level. And, among the non-employed there are signs that the
number of individuals searching for jobs is increasing. This duality in the labour market between
temporary separations and the open labour market will likely persist through the Summer and Fall.

   We rely heavily on the Labour Force Survey (LFS), a data set that requires little introduction.
In addition, we use data on vacancies provided to us by Employment and Social Development
Canada (ESDC). We use these data together with data from Indeed Canada to measure the
dynamics of labour demand in Section 2. Section 3 presents how employment, unemployment, and
non-participation (not-in-the-labour force, or NILF) evolved over the last few months. We also
explore more detailed information on subgroups within these categories to explore which parts of
the workforce are temporarily or perhaps more permanently separated from their former places of
work. Sections 4 and 5 contain supplemental evidence on heterogeneity of impacts across industries
and occupations as well as provinces.

2   New Vacancy Postings during the COVID-19 Crisis

2.1   Job Bank data

The vacancy data was provided to us by ESDC and contains new vacancies posted on the Job Bank,
a job board maintained by ESDC, as well as new vacancies posted on job boards maintained by
external providers. The external providers include provincial job boards maintained by Employment
Quebec, Saskjobs, and WorkBC as well as some maintained by private job boards such as
Monster.com, Careerbeacon, Jobillico, PSC, and ZipRecruiter. In the following we will refer to
these data as the “Job Bank.”
The disadvantage of the Job Bank data is that it is clearly not a representative sample of job
openings in Canada, such as for instance is provided by Statistics Canada’s Job Vacancy and Wage
Survey (JVWS). As we document in the online appendix, the distribution of postings across
provinces is very uneven, more so than the variation in the size of their labour markets warrants.
To account for this, we reweight the data to match the population distribution across provinces
                                                   3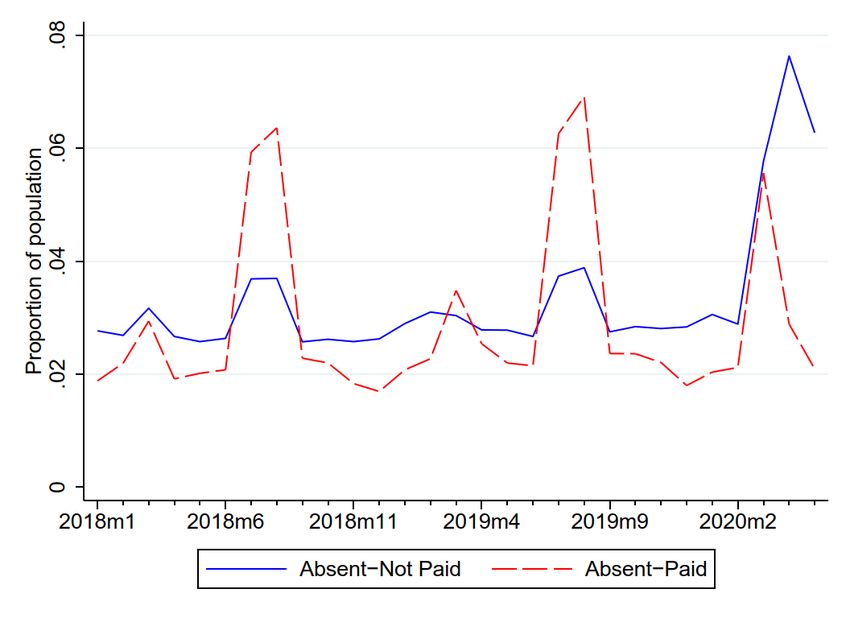
estimated using 2016 Census data. More worrisome still is that between 2015 and 2018, the time-
      series of postings according to the Job Bank data deviates substantially from the time-series
      obtained from the JVWS.

          The crucial advantage of the Job Bank data is that they provide weekly, up-to-date information
      on the number of new vacancies posted. In contrast, the JVWS is a quarterly survey published only
      with long lags.3
          However, as we are concerned about the degree to which the Job Bank data is representative,
      we have obtained an alternative index from Indeed Canada, a private online job board and job search
      company. This alternative index is based on new postings directly on Indeed as well as new postings
      retrieved by Indeed from the net. In the Appendix we show this index for the period between 1
      February 2020 and 5 June 2020. This evidence is consistent with our finding from Job Bank data that
      new posted vacancies declined by about 50 percent between late March and early April and have
      since increased substantially, although the increase in the Indeed data is less pronounced.

      2.2   Aggregate Trends in Vacancy Postings

      Figure 1 shows the evolution of new vacancies posted on Job Bank between 5 January 2020 and
      9 June 2020. Postings declined rapidly to about 50 percent of the level prior to March 15th.
      However, since the beginning of April, the rate at which new vacancies are posted on the Job Bank
      have staged a remarkable comeback. The most recent data (referring to the week ending on June
      9th) suggests that vacancies rebounded to roughly 80 percent of the level attained in the weeks prior
      to the COVID-19 crisis.4 5

3
  The most recent available data is for the 3rd quarter of 2019. This makes it ill-suited for assessing in which
direction the labour market is currently heading.
4
  The Indeed data in the Appendix suggests that the decline in vacancies in the U.S. was not quite as severe as the decline
observed in Canada, but likewise there was less of a recovery in vacancies in the U.S.
5 Comparing the speed of the rebound in the Job Bank data during the Covid-crisis with changes in the hiring intentions index

published by CFIB or the Recruiter-Producer Ratio (Kroft, Lange, Notowidigdo, and Tudball, 2019) over the Great recession suggests
that the rebound in hiring inten-tions in recent months is significantly more rapid. Unfortunately, the CFIB and the Recruiter-Producer
Ratio are not available in real-time nor at sufficiently high frequency to use them to gauge changes in labor demand in the current
crisis.
                                                                   4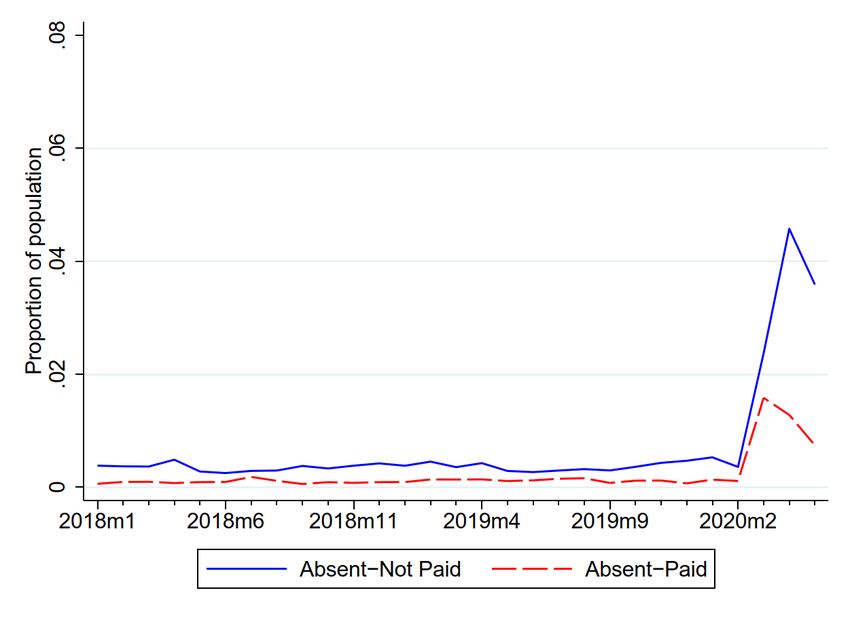
Figure 1: Total Job Postings January-June 2020 on
                                Job Bank and External Sources

Note: Based on Job Bank data provided by ESDC. Weekends omitted. Weighted to distribution across Provinces.
Weeks are defined to start on Wednesdays following the Stata convention.

3   Employment, Unemployment and Labour Force Participation

We now turn to the question how closely attached to the labour market those who lost employment
in the Spring of 2020 remain. We rely on the public use version of the Labour Force Survey from
January 2018 to May 2020. This is a nationally representative survey of the Canadian population.

                                                       5
We restrict the sample to ages 20 to 64.6,7
To begin, we consider the standard labour force states employment E, unemployment U, and
non-participation NILF. We note, and will return to this later, that the standard categories have
some ambiguities. These “grey areas” are even more pronounced at present – in part because of the
nature of the COVID-19 downturn and also to some extent due to policy responses.
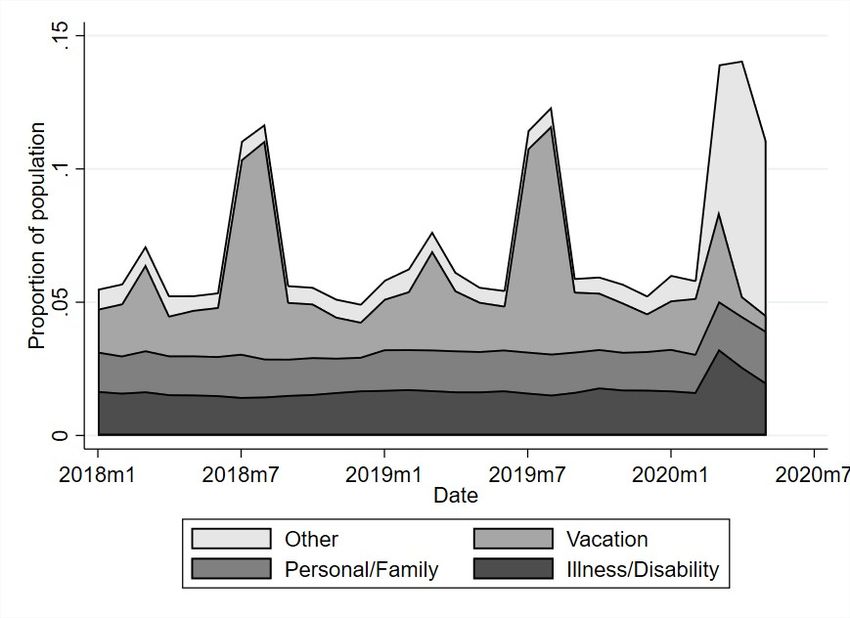
Figure 2 plots employment and unemployment as a fraction of the population, and the non-
participation rate (1 – labour force participation rate) monthly from January 2018 to May 2020.8
Several key points are evident. The employment rate declines sharply by approximately 10
percentage points from February to April before rebounding modestly in May. As expected, a
significant fraction of the employment loss is reflected in higher unemployment – hence the steep rise
in U/POP over the February to May period. However, much of the employment decline also shows
up in the form of a sharp reduction in labour force participation between February and April. For
example, the March LFS reported that more than one million workers lost jobs in the previous month
(Statistics Canada, The Daily, March 2020), yet unemployment increased by less than 450,000.
According to the standard division between unemployment and non-participation (NILF) which is
based on reported job search, more than one-half of these job losers withdrew from the workforce
and a bit less than one-half increased the stock of the unemployed.9
We next illustrate and discuss the margins between employment and non-employment and,
within the non-employed, between unemployment and non-participation. Our objective is both to
provide a broad picture of the nature of the COVID-19 downturn in the labour market and to
6
As was seen with the U.S. Current Population Survey, the LFS experienced a decline in the response rate with the onset of COVID-
19. In March 2020, the face-to-face interviews were replaced by telephone interviews. The unweighted sample size dropped from around
100 thousand to around 90 thousand.
7
Doing so makes our results easily compared to those of Lemieux et al. (2020) who also use this age range.
8
LFS data in this paper are not seasonally adjusted.
9
With two exceptions, to be classified as unemployed LFS respondents must be available for work and report job search. The exceptions
are temporary layoffs – those who either have a definite date to return to work or an indication from their employer that they will be
recalled – and those who have a job lined up to start within the next 4 weeks, termed “future job starts.”
6Figure 2: Labour Force Shares of Population
Note: LH scale for E/POP and NILF/POP; RH scale for U/POP.
assess the extent to which the non-employed want to return to work. The principal findings are:
• The decrease in measured employment vastly understates the decline in work performed during
April and May 2020. An additional 8-9 percentage points of the population are now reporting
full-week absences from work and most of these are not being paid by their employers.
• Most of the unemployed are not traditional job seekers but rather are waiting to be recalled
to their former jobs. The majority of those awaiting recall are not currently searching for
work. Since March, the number of unemployed that is seeking new employment has
increased only by about one percentage point.
7• Among those not-in-the-labour force, there has been a marked rise in those displaying Marginal
Attachment to the labour force, reporting a desire for work but not currently engaged in job
search.
3.1 Employment Rates
The margin between employment and non-employment is usually viewed as being well defined.
However, during the COVID-19 downturn this margin has become less well defined in that a
significant share of workers reported being absent from work for unspecified reasons. Many of these
have not continued to be paid during this period.
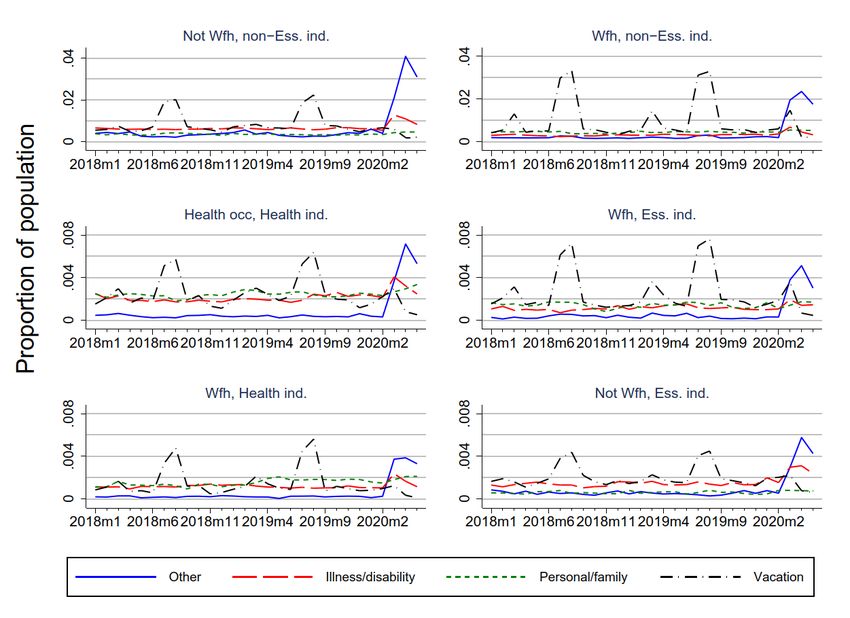
Figure 3 shows the composition of the employed (as a proportion of the population) that report
being absent for the full week from work for the period since January 2018. In normal times, about 5-6
perecent of the population is absent from work. The main reasons offered to explain these absences are
being on vacation, illness/disability, and personal/family reasons. Not surprisingly, there is a strong
seasonal pattern in vacations with many employees being on vacation in July and August and a
smaller spike in March during the school break period. The ‘Other’ category is usually small. By
contrast, we saw huge increases in those reporting absence for ‘Other reasons’ in March and April
followed by a modest decline in May.10 The question is: are these individuals any different from
those who report being on recall and are categorized as unemployed on temporary layoff?
One clue to answering this question is to ask whether those absent from work were paid or not.
This information is only available for full-week absences and also excludes self-employed
unincorporated workers. Figure 4 shows that initially in March, around half the full-week absences
were paid and the other half were not paid.11 However, by the reference period in May, paid absences
had returned to pre-COVID-19 levels, while unpaid absences continued to be unusually elevated.
10
Similar behaviour is evident in the U.S. CPS. Indeed, in its May release (https://www.bls.gov/news.release/empsit.nr0.htm) the BLS
drew attention to a “misclassification error” in its data and reported the official unemployment rate and the rate including this ‘Employed
absent for other reasons’ group. Inclusion of this group raised the U.S. unemployment rate by a striking three percentage points from
13.3 perecent to 16.3 percent.
11
See Figure A3 for the same results restricted to those absent for “Other” reasons.
8Figure 3: Share of Employed Full Week Absent from Work by Reason
Note: Authors’ calculations based on the LFS. “Other” includes: no work available, seasonal business, strike/lockout,
and other related reasons. “Personal/family” includes: caring for own children, elderly relative, maternity/paternity
leave and other related personal/family reasons. Calculated as share of population ages 20-64.
To summarize, in addition to the decline in the employment rate of about 10 percentage points of the
working age population (Figure 2), the share of those with full-week absences from work increased by an
additional 8-9 percentage points (Figure 3), most of whom are not being paid during their absence (Figure
4).12 There is thus a very sizeable part of the workforce that is not productive, that is not being paid, but
that still reports being attached to their employers. This group may be vulnerable to more formal
separations from their employers if the economic downturn deepens and/or lengthens.
12
Lemieux et al. (2020) report that employment excluding those absent from work declined by 15 percentage points in
March and April 2020 relative to the no-COVID counterfactual. We refer the reader to this paper for a detailed analysis of
the heterogeneity in the decline in employment during the immediate onset of the COVID-19 crisis.
9Figure 4: Paid for Time Off, Full-week Absences
Note: Authors’ calculations based on the LFS. The paid for time off information is not available for self-employed
unincorporated workers. “Other” includes: no work available, seasonal business, strike/lockout, and other related
reasons. “Personal/family” includes: caring for own children, elderly relative, maternity/paternity leave and other
related personal/family reasons. Calculated as share of population ages 20-64.
3.2 Unemployment Rates
In addition to complicating the employment/non-employment margin, the upheavals of the COVID-
19 era have generated dramatic changes in how unemployment is conceptualized, calling into
question standard modes of labour market classification. While official statistics show an
unemployment rate of 13.7 percent in May 2020, down slightly from April, the composition of this
unemployment is in many ways the larger story.
10Figure 5: Categories under Unemployed
Note: Authors’ calculations based on the LFS. Calculated as share of population ages 20-64.
In normal times, the vast majority of official unemployment is made up of job searchers who are
currently available for work, with both temporary layoffs (who must be available for work but do
not have to report job search) and short-term future job starts (within the next four weeks) being very
small in comparison. The levels for 2018 and 2019 in the pre-COVID-19 period in Figure 5 illustrate
the relative magnitudes of these subgroups within unemployed that are usually observed. To
illustrate the extent to which those that lost employment during COVID crisis are engaged in job
search, we identified all job losers with a duration of joblessness of 3 months and less. Among
these, in May 2020, 23.1 percent are unemployed and actively searching for employment (whether
on temporary layoff or not). This compares to 58.2 percent in the analogous group in May 2019.
11Since March 2020, however, there has been a dramatic rise in unemployment owing to
temporary layoff such that this component of unemployment is now as large as the group of job
searchers (Figure 5). We see in this figure that most of this increase in temporary layoffs resulted from
those who are not searching for jobs. Overall, we believe that this means that among those
unemployed a much higher proportion than ever before maintains close ties with a previous
employer. We also note that the entire decline in unemployment from April to May 2020 comes from
a reduction of the temporarily unemployed that are not currently looking for work, plausibly as a
consequence of first efforts to reopen the economy, especially in Québec (see Section 5).
The data also shows that search unemployment is increasing, even if substantially less rapidly
than unemployment amongst those not engaged in search. Adding together those on temporary layoff
that are currently also looking for jobs and regular job searchers, we obtain that the fraction looking
for work has risen by about one percentage point between March and May. This is likely because (i)
the decline in labour demand (Section 2) makes it harder for job searchers to find employment and
(ii) some of those temporarily unemployed start separating from their former employment. These
statistics on job seekers are, we believe, particularly noteworthy and bear following closely in
subsequent months to gauge how much longer-lasting damage is being inflicted on the labour
market.
3.3 Marginal Attachment and NILF
Past labour market research on the heterogeneity of the NILF group has highlighted the importance
of the “want work” question, with individuals professing a desire to work being a distinct group from
the balance of non-participants. Members of this group, termed the marginally attached, display
subsequent movement into employment at transition rates that are typically not much below the
average rate for the officially unemployed (Jones and Riddell, 1999). As such, they represent a
group that exhibits substantial attachment to the labour market. Moreover, a body of work shows
that such marginal attachment behaviour is found in both Canada and the U.S. (e.g., Jones and
12Riddell (2019)), as well as in a number of other economies.13
Figure 6: Not in the Labour Force: Marginally Attached and NILF without Marginally Attached
Note: Authors’ calculations based on the LFS. Calculated as share of population ages 20-64.
13
Moffat and Yoo (2015) report similar evidence for the UK based on a reported desire for work. In many European countries
Brandolini, Cipollone and Viviano (2006) find similar distinct differences between ‘potentials’ and ‘unattached’ based on past job
search that doesn’t meet the ILO cutoff of search within the past 4 weeks to be classified as “unemployed”.
13In the COVID-19 era, Figure 6 shows the huge increase in share of Marginal Attachment in
NILF. Between February and April 2020, the relative importance of Marginal Attachment rose
markedly, with about 1.5 million individuals exhibiting that level of attachment in April (official
unemployment was 2.4 million in that month). The small signs of improvement in the labour market in
May are also evident in the Marginal Attachment series in Figure 6, with the drop in May paralleling
the dip in temporary layoff unemployment seen in Figure 5 above.
Among the Marginally Attached, Figure 7 shows a substantial compositional change,
analogous to the change in the composition of official unemployment seen in Figure 5. The
Marginally Attached can be classified according to the reason they give for not searching, although
they report a desire for work, and the resulting classification includes “discouraged workers” (who
report a belief that no work is available), those not searching for personal reasons and those
“waiting” for replies to past job search efforts or recall to a former job.14 Evidence suggests that,
at least in normal times, the “waiting” sub-group displays the highest degree of labour market
attachment (Jones and Riddell, 1999).
Since February 2020, the dramatic composition change in Marginal Attachment has been largely
due to growth in those awaiting recall or those NILF for “other reasons”. These two categories
account for approximately 4 percentage points of the total increase in those Marginally Attached. In
addition, there has been a clear rise in the discouraged worker group, although quantitatively it
remains a small part of the Marginal total.
Overall, a substantial fraction of the increase in NILF consists of individuals that are on recall
and waiting to be rehired from their former employers. We do not know how many among the
Marginally Attached for “other reasons” are permanently separated from their employers and how
many should be thought of as waiting to be rehired. While we do not have direct evidence, we
suspect that the availability of child care and the timing of school re-openings may have important
effects on the composition of this Marginal Attached group within NILF.
14
In the LFS those awaiting recall to a seasonal job are not classified as “temporary layoffs”. Given the importance of seasonal work
in Canada, this group may account for much of the “awaiting recall” category.
14Figure 7: Categories under Marginally Attached
Note: Authors’ calculations based on the LFS. Calculated as share of population ages 20-64. Categories are stacked,
height represents monthly cumulative total.
4 Essential and Non-essential Industries and Work from Home
Occupations differ in the ability of workers to perform work from home rather than on-site.
Occupations that allowed working from home have, to a degree, shielded workers from job loss. For
example, in the U.S., Kahn et al. (2020) show that initial unemployment claims increased by more
in occupations amenable to work-from-home. However, Kahn et al. (2020) also found that vacancy
postings declined by more in occupations that could be performed from home rather than required
being on-site.15
15
They exclude health and essential retail, mostly grocery stores, from occupations that require work on-site.
15In this Section, we explore to what extent labour demand (measured by vacancies) varies across
occupations by whether they could be performed from home or not, and by whether the occupations
were in the health sector. We rely on the Dingel and Neiman (2020) score (DN-score hereafter) to
determine the ability to work-from-home. Dingel and Neiman (2020) use O∗NET data to assign to each
occupation a score varying between 0 and 1 that measures the ability to work from home in this
occupation. For the Job Bank data, we map the DN-score onto the 4-digit NOC system at our disposal
and classify an occupation to work-from-home if the score is above 0.5.16 For the LFS,
unfortunately, the public use version only provides 2-digit NOC codes. We therefore make use of the
detailed NOC counts from the 2016 Census as weights to account for the relative size of each 4-digit
NOC within a 2-digit NOC category.17
Looking first at the Job Bank data, Figure 8 shows that health follows its own patterns in that
the decline in vacancies was less pronounced in the immediate aftermath and that current rates of
vacancy posting are running at or above those seen prior to mid-March.
The ability to work-from-home, however, has no impact on labor demand as measured by
vacancy postings. For both categories we see that demand declined by about 50 percent in the first
four weeks of the crisis with a recovery to close to 80 percent in recent weeks. We interpret this as
evidence that the deterioration of labour demand in March and early April was broad and driven by
factors beyond the immediate ability to perform the work. We also observe that the recovery in
postings since mid-April has been similarly broad.
In Figure 9, we see that non-employment has increased (top panel, short dashes) by about 10
percentage points in the age-group 20-64.18 Much of this increase comes from a decline in
16
Approximately 0.35 percent of vacancies in the Job Bank data did not have a valid NOC code. We exclude these vacancies from the
analysis. Most occupations have a DN score close to either 0 or 1, so that our results are robust the choice of the exact cut-off on the DN
scale to determine whether an occupation can be performed from home. We show the distribution of the DN-score in the appendix.
17
Gallacher and Hossein (2020) also apply the DN score to Canadian data. Using counts from the 2016 Census, they show that around
41 percent of jobs can be performed at home. They also use the LFS and find that being able to work remotely helped shelter workers
from the initial employment loss between February and March. However, they note that this was no longer true between March and
April.
18
We use the two-digit industry and occupation variables available in the public use LFS to classify health, essential (non-health)
industries and non-essential industries. Health includes all health industries and health related occupations. Essential industries include
professional occupations in law and social, community and government services, paraprofessional occupations in legal, social,
community and education services, occupations in front-line public protection services, as well as workers in agriculture, transportation
and warehousing, and finance and insurance industries. Non-essential industries include all the remaining occupations and industries.
16employment in occupations that are not amenable to work-from-home in non-essential industries.
However, there are sizable declines in other industries groups as well. In particular, there is a large
percentage point decline in employment in occupations capable of work-from-home in non-essential
industries. Overall, we see that only work-from-home, essential and health did not see their
employment fall considerably.
Figure 8: Vacancy Postings by Ability to Work-from-Home
Note: The graph shows the ratio of vacancy posted in health (NOC-Digit 3) as well as by ability to work from home
(Dingel-Neiman>0.5) Normalized to the week of March 4-10, 2020.
In Figure 10, we further break up the absent category where we combine information on whether
or not the job could be done from home, whether the job is in the Health sector and whether the job is
categorized as essential or non-essential. All jobs find a large increase of those that are absent, but
17again, as is seen with the overall values in Figure 3, the increase is mostly concentrated in the
“Other” category. This is particularly pronounced for the not work-from-home in non-essential
industries, who make up almost half of the overall increase in absent from work seen in Figure 3.
Figure 9: Share of Employed by Health/Work from Home/Not work from Home
Essential/Non-Essential Worker
Note: Authors’ calculations based on the LFS. Calculated as share of population ages 20-64.
18Figure 10: Breakdown of Absent category by Occupation/Industry
Note: Authors’ calculations based on the LFS. “Other” includes: no work available, seasonal business, strike/lockout,
and other related reasons. “Personal/family” includes: caring for own children, elderly relative, maternity/paternity
leave and other related personal/family reasons. Calculated as share of population ages 20-64.
5 Province Level Differences
Our final breakdown examines the variation across provinces and time. First, looking at the vacancy
postings from the Job Bank data, Table 1 shows the decline across 3 week periods before and after
19Table 1: Ratio of Vacancies Prior and Post March 15th, by Province
Province Post- / Pre-March 15th
Vacancies
Newfoundland and Labrador 0.48
Prince Edward Island 0.49
Nova Scotia 0.61
New Brunswick 0.48
Québec 0.56
Ontario 0.64
Manitoba 0.54
Saskatchewan 0.51
Alberta 0.65
British Columbia 0.65
Northern Canada 0.44
Total 0.55
Note: Authors’ calculations using Job Bank Data.
the pivotal March 15th. This Table shows that the decline in vacancy postings was broad based and
of roughly similar magnitude across Canada. Among the larger provinces, the decline was more
pronounced in Québec where vacancies declined to about 56 percent of the pre-period, whereas
vacancies in British Columbia, Alberta, and Ontario declined by a little more than about one-third.
Québec also stands out in that the number of new vacancies posted has recovered more rapidly in
Québec than in the other provinces. Figure 11 shows vacancies posted on the Job Bank in Québec
compared with the other three most populous provinces. In Québec the recovery in vacancies began
earlier and was substantially larger than in other provinces. Figure 12 illustrates how employment
varied across the same provinces. We find that the decline in employment is roughly the same order
of magnitude in these four provinces, although it is slightly larger in Québec. However, employment
also recovers more rapidly in Québec than in Alberta, Ontario, or British Columbia.
While Figure 12 highlights the large drop in employment across the provinces, we know
20Figure 11: Vacancy Postings across the 4 Largest Provinces
Québec Ontario
1.2
1
.8
.6
Vacancies Posted
.4
Alberta British Columbia
1.2
1
.8
.6
.4
01/08 02/05 03/04 04/01 04/29 05/27 01/08 02/05 03/04 04/01 04/29 05/27
Week of 2020
Note: Normalized against March 4-10.
from the absent from work analysis that employment itself may provide a misleading story. Again,
the true fraction of those employed actually engaged in work may be overstated due to workers being
absent but counted as employed. Another way to examine this issue is through hours of work. This
would not only account for the effect of those absent from work, but will also capture any drop in
hours for those present at work. In Figure 13, we see the decline in the hours worked conditional per
employed worker was substantially more pronounced in Québec. However, again, we observe that
for this measure as well that the recovery was relatively pronounced in Québec as compared to the
other large provinces.
21Figure 12: Employment Rates across the 4 Largest Provinces
Québec Ontario
.8
.75
.7
Employed/population
.65
Alberta British Columbia
.8
.75
.7
.65
2018m1 2018m7 2019m1 2019m7 2020m1 2018m1 2018m7 2019m1 2019m7 2020m1
Note: Authors’ calculations based on the LFS. Calculated as share of population ages 20-64.
Overall, we observe that the labour market in Québec seems to have rebounded more rapidly
than in the Rest of Canada, even though across the country there is still a long way to go to return
to a normal state of affairs.
22Figure 13: Total hours/employed workers across the 4 largest Provinces
Québec Ontario
40
35
Hours/employed workers
30
25
Alberta British Columbia
40
35
30
25
2018m1 2018m7 2019m1 2019m7 2020m1 2018m1 2018m7 2019m1 2019m7 2020m1
Note: Authors’ calculations based on the LFS. Calculated as share of population ages 20-64.
236 Conclusion
The Canadian labour market has been hit hard by the COVID-19 crisis. The first half of 2020 saw
unprecedented changes in both employment and unemployment and changes in the underlying
behaviours not adequately captured by the labor force classifiations as traditionally measured. It also
saw a 50 percent drop in labour demand, measured by n e w vacancy postings, with some signs of a
recovery in the past two months. There was important variation by occupation, particularly as it
affected the ability to work from home, and by province.
Going forward, we think three groups will be critical for how the labour market develops: (i)
the employed but absent from work; (ii) the unemployed on layoff but not searching for a job; and
(iii) the marginally attached within NILF who want work but are not searching for a variety of
reasons.
First, for individuals -- paid or unpaid -- who report remaining attached to a job but absent from
work, their attachment to employment may be maintained in part by the Canada Emergency Wage
Subsidy (currently in place to the end of August 2020), the Canada Emergency Response Benefit
(currently available for a maximum of 24 weeks to the start of October 2020), and existing (pre-
COVID-19) programs such as EI. It will be important to study the effects of these policy responses
as evidence becomes available. Maintaining the match-specific gains of established employer-
employee relationships is likely critical to a restoration of job productivity in the recovery.
Second, there has been an unprecedented rise in temporary layoff unemployment such that, for
the first time, there were more unemployed on layoff than engaged purely in job search. To date,
a large majority of this temporary layoff group have not reported job search, which perhaps means
that these individuals retain relatively strong ties to the past job. But the fraction of the layoff
unemployed with job search rose in April and May, potentially a response to the growing
opportunities seen in the vacancy data, and this may also indicate some rupture of past employer-
employee relationships. A key issue as unemployment spells lengthen will be whether temporary
layoffs become permanent separations, and whether rates of transition into employment exhibit
marked duration dependence as the jobless period continues. Although there is some evidence to
24suggest that such dependence is less pronounced in weak labour markets (Kroft, Lange &
Notowidigdo, 2013), consistent with an employer screening model, it is an open question whether
these results are robust to the widespread weakness of labour markets experienced in the COVID-
19 era. As with the employed but absent group, we also note the critical role of labour market
policies relating to the unemployed in shaping the evolution of worker-firm attachments.
Third, the first half of 2020 has seen a huge growth in the numbers of the marginally attached,
while the balance of those not in the labour force has remained relatively stable. To the extent that
the marginal group remain “closer” to the labour market than the NILF group as a whole, and have
better employment prospects going forward, this may be a positive sign. But if some of the growth
in the marginal group is rather due to a lack of job search by individuals who might otherwise have
been categorized as unemployed, the degree of attachment to the labour market may have fallen.
If the recall anticipated by many of these marginally attached workers fails to transpire, the longer
term prospects are for further breakdown of linkages to the labour market.
In closing, we comment on the data available in Canada for analysis of labour market
developments in the current circumstances. The LFS is a key Canadian data source for timely
information on the labour market impact of the ongoing COVID-19 crisis, with monthly data released
only a few weeks after collection. Statistics Canada also responded to the pandemic by adding
questions specific to COVID-19 to the LFS. However, to paint a more complete picture of how the
economy is performing, it is imperative also to have timely and accurate vacancy data. Currently,
the Job Vacancy and Wage Survey (JVWS), a key quarterly dataset for determining labour market
demand in Canada, has a long lag before being released for analysis. At time of writing, the most
current JVWS data are from the third quarter of 2019. Moreover, we understand that JVWS data
collection has been temporarily suspended following the onset of the COVID-19 crisis. We
believe that vacancy data remain critical for our understanding of the prospects for and the shape
of eventual recovery in Canada’s labour market.
25References
Brandolini, Andrea, Piero Cipollone and Eliana Viviano (2006). ‘Does the ILO Definition
Capture All Unemployment?’ Journal of the European Economic Association 4(1) 153-179
Dingel, Jonathan I., and Brent Neiman (2020) ‘How many jobs can be done at home?’ Working
Paper 26948, National Bureau of Economic Research, April
Gallacher, Guillermo and Iqbal Hossein (2020) ‘Remote Work and Employment Dynamics under
COVID-19: Evidence from Canada’ Canadian Public Policy/Analyse de politiques
https://doi:10.3138/cpp.2020-026
Jones, Stephen R.G., and W. Craig Riddell (1999) ‘The measurement of unemployment: An
empirical approach.’ Econometrica 67(1), 147–162
(2019) ‘Unemployment, marginal attachment and labor force participation in Canada and the
United States.’ Journal of Labor Economics 37(S2), S399–S441
Kahn, Lisa B., Fabian Lange, and David G. Wiczer (2020) ‘Labor demand in the time of COVID-
19: Evidence from vacancy postings and UI claims.’ Working Paper 27061, National Bureau of
Economic Research, April
Kroft, Kory, Fabian Lange, and Matthew J. Notowidigdo (2013) ‘Duration Dependence and
Labor Market Conditions: Evidence from a Field Experiment.’ Quarterly Journal of
Economics 128(3), 1123–1167
Kroft, Kory, Fabian Lange, Matthew J. Notowidigdo, and Matthew Tudball (2019) ‘Long Time
Out: Unemployment and Joblessness in Canada and the United States,’ Journal of Labor
Economics, 37(S2), S355-3397
Lemieux, Thomas, Kevin Milligan, Tammy Schirle, and Mikal Skuterud (2020) ‘Initial impacts of
the COVID-19 pandemic on the Canadian labour market.’ Canadian Public Policy/Analyse de
politiques https://doi.org/10.3138/cpp.2020-049
Moffat, John and Hong Il Yoo (2015). “Who are the unemployed? Evidence from the United
Kingdom” Economics Letters 132: 61-64.
26A Appendix
A.1 Supplemental Figures - Ability to Work from Home
Figure A1 shows the distribution of the DN score in our data, binning occupations into 5 groups.
Clearly, most occupations fall on the end-points of the distribution. In the paper, we categorize an
occupation as an occupation that can be performed from home if its score exceeds 0.5. Not
surprisingly, given the distribution shown in Figure A1, our estimates are not sensitive to varying
the cutoff point of 0.5.
We exclude health from this as demand for healthcare workers clearly was subject to different
considerations during the crisis. We therefore obtain a classification scheme with 3 categories: 1.
Health, 2. Wfh (work from home), and 3. Not-Wfh, where the latter two only apply to non-health
occupations.
27Figure A1: Distribution of Ability to Work from Home
.6
.4
Fraction
.2
0
0 .2 .4 .6 .8 1
Mean of ability to work from home
Note: The histogram plots 5-bin histogram of vacancies posted in the 3 weeks prior to March 15th by the Dingel-
Neiman score of ability to work from home. We mapped the Dingel-Neiman score onto the 4-digit NOC.
A.2 Appendix: Indeed Vacancy Index
Indeed collects data on vacancy postings on their job board as well as from other online sources.
We received access to these data from Brendon Bernard, economist at Indeed Canada. Please refer
to https://www.hiringlab.org/en-ca/ for more detail and analysis on this data.
In Figure A2 we show the vacancy index for both Canada and the US indexed against the first
full week of March. This index is constructed based on a dual averaging procedure to remove daily
28fluctuations. Indeed first averages new postings across the last 7 days and then averages the
resulting number across the last seven days. Therefore, the index is based on a weighted average
across the last 14 days of postings. The weight on these 14 days is 1 for postings 14 days old and
rises linearly to reach 7 for postings 7 days old. It then declines again linearly to reach 1 for the
most recent postings.
The Indeed Index is therefore somewhat more backward looking than the vacancy index we show
in Section 2.
Figure A2: Indeed Vacancy Index: Febr 4-June 2
Note: Indeed Vacancy Index provide by Indeed Canada. Please see https://www.hiringlab.org/en-ca/
29Figure A3: Paid for time off, full-week absents for labour related reasons
Note: Authors’ calculations based on the LFS. The paid for time off information is not available for self-
employed unincorporated workers. Absents restricted to “Other” reason which includes: no work available,
seasonal business, strike/lockout, and other related reasons. Sample restricted to individuals aged 20-64.
30You can also read